A curated collection of mesoscopic vessels and their mesmerizing geometry. These are strictly selected from the papers that I have read or written myself in which I can see the meso-vessels clearly.
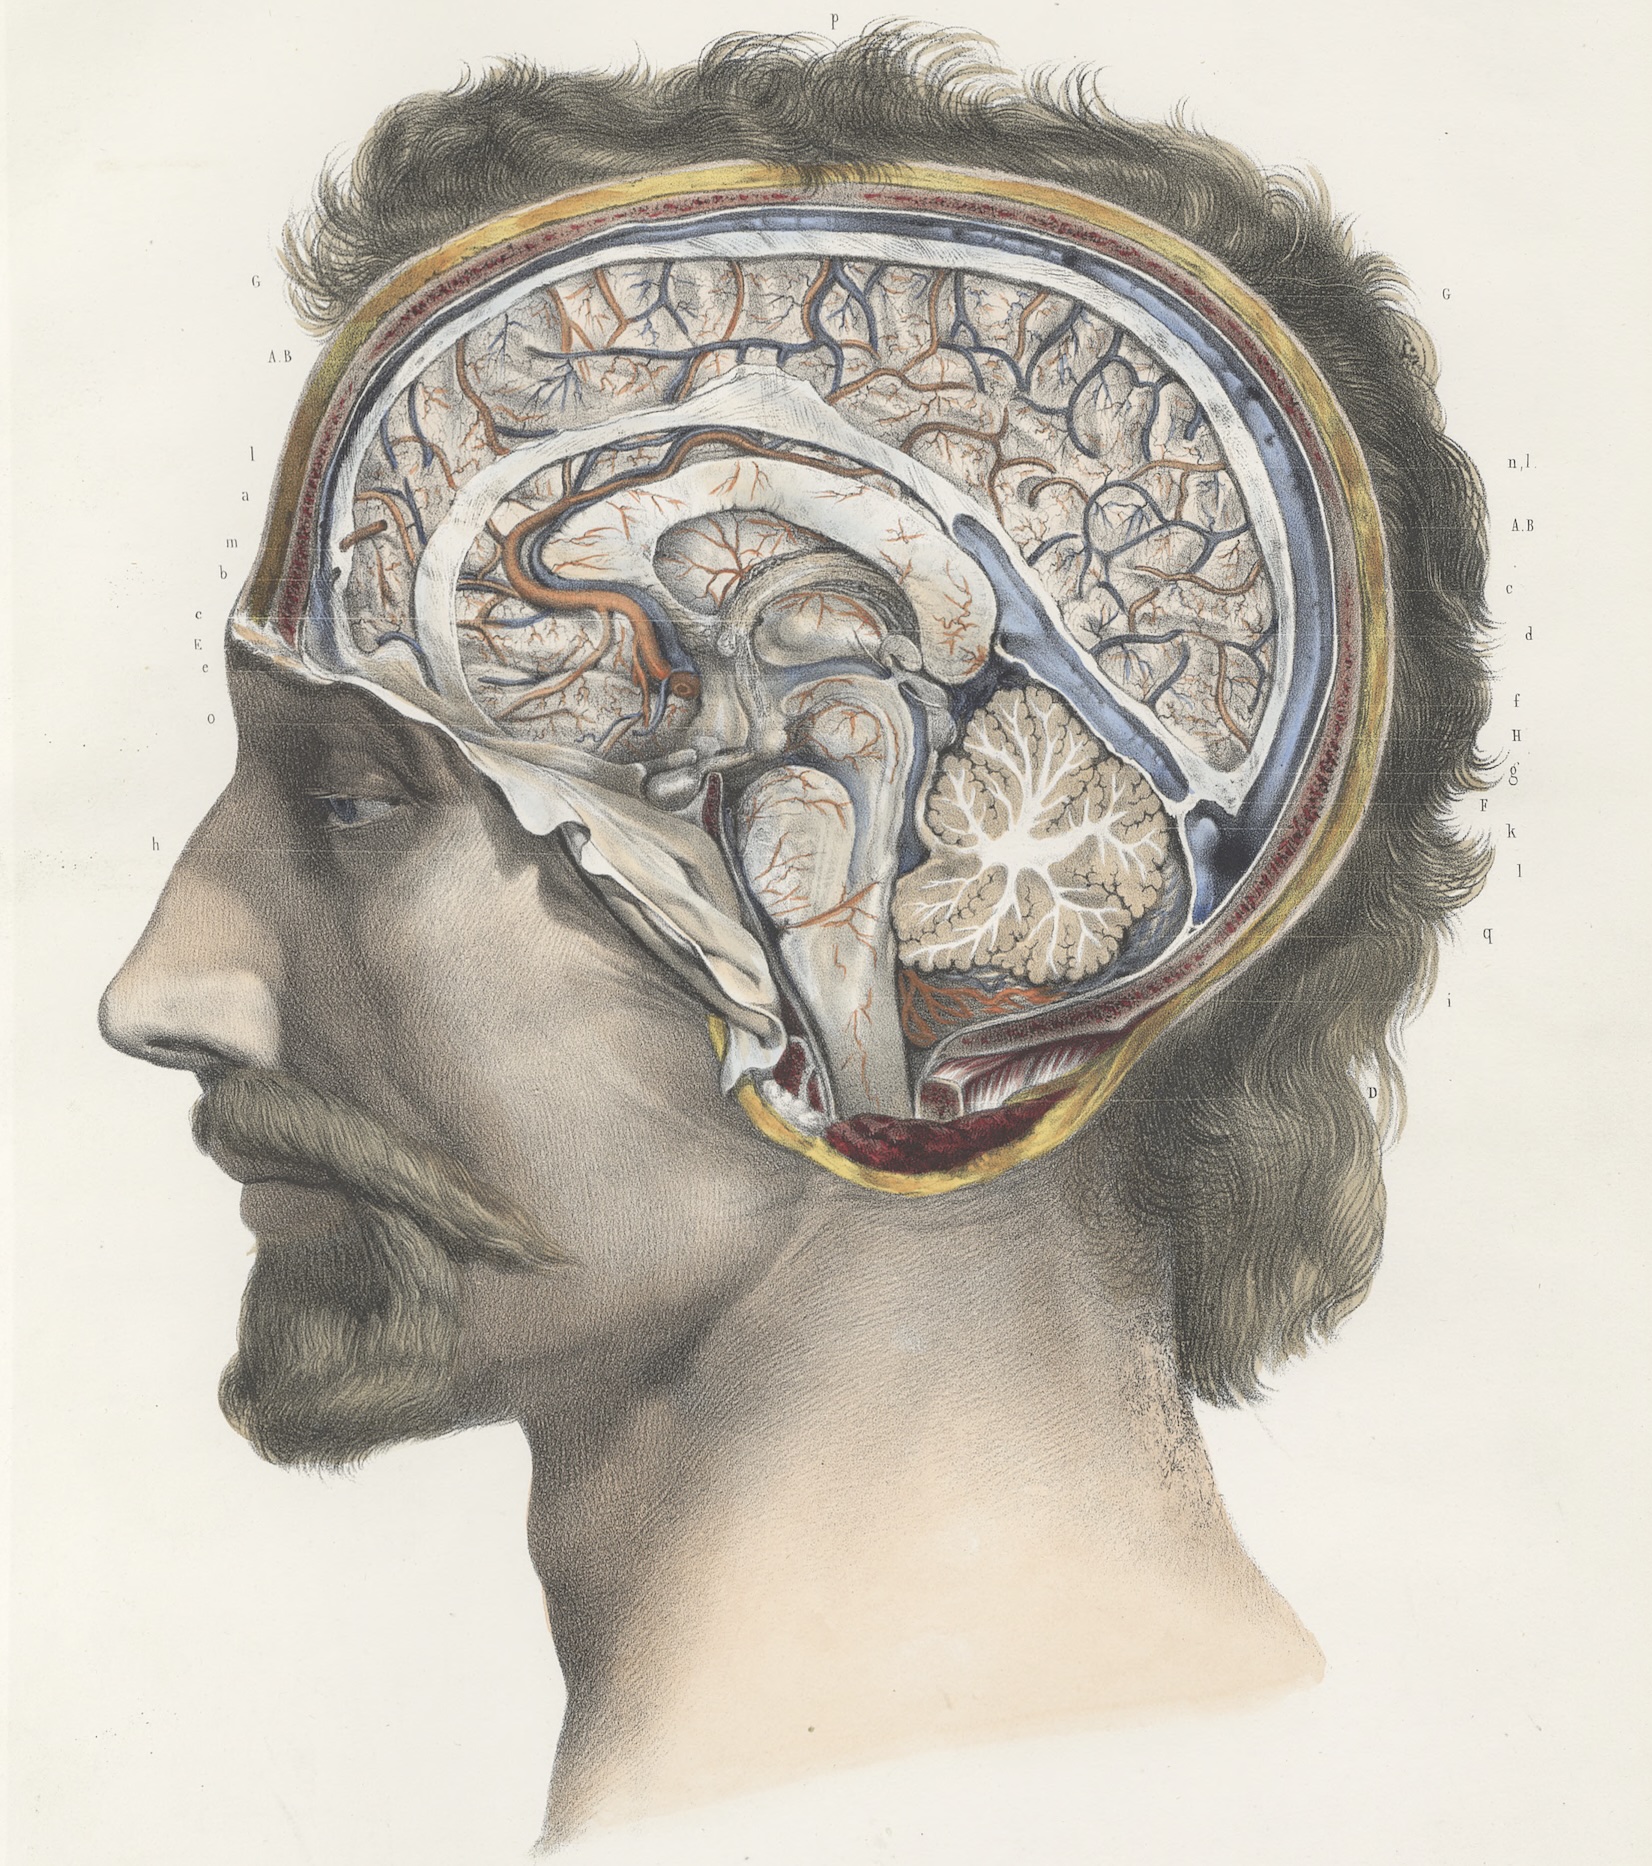
Did I miss something? Contact: <[TODO]>.
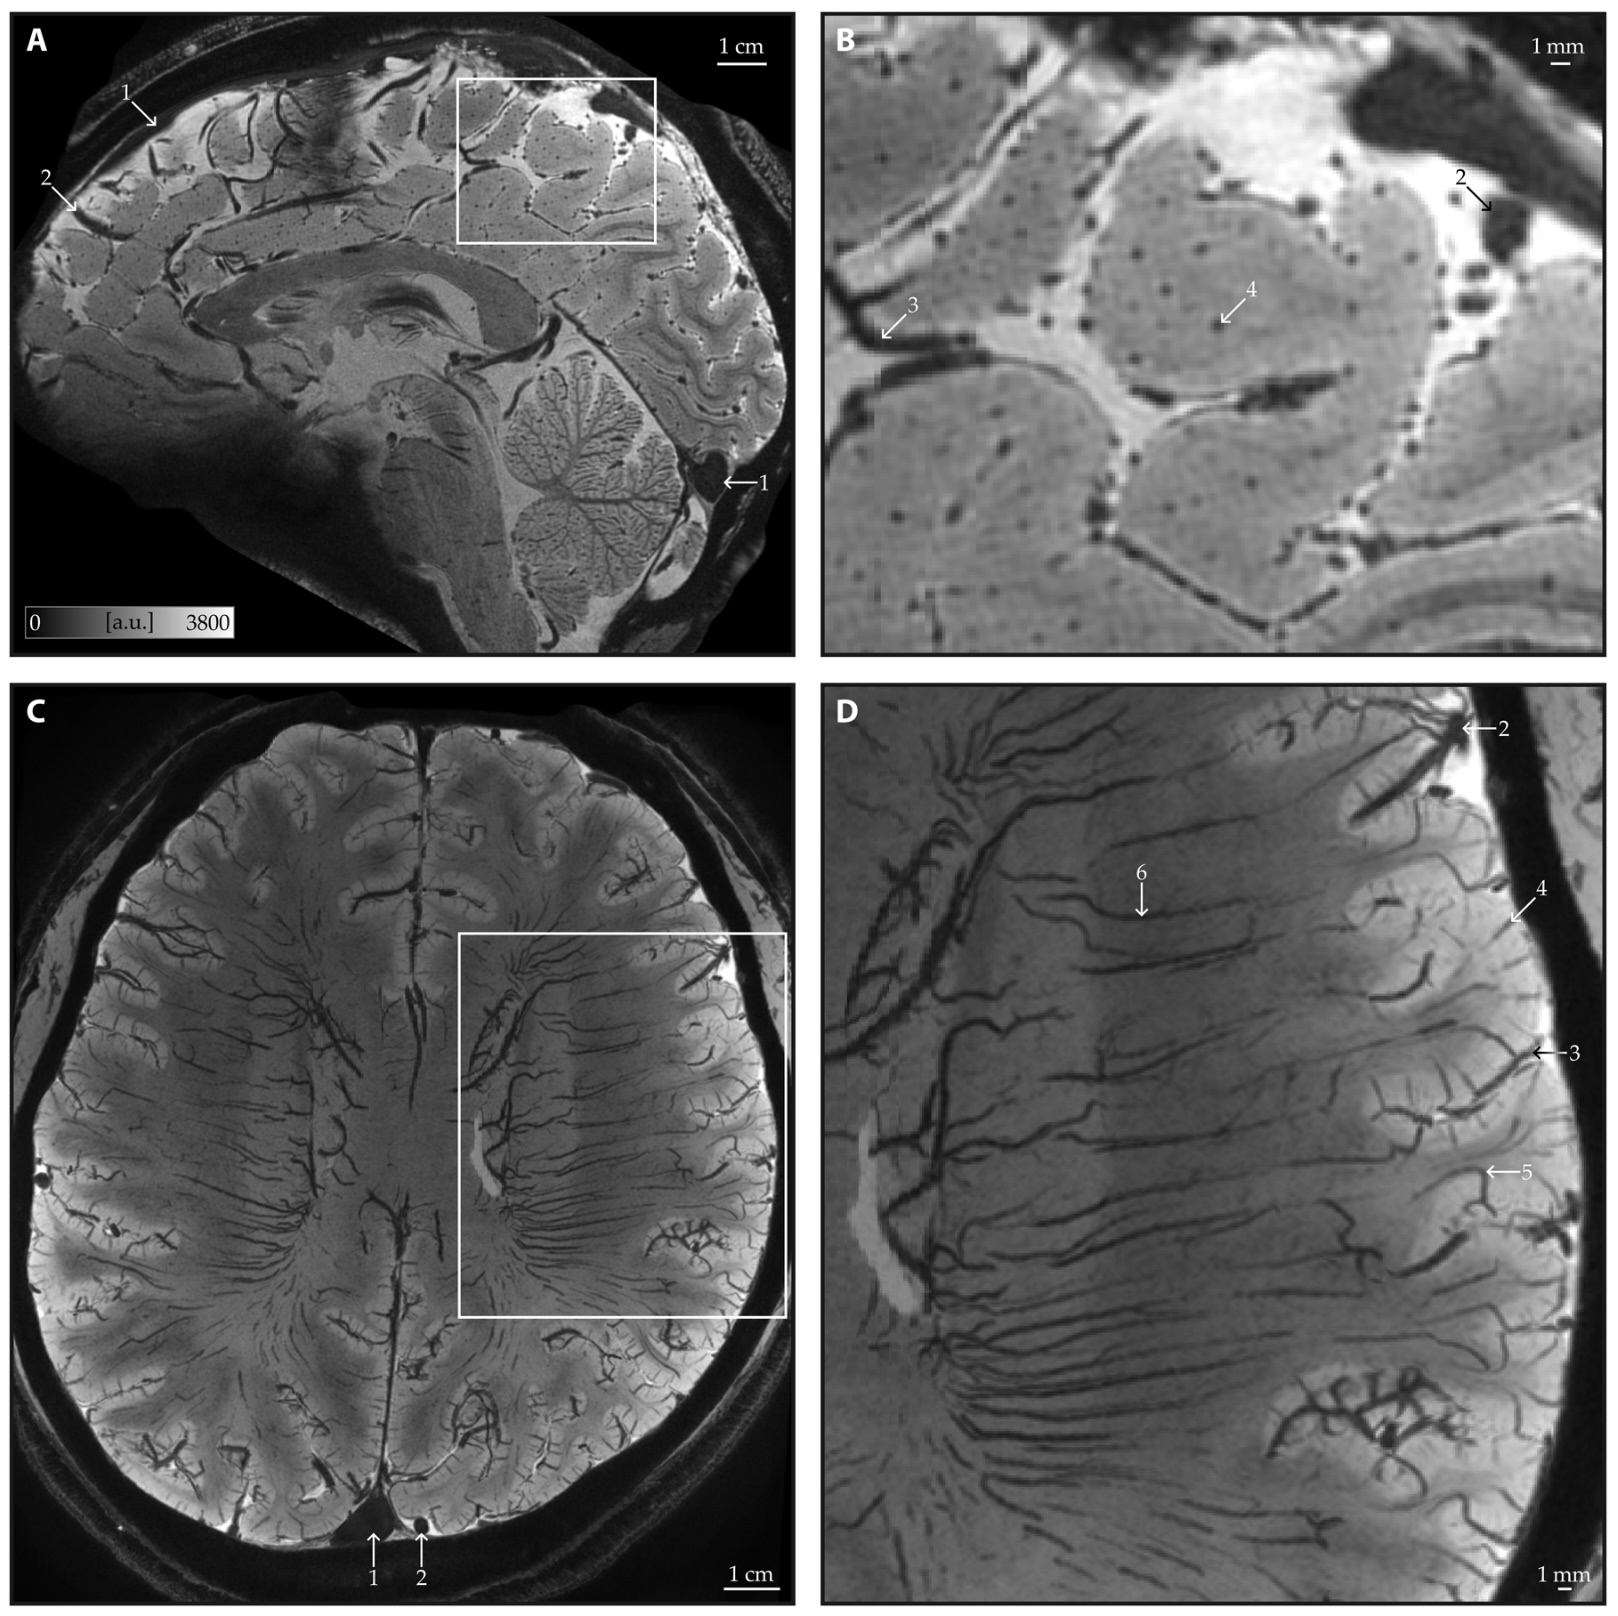
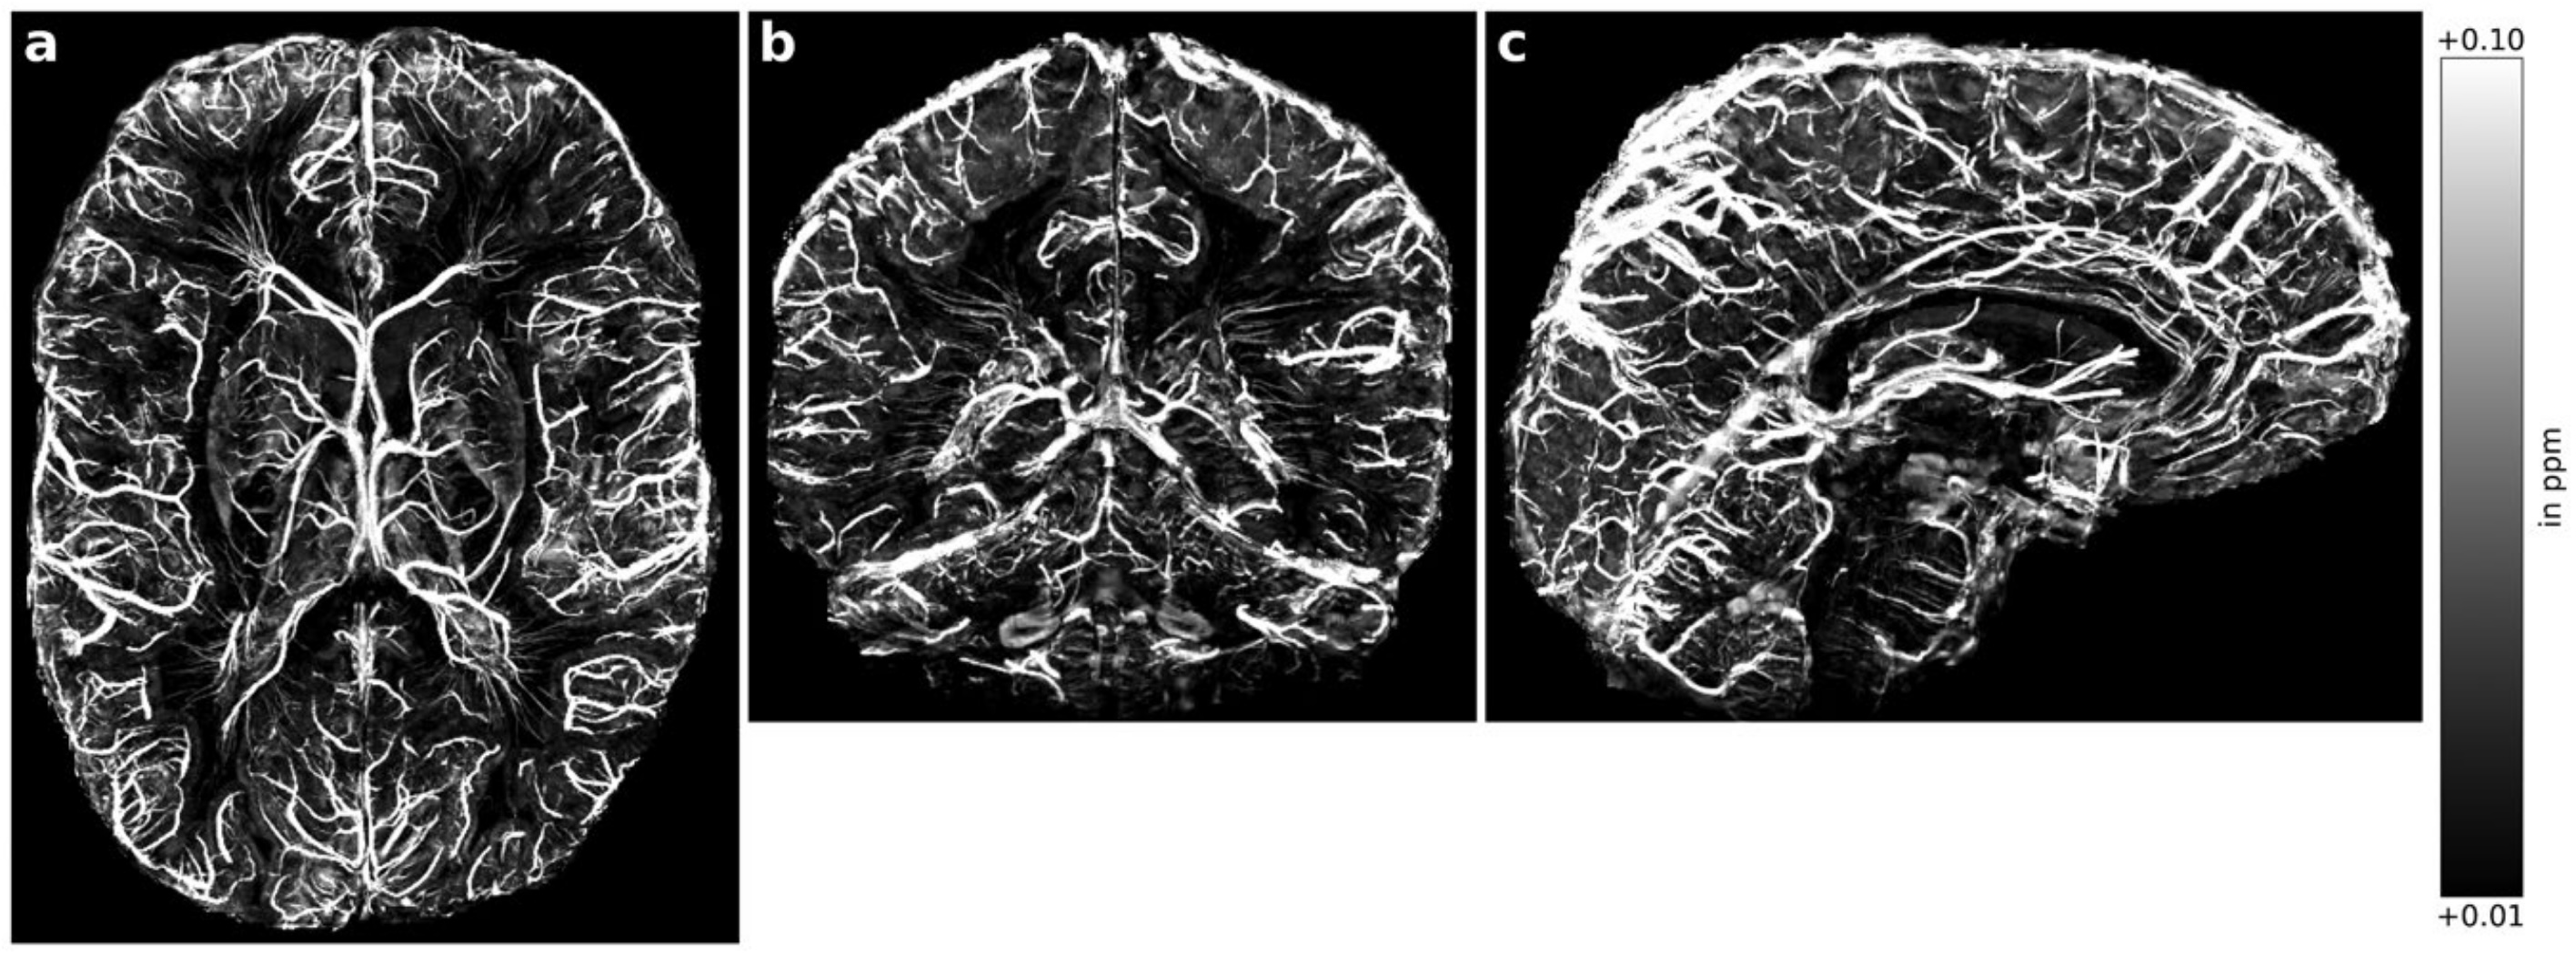
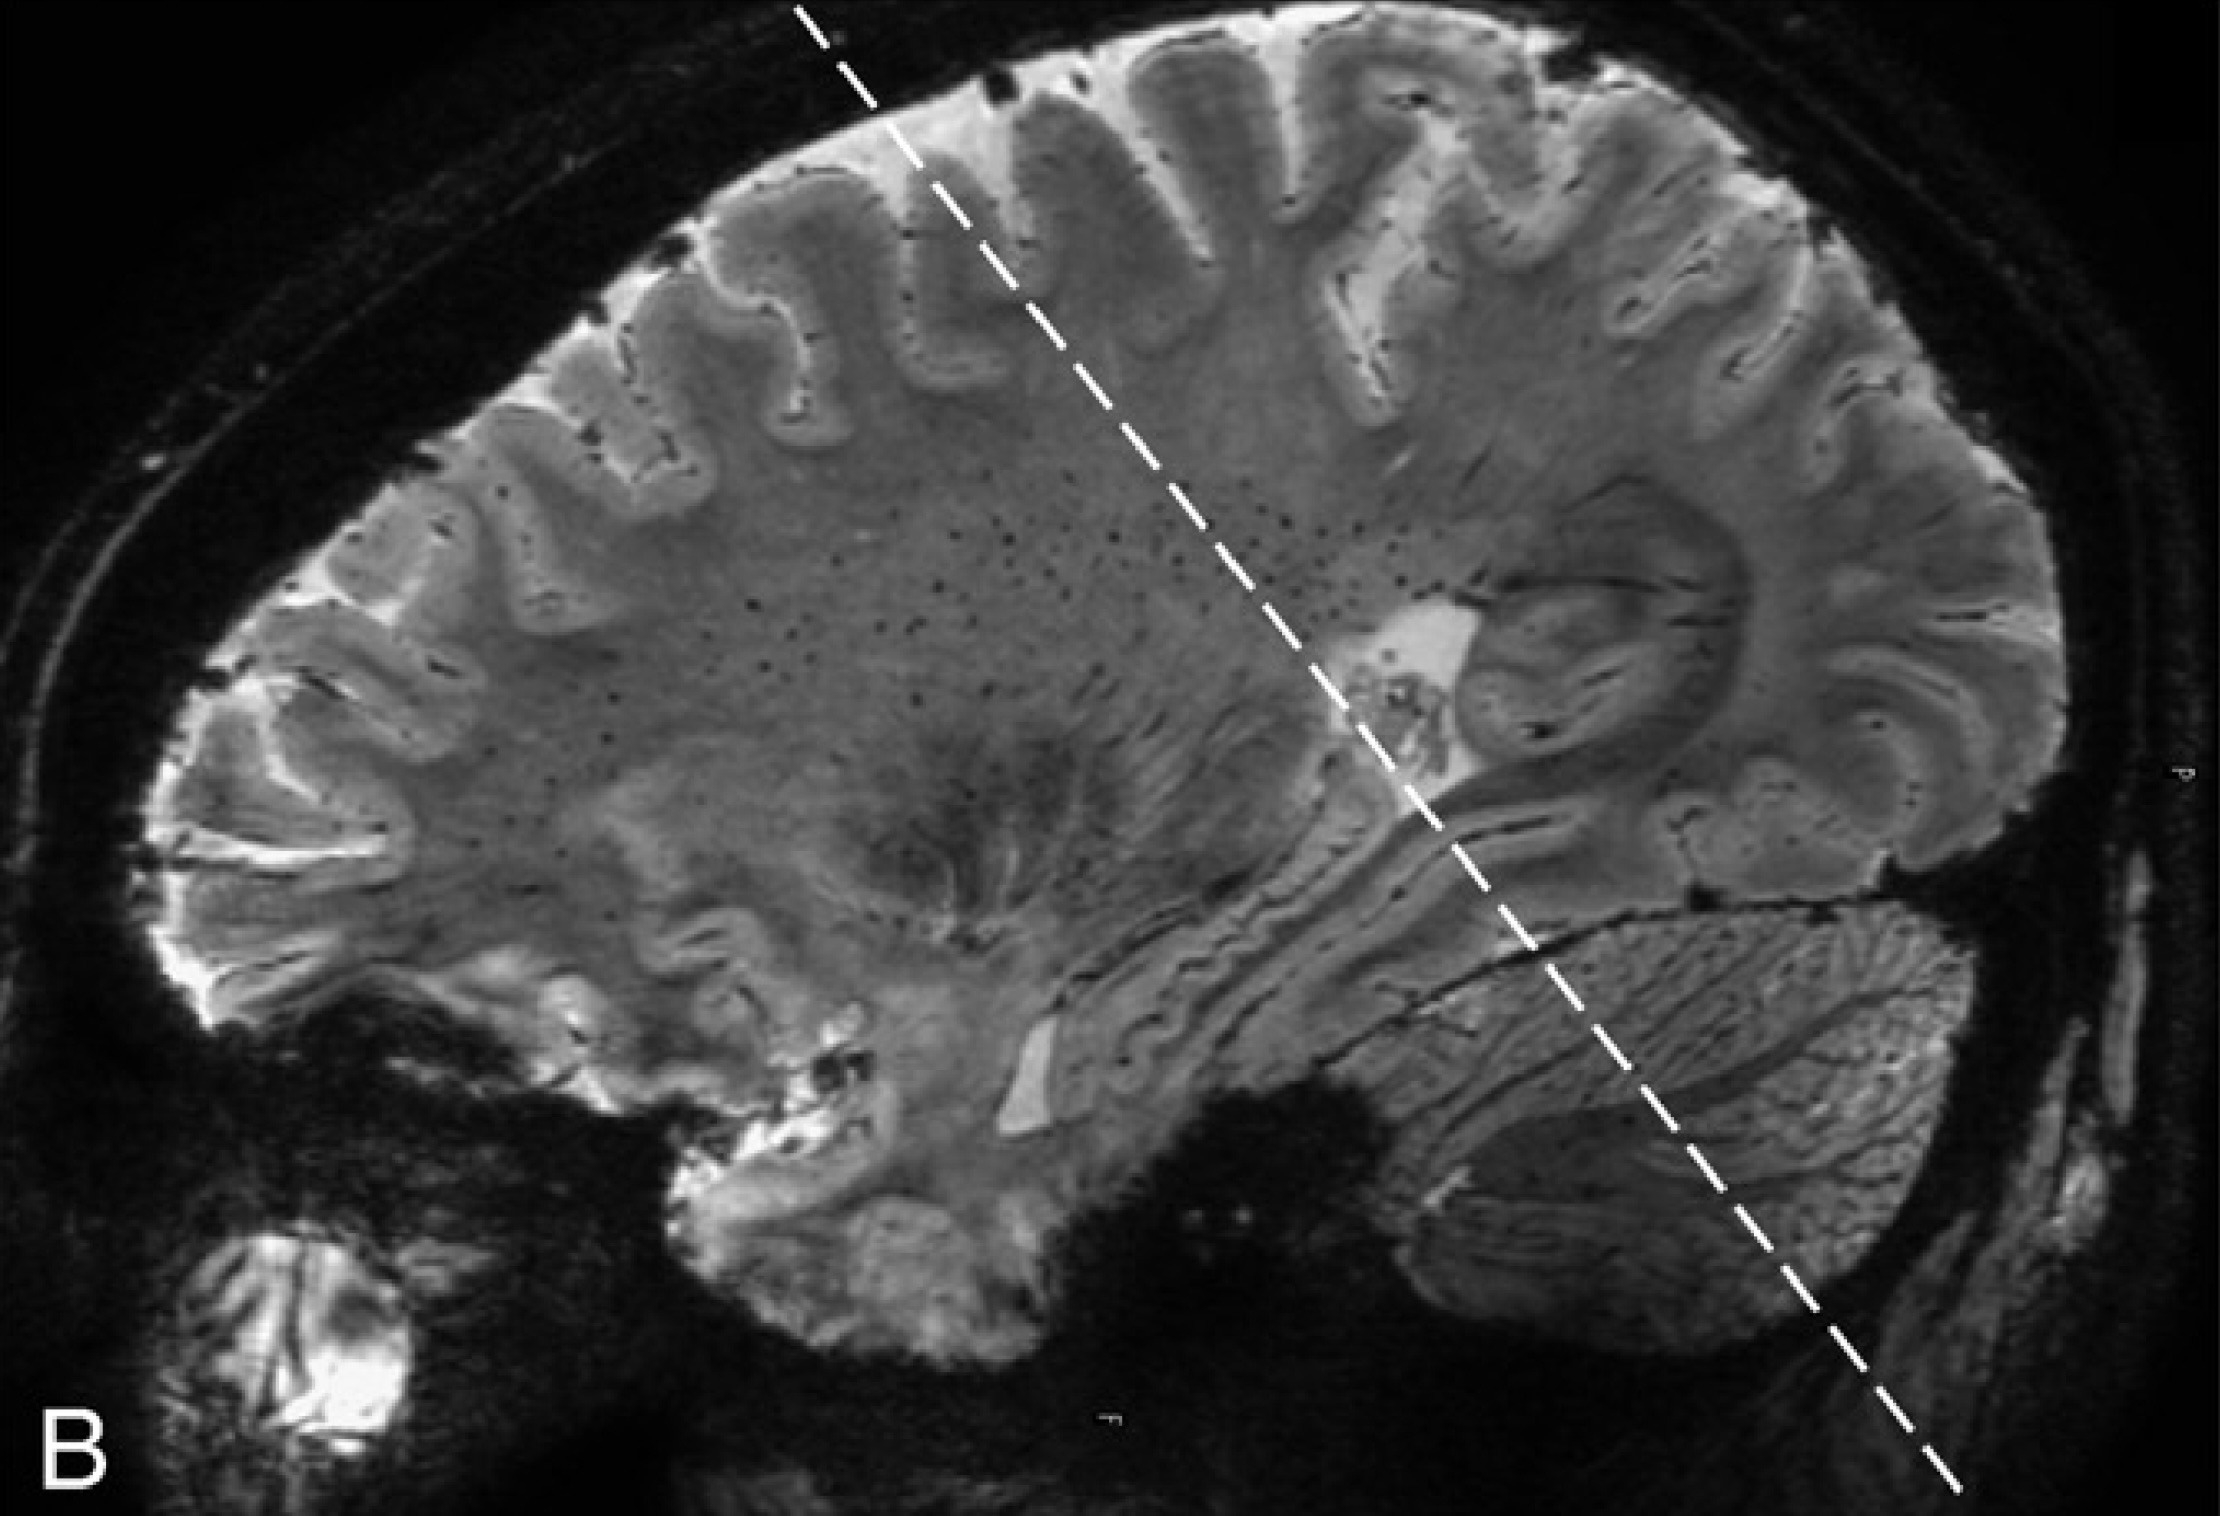
Gulban et al., 2026 // FIG 3 // Human brain meso-veins. In vivo MRI, 0.35 mm isotropic voxels.
doi.org/10.1126/sciadv.aea4540
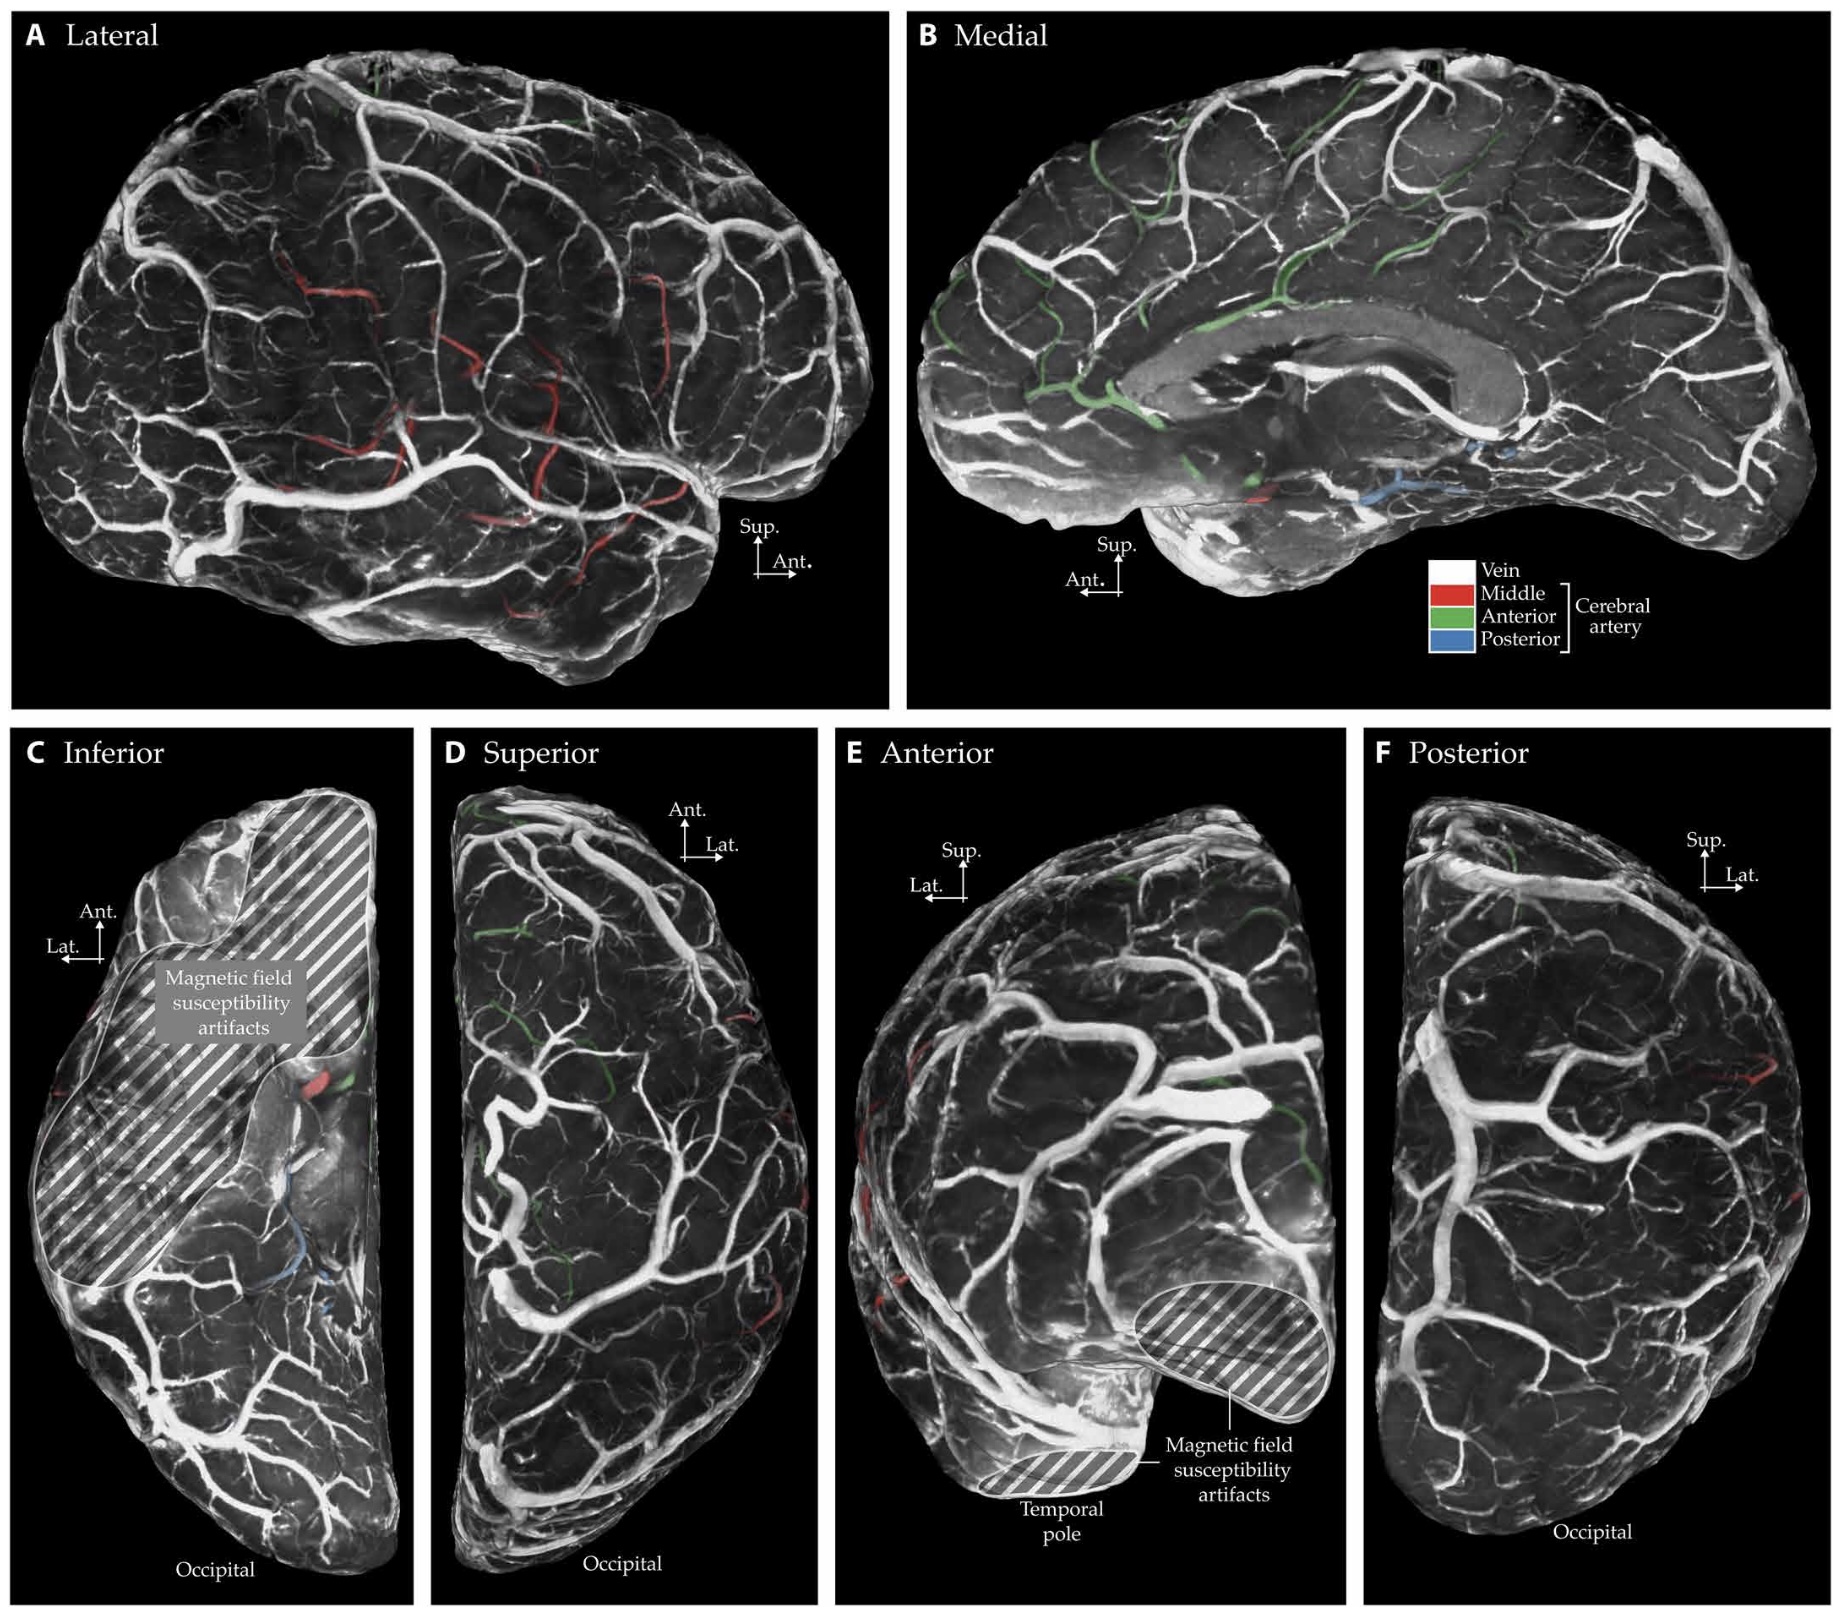
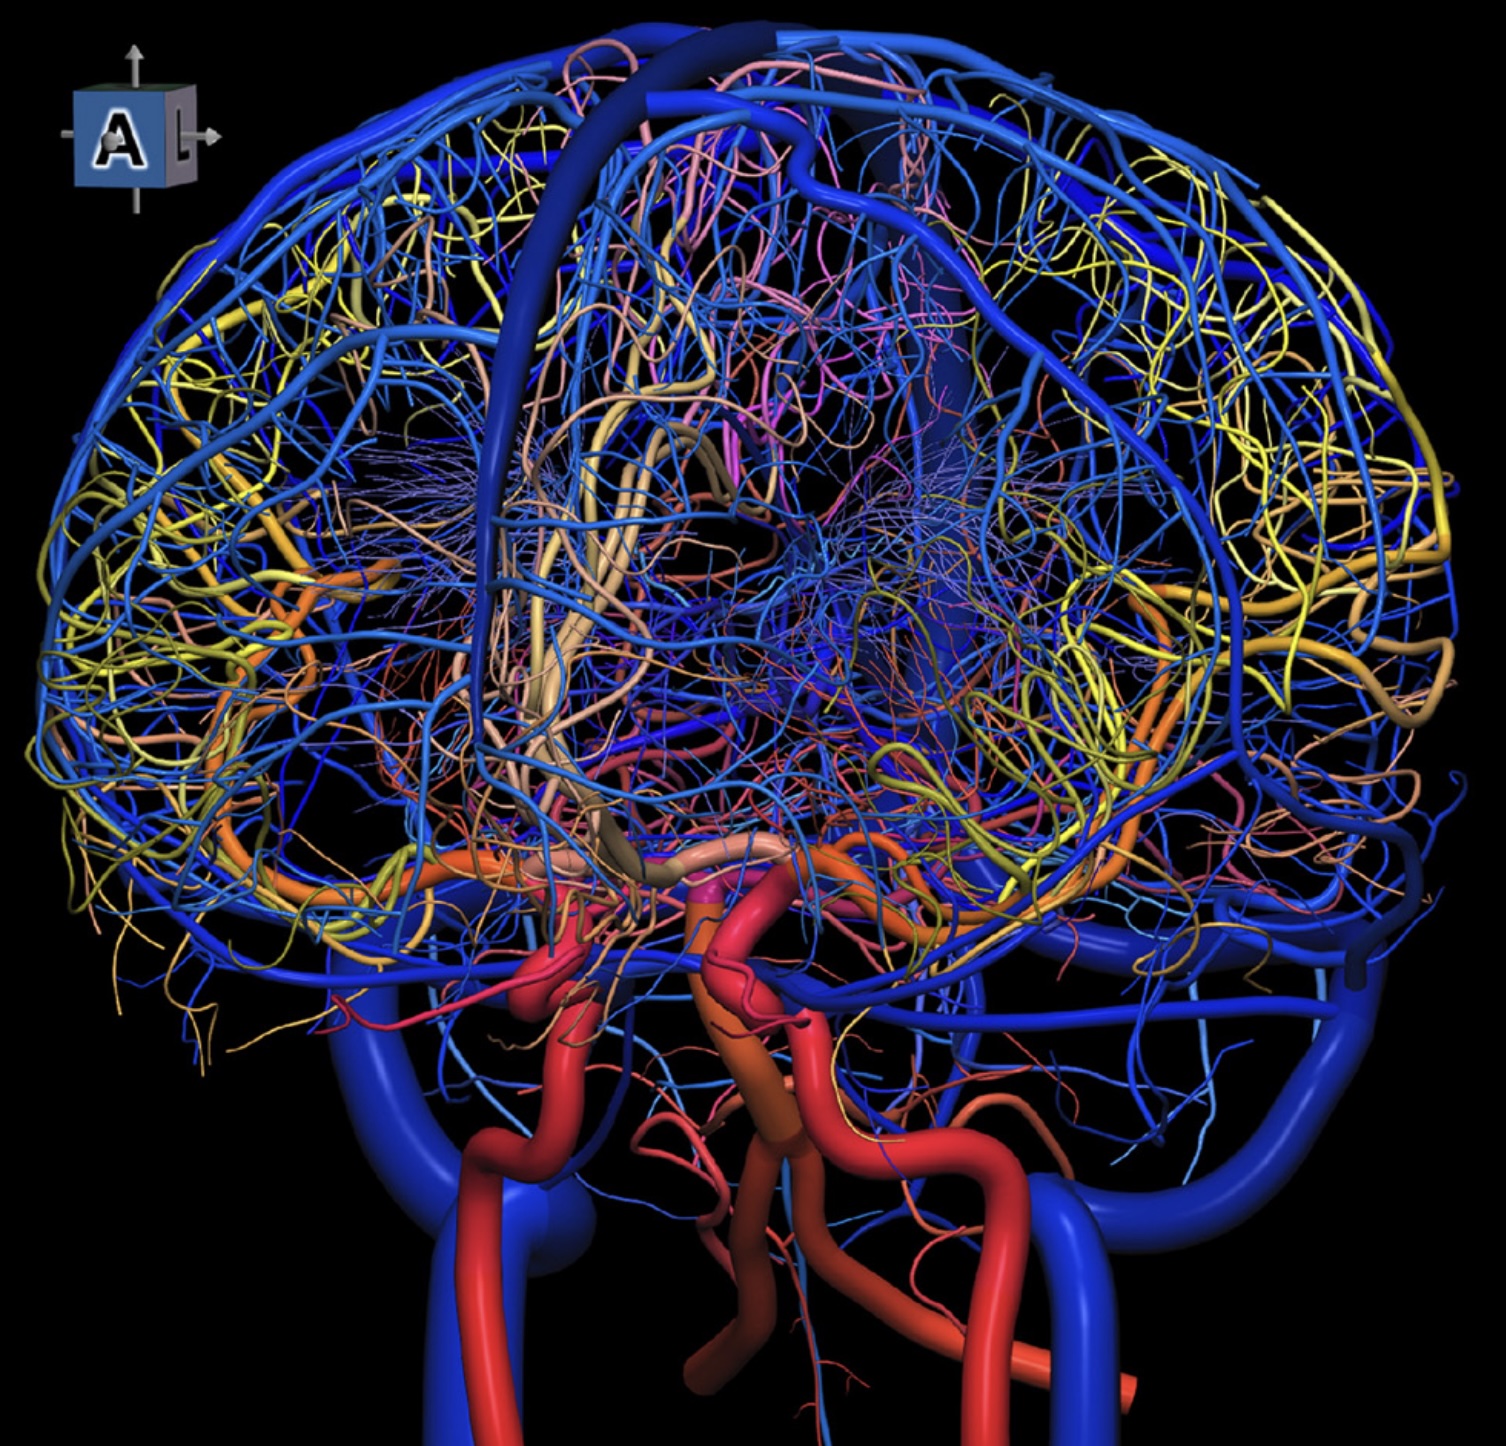
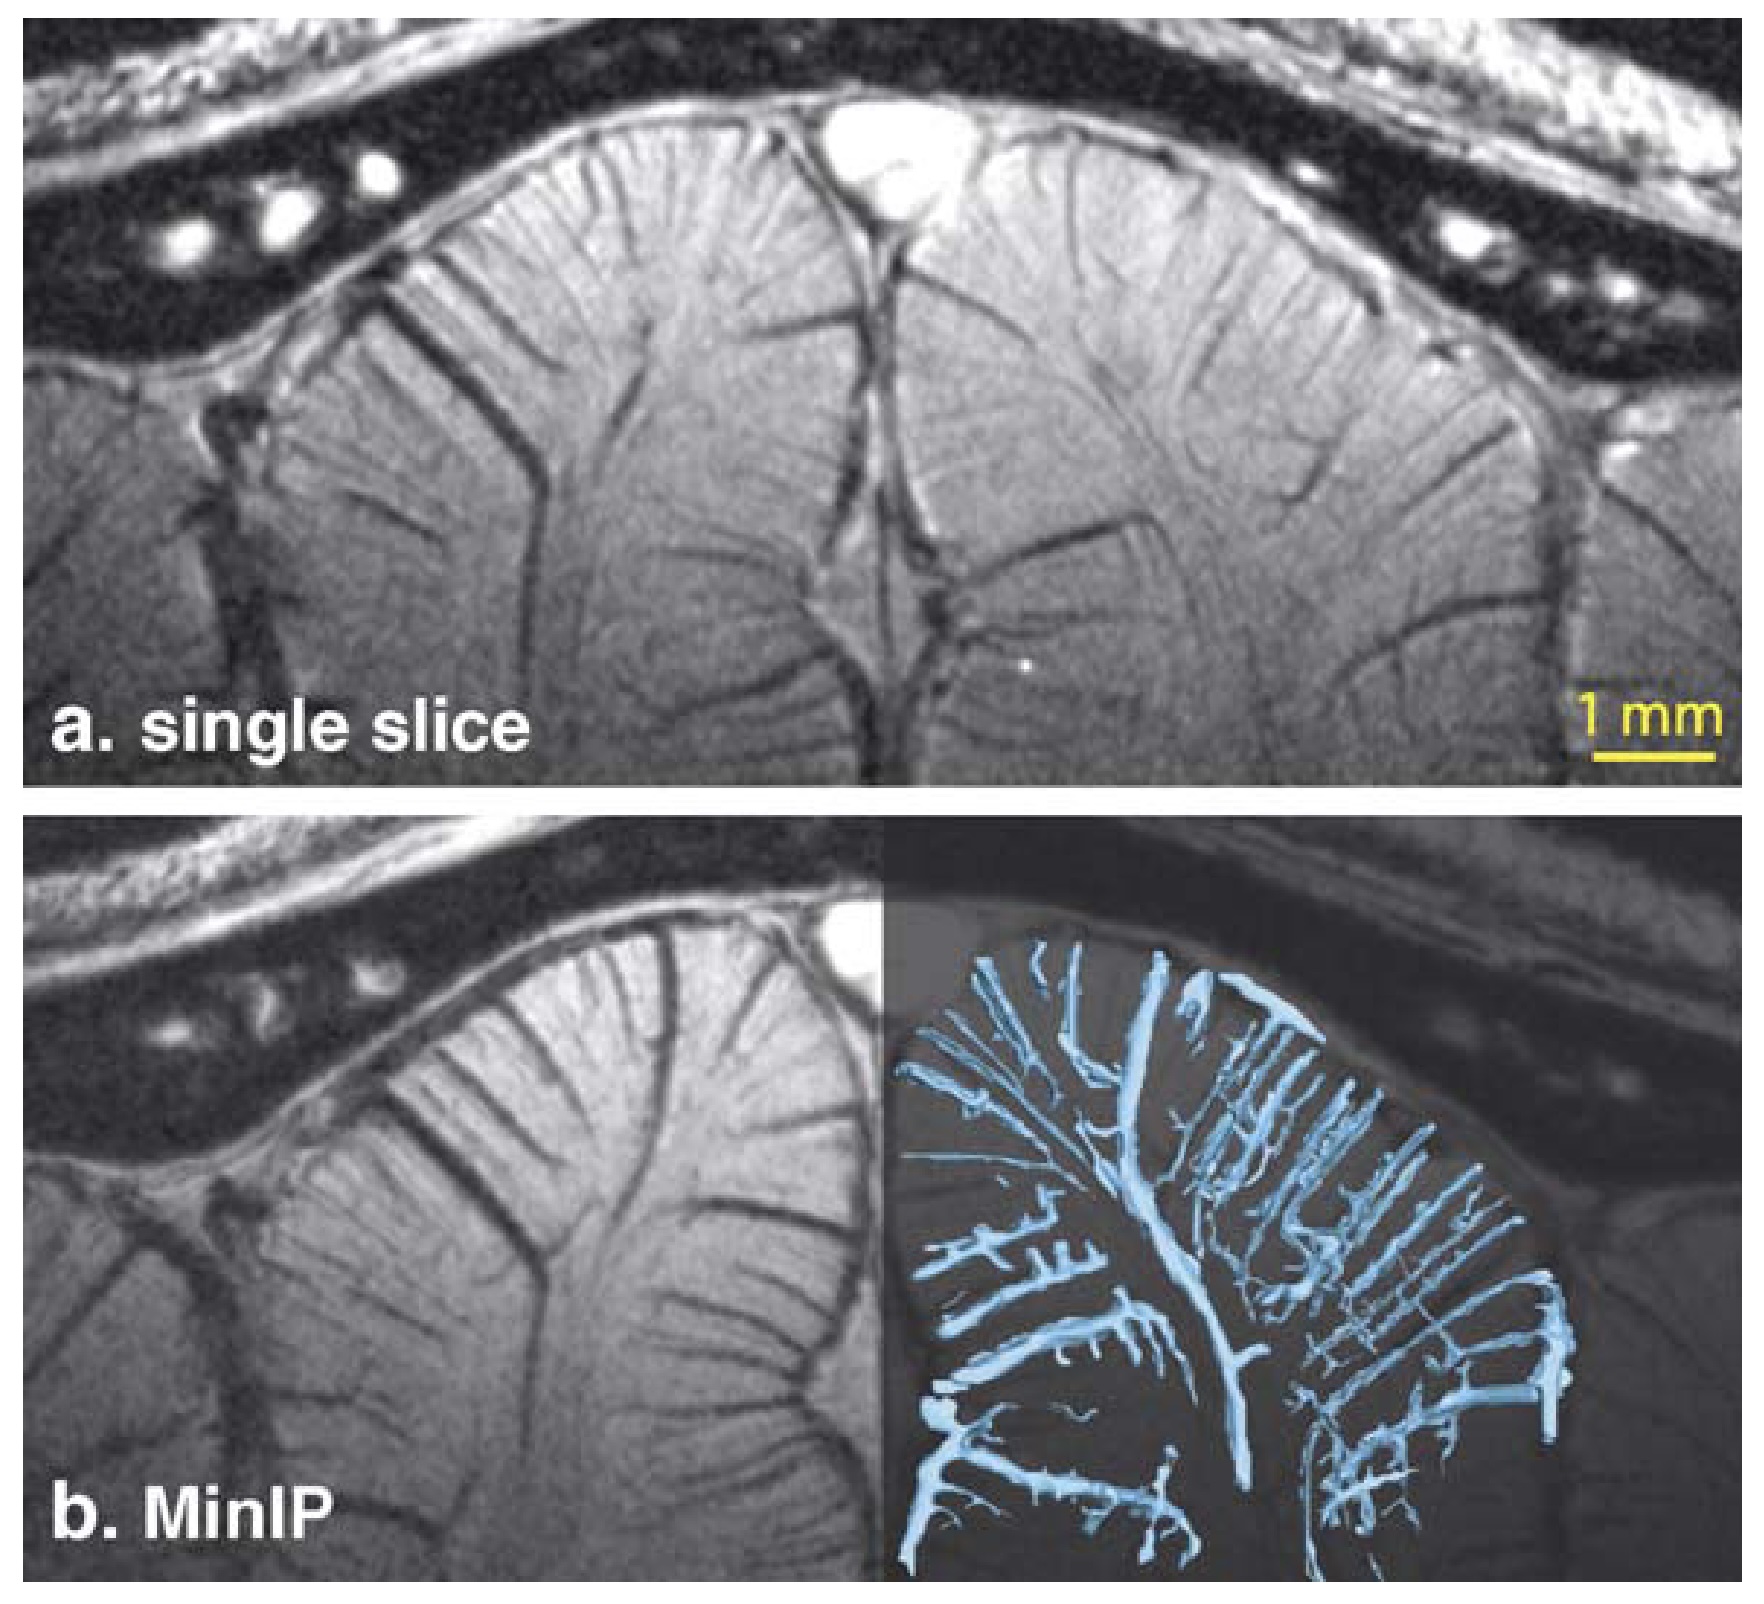
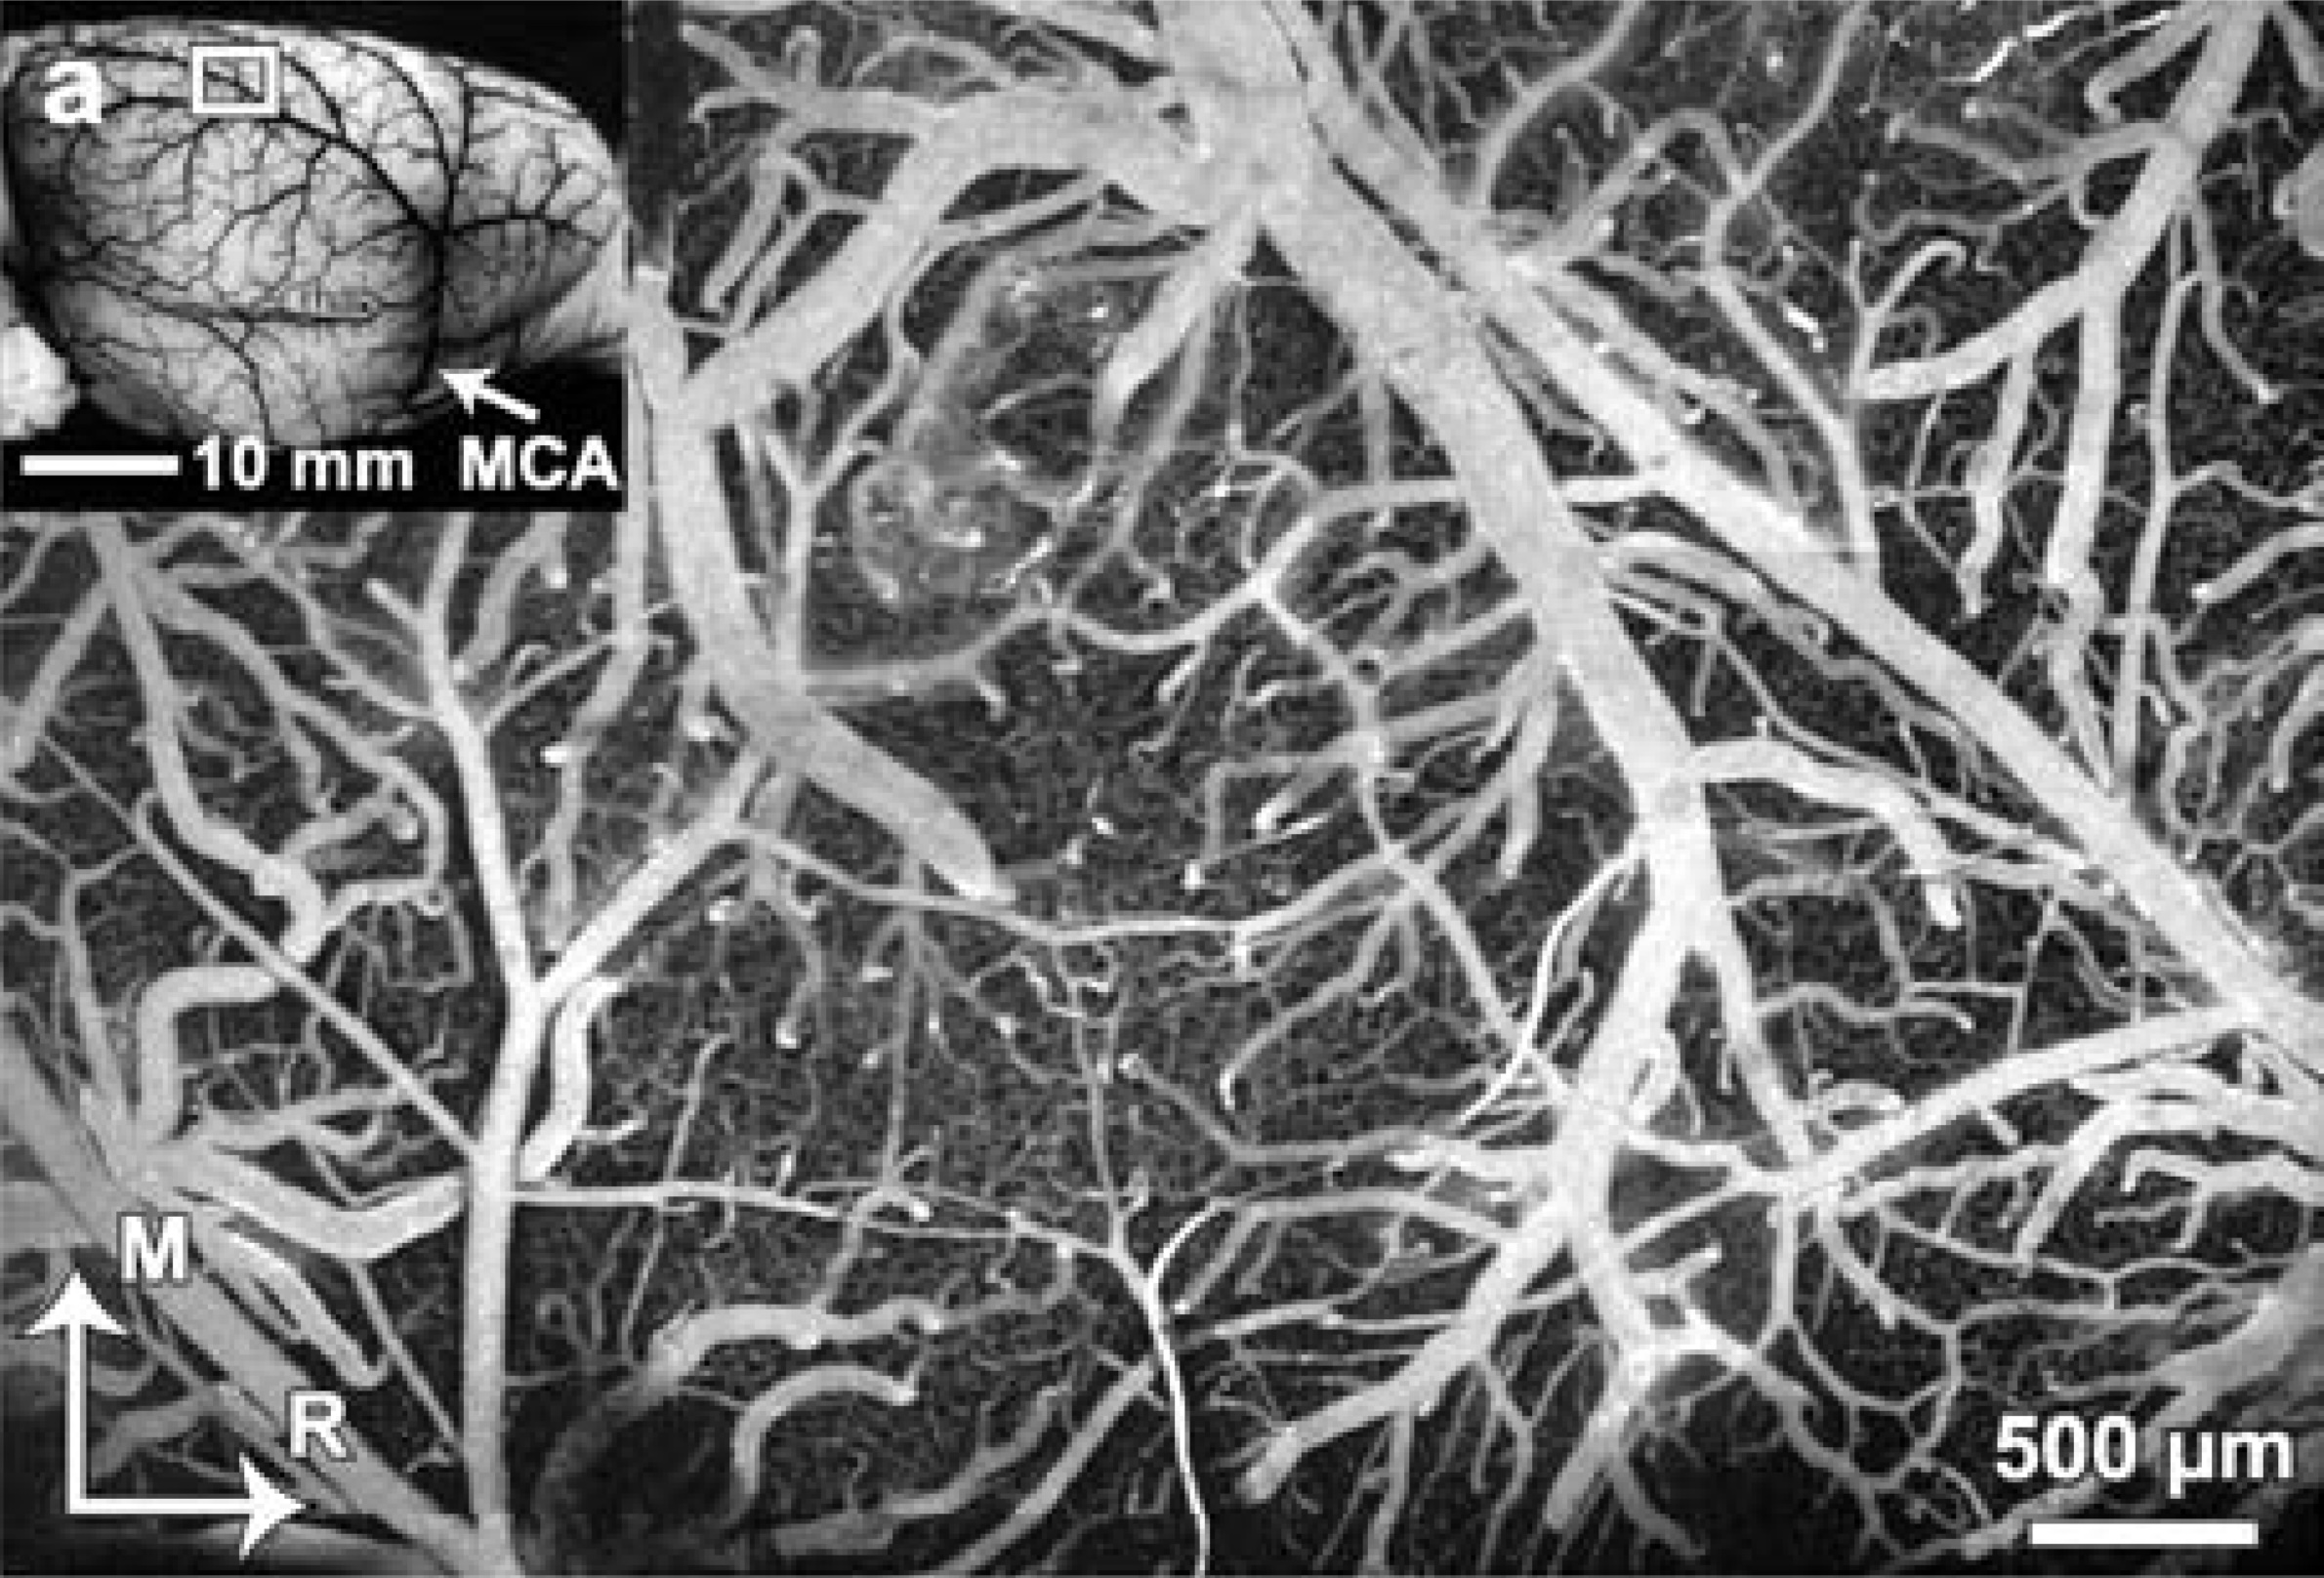
Gulban et al., 2026 // FIG 5 // Human leptomeningeal vessels. In vivo MRI, 0.35 mm isotropic voxels.
doi.org/10.1126/sciadv.aea4540
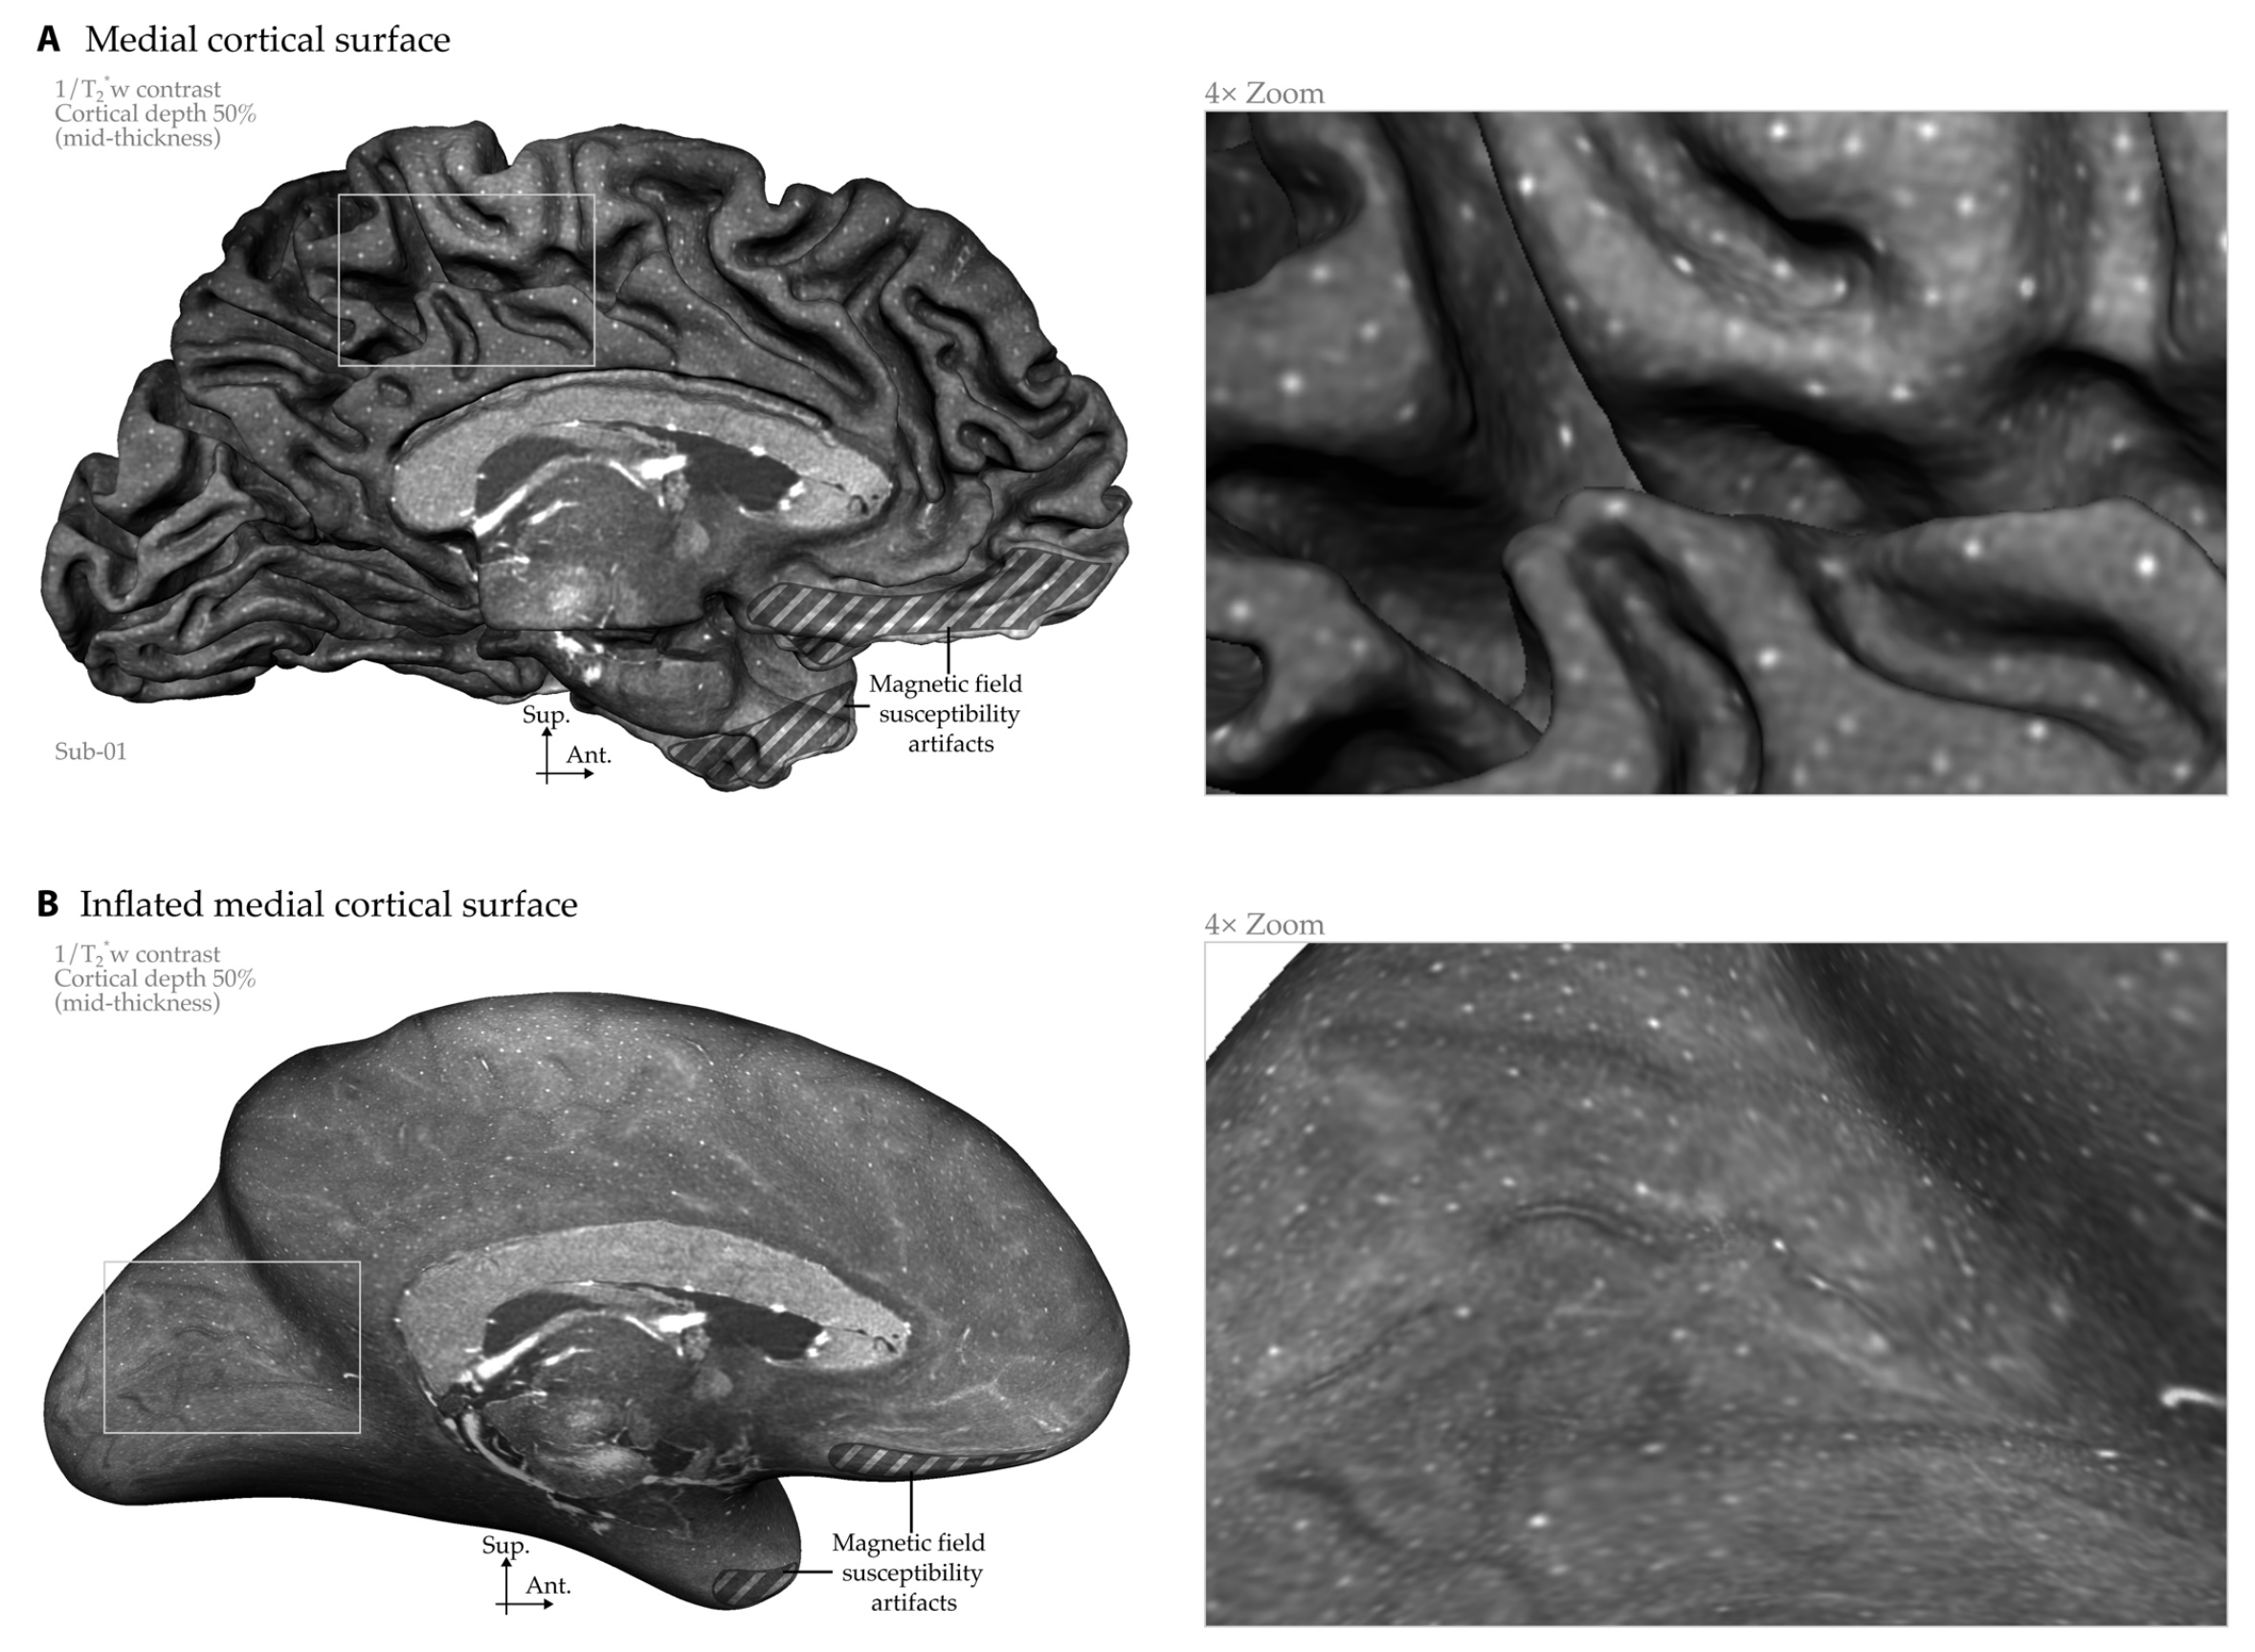
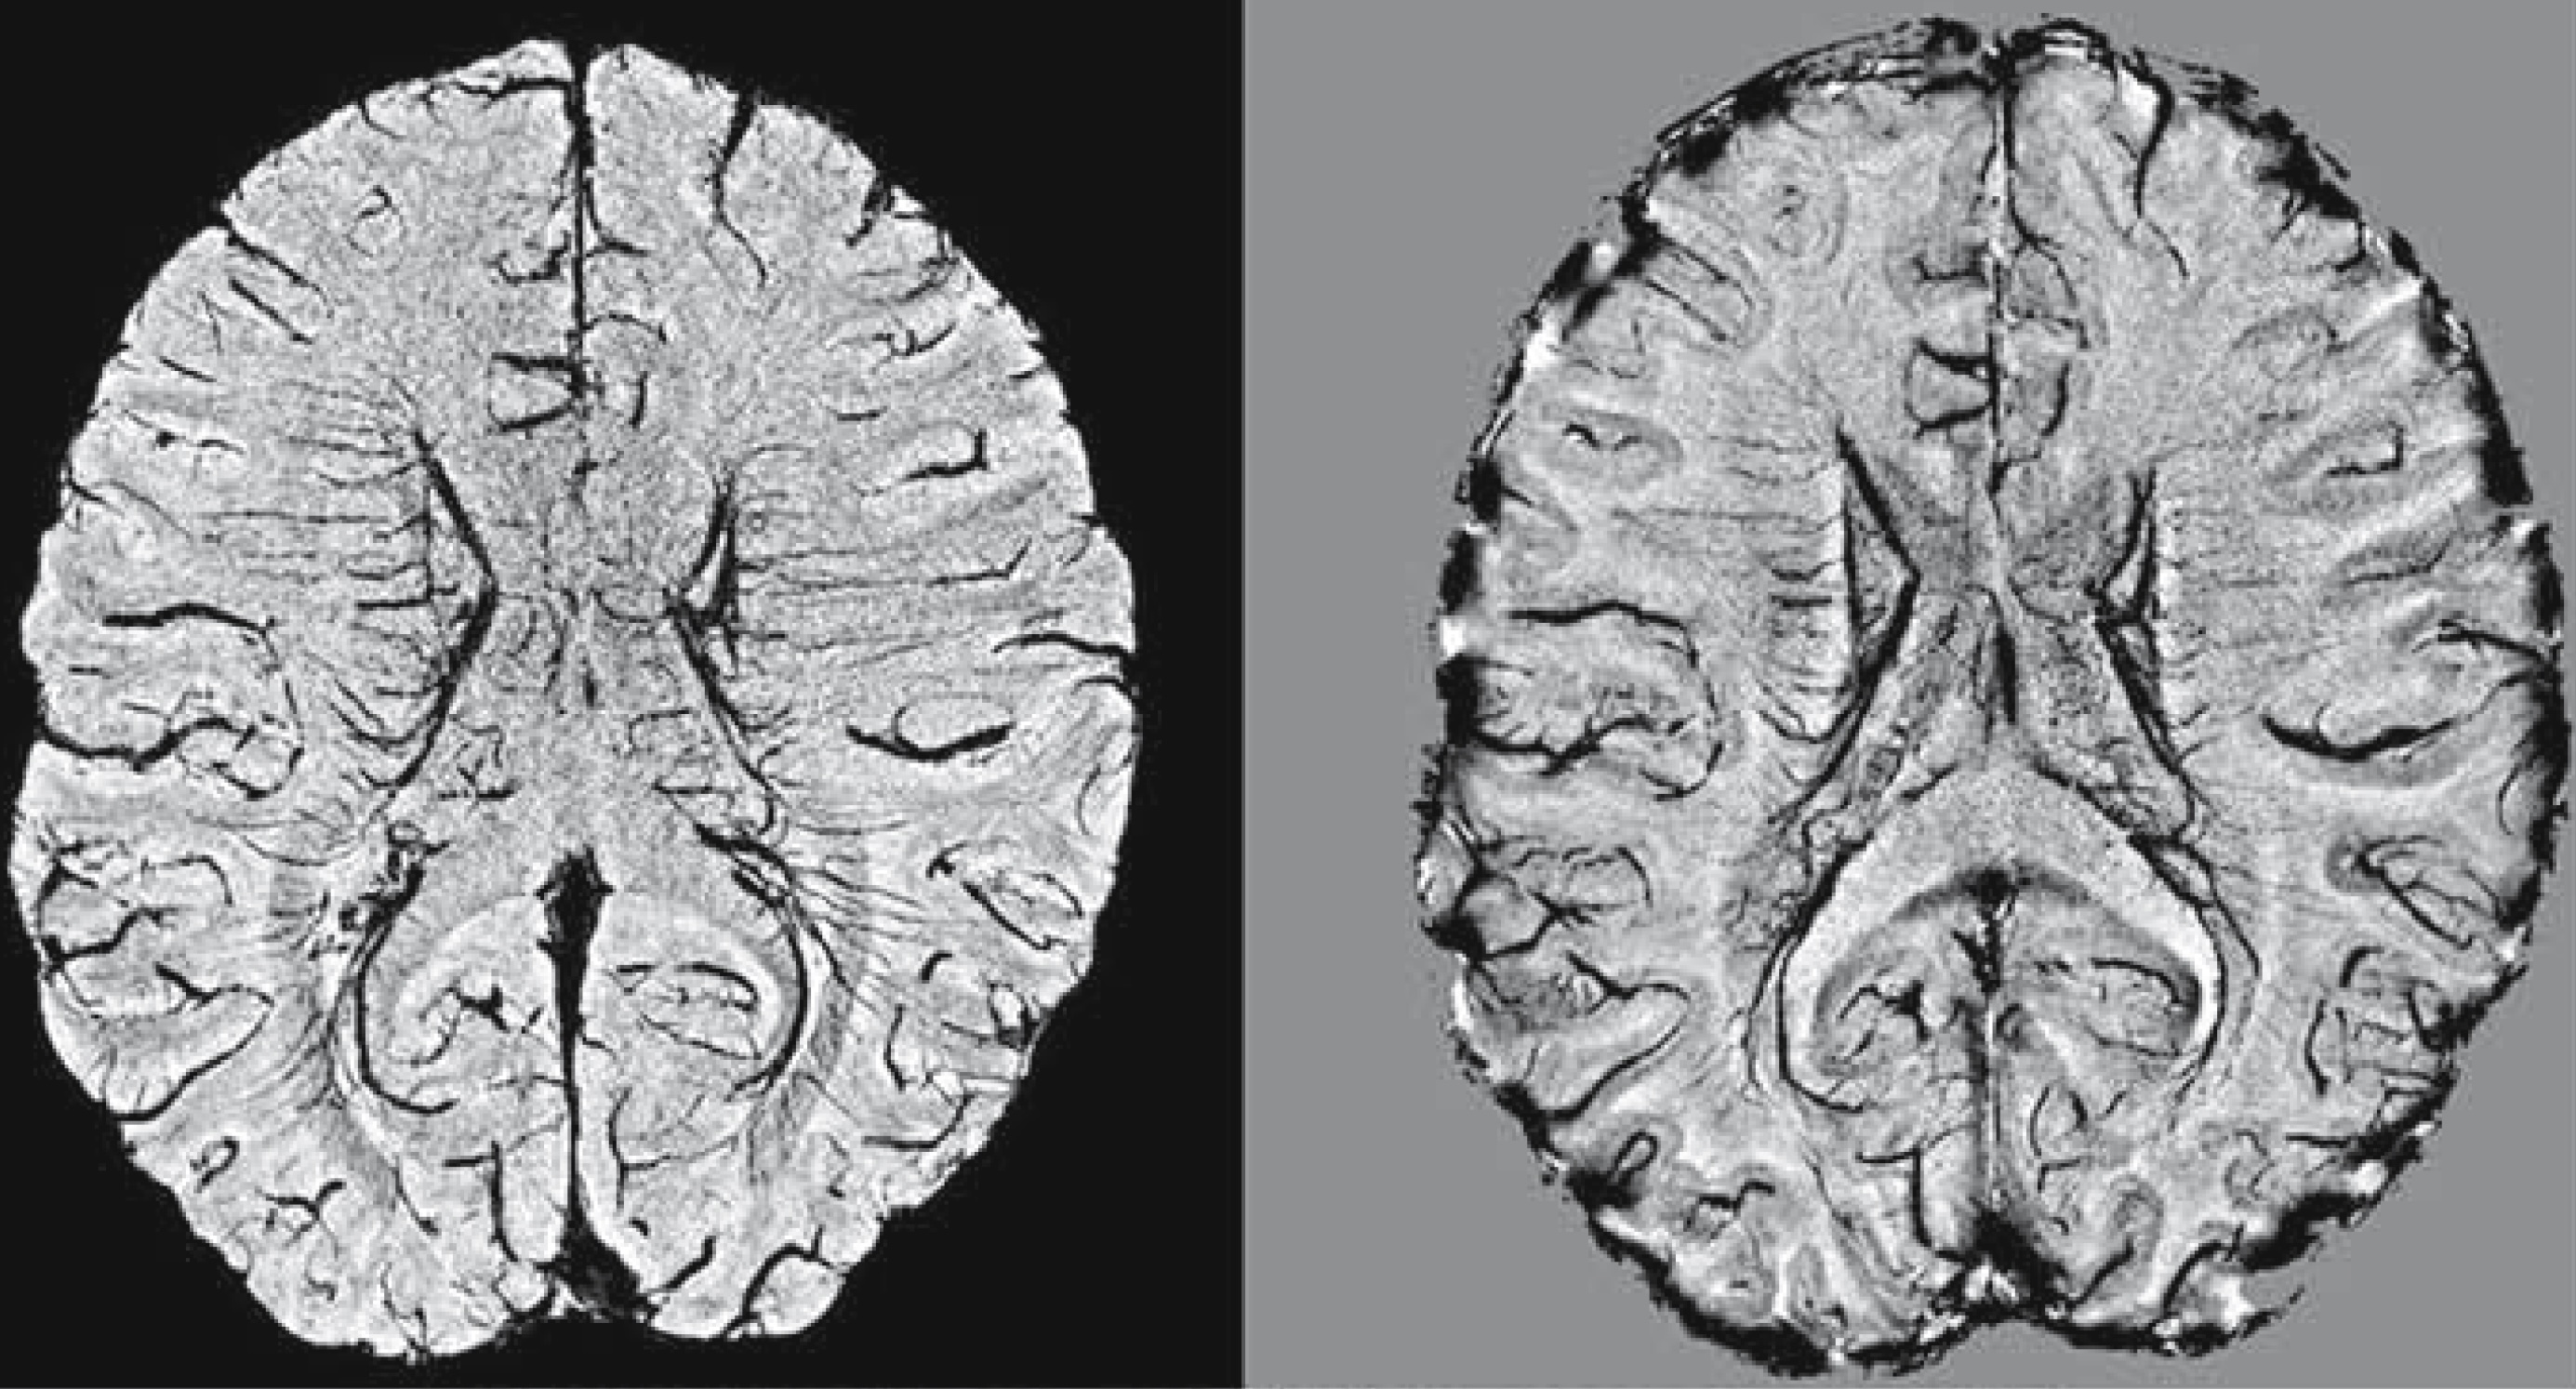
Gulban et al., 2026 // FIG 8 // Human intracortical meso-veins (white dots) across the entire cortex. In vivo MRI, 0.35 mm isotropic voxels.
doi.org/10.1126/sciadv.aea4540
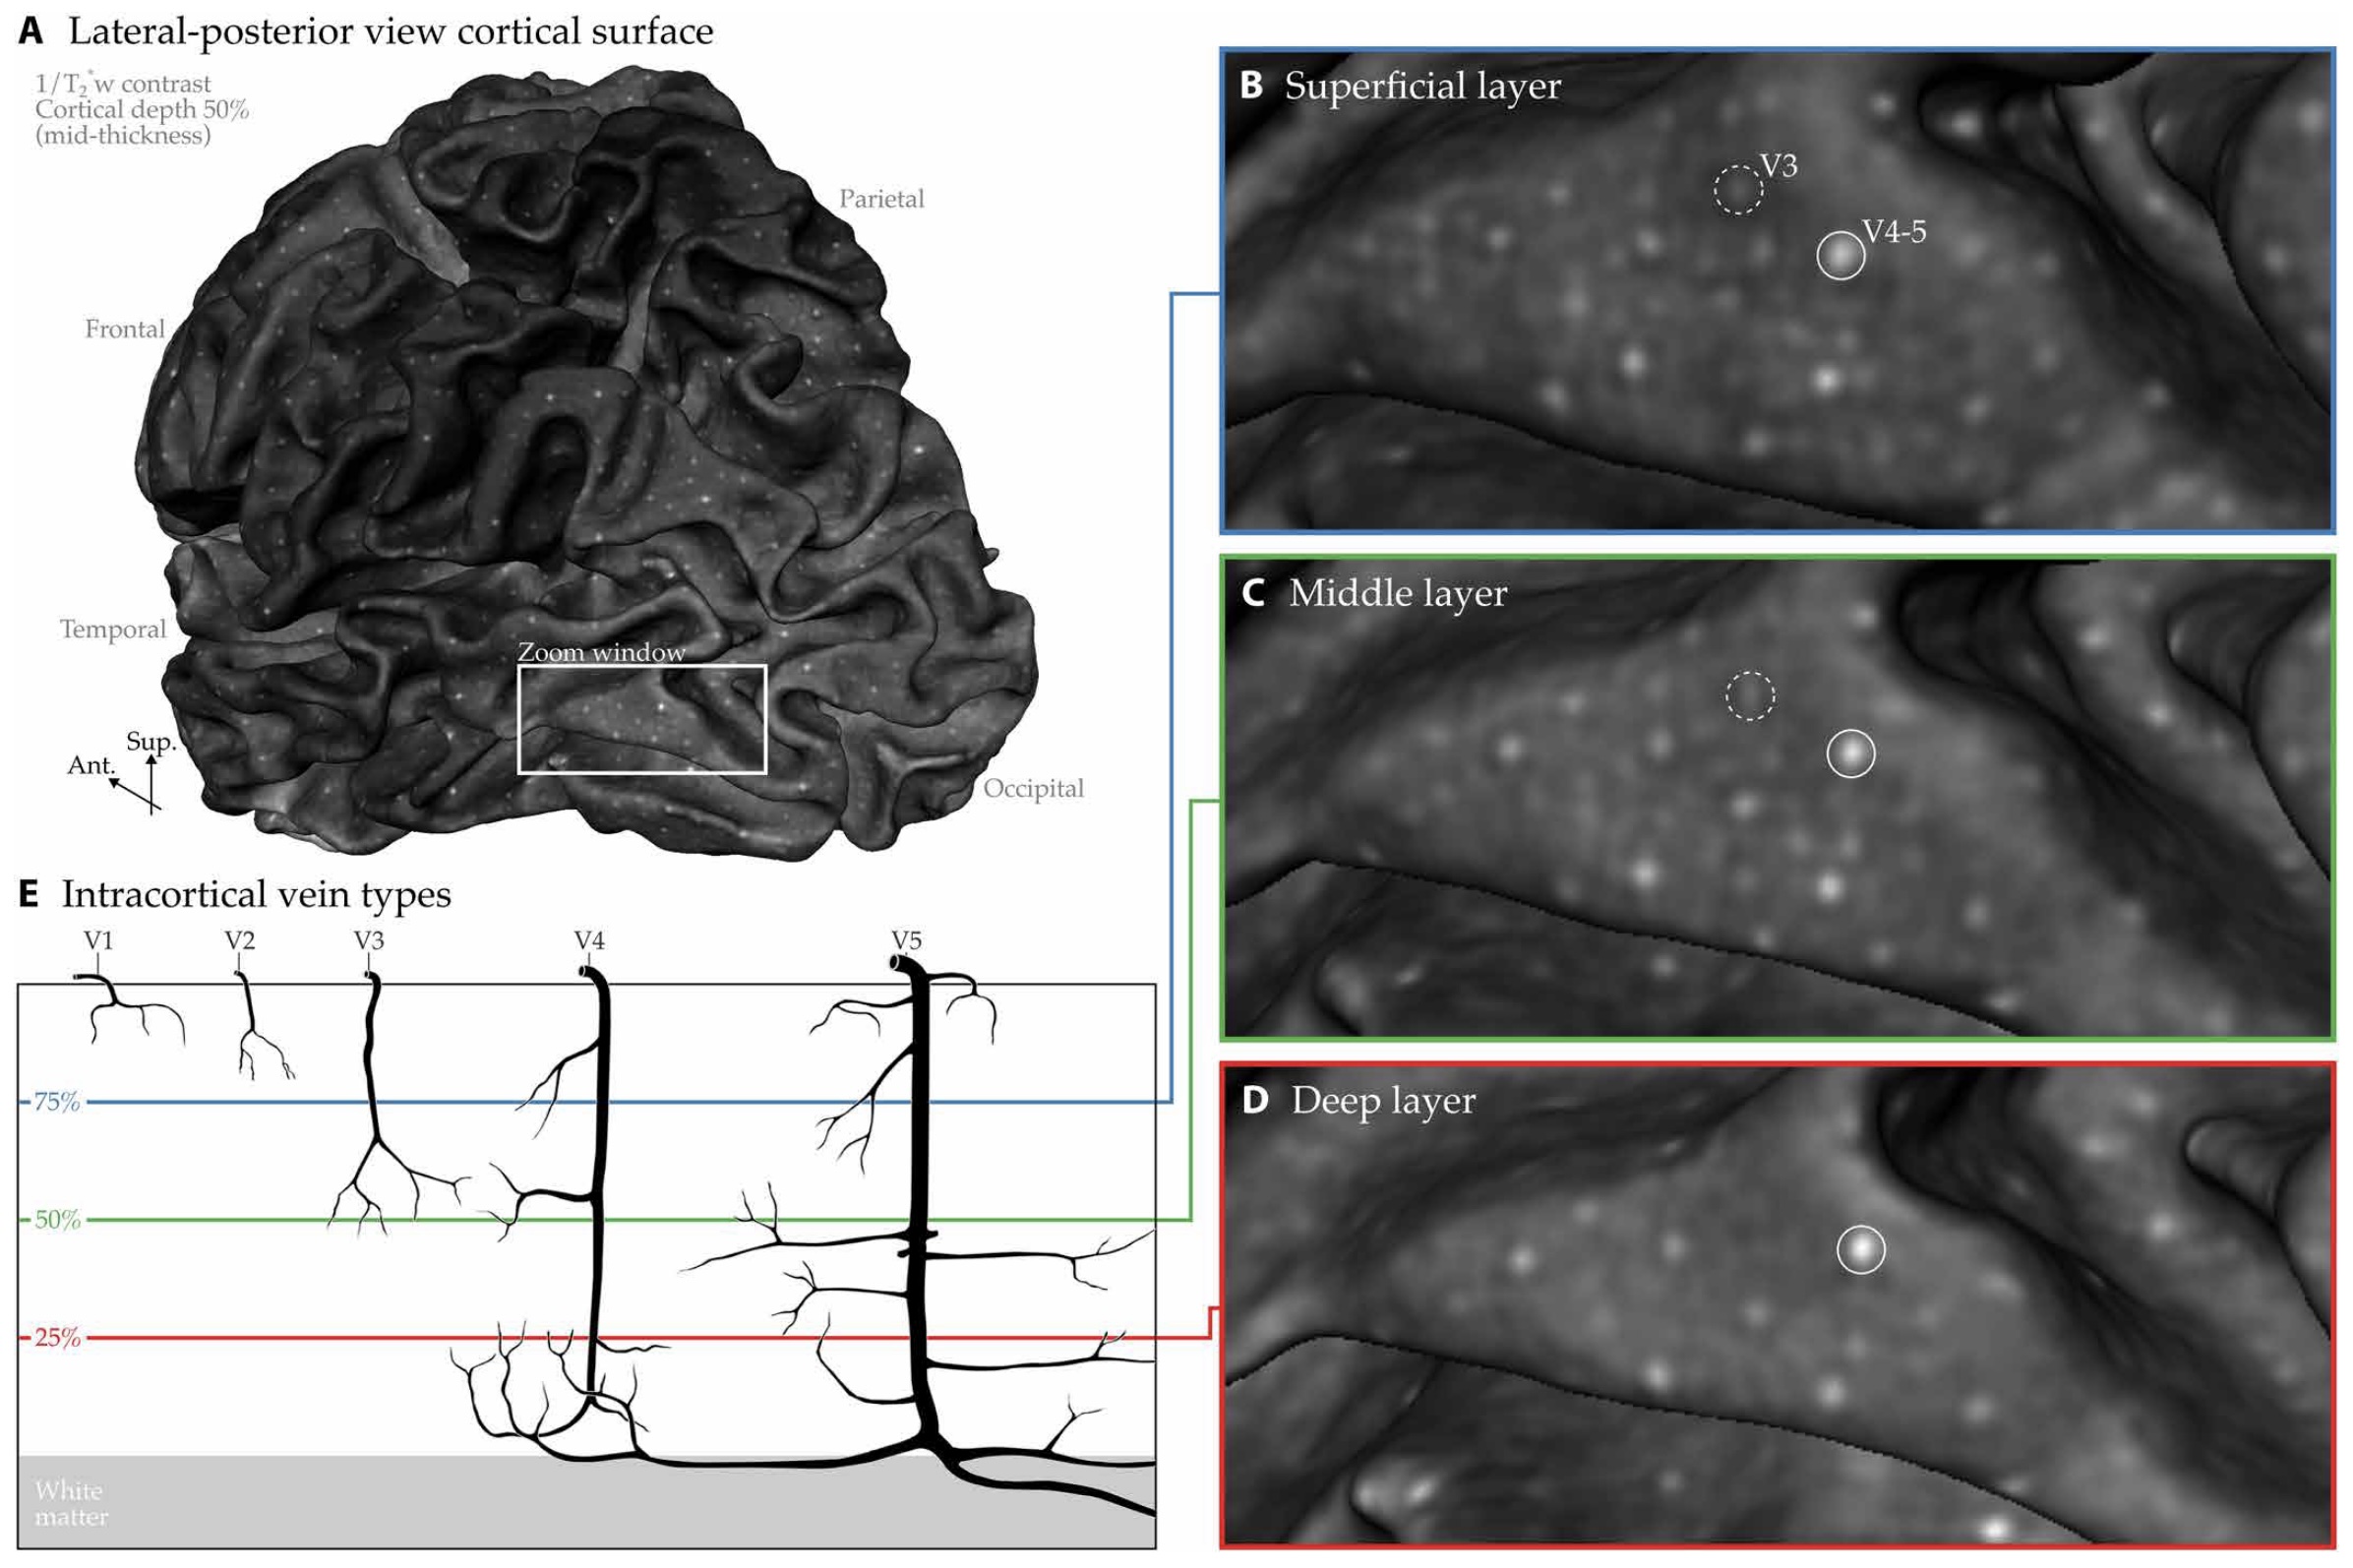
Gulban et al., 2026 // FIG 9 // Human intracortical meso-veins (white dots) across cortical layers. In vivo MRI, 0.35 mm isotropic voxels.
doi.org/10.1126/sciadv.aea4540
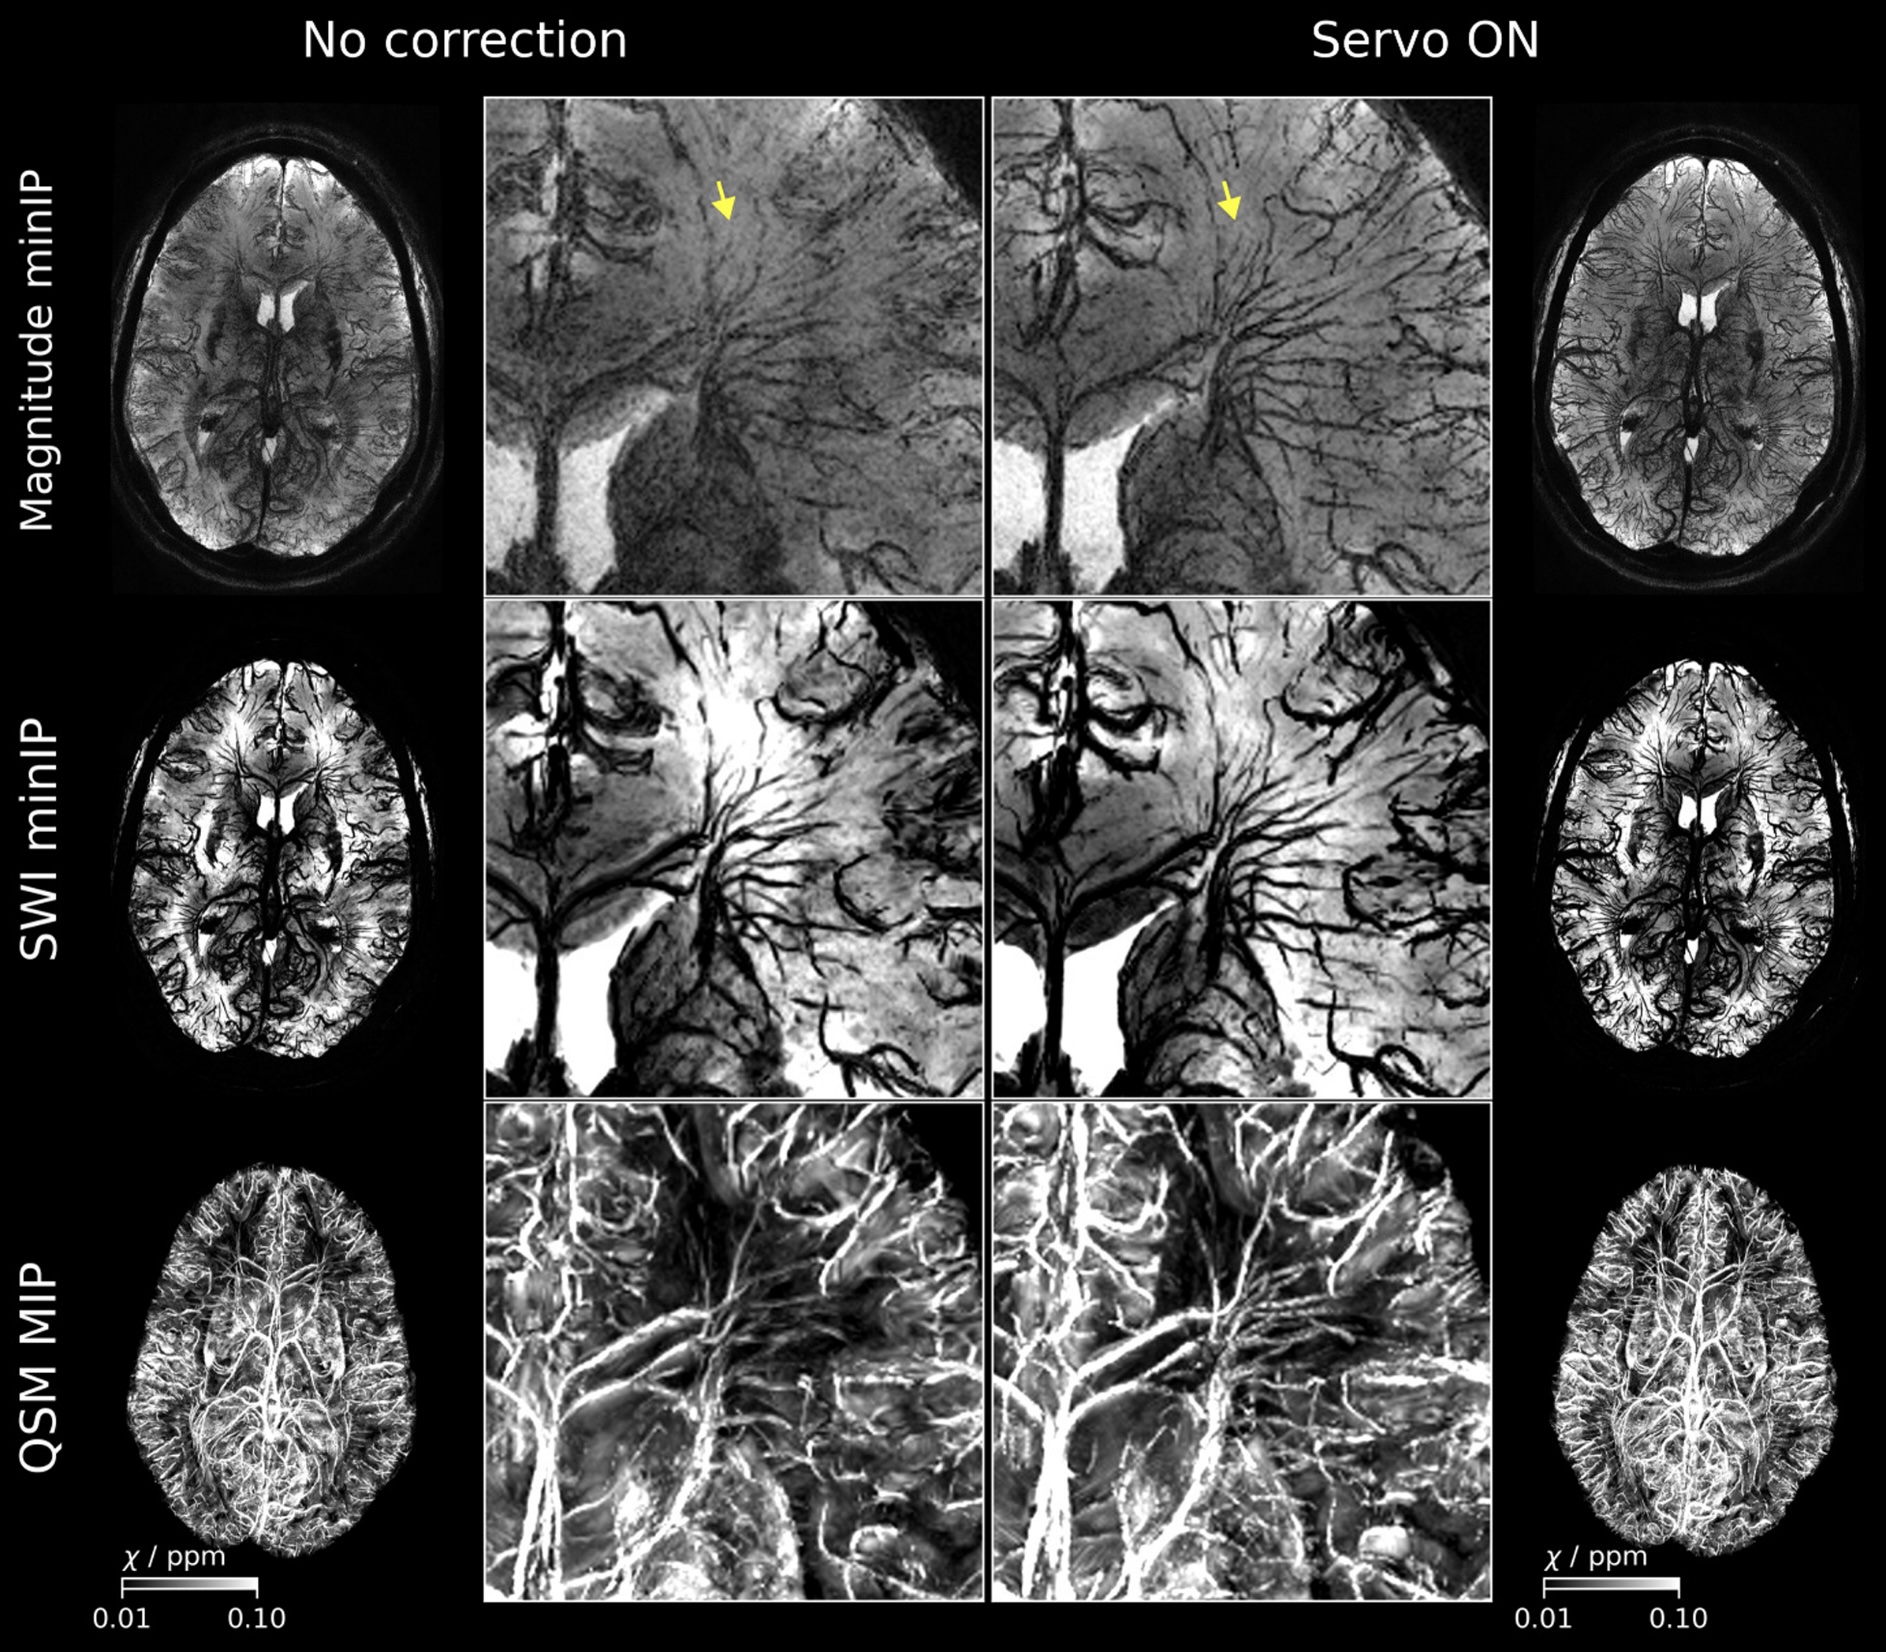
Serger et al., 2026 // FIG 5 // Servo navigator (a prospective motion correction technique) helps to get sharper meso-vein images in moving participants. In vivo MRI, 0.3 mm isotropic voxels.
doi.org/10.1002/mrm.70251
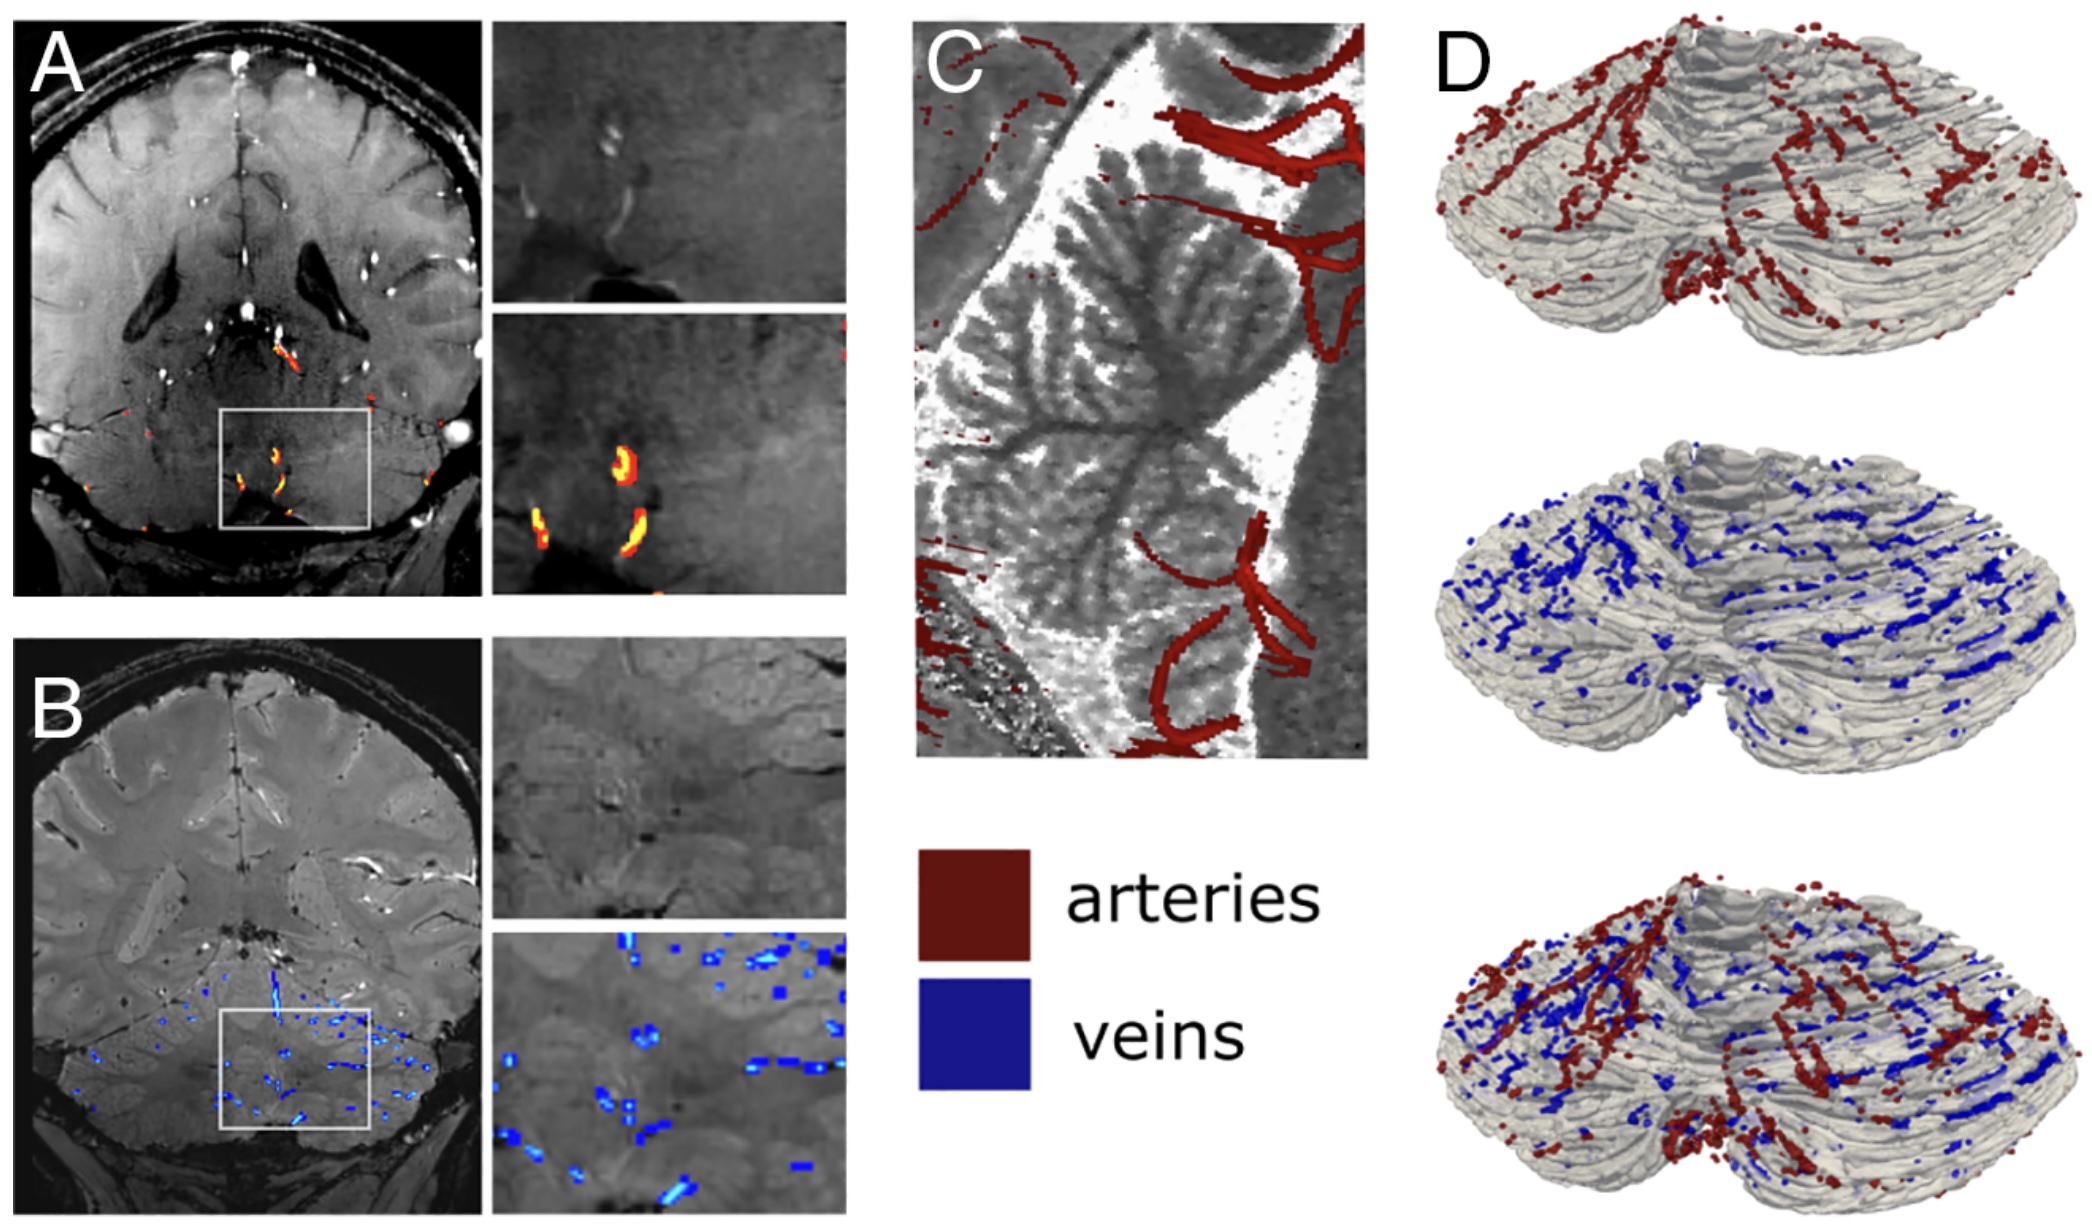
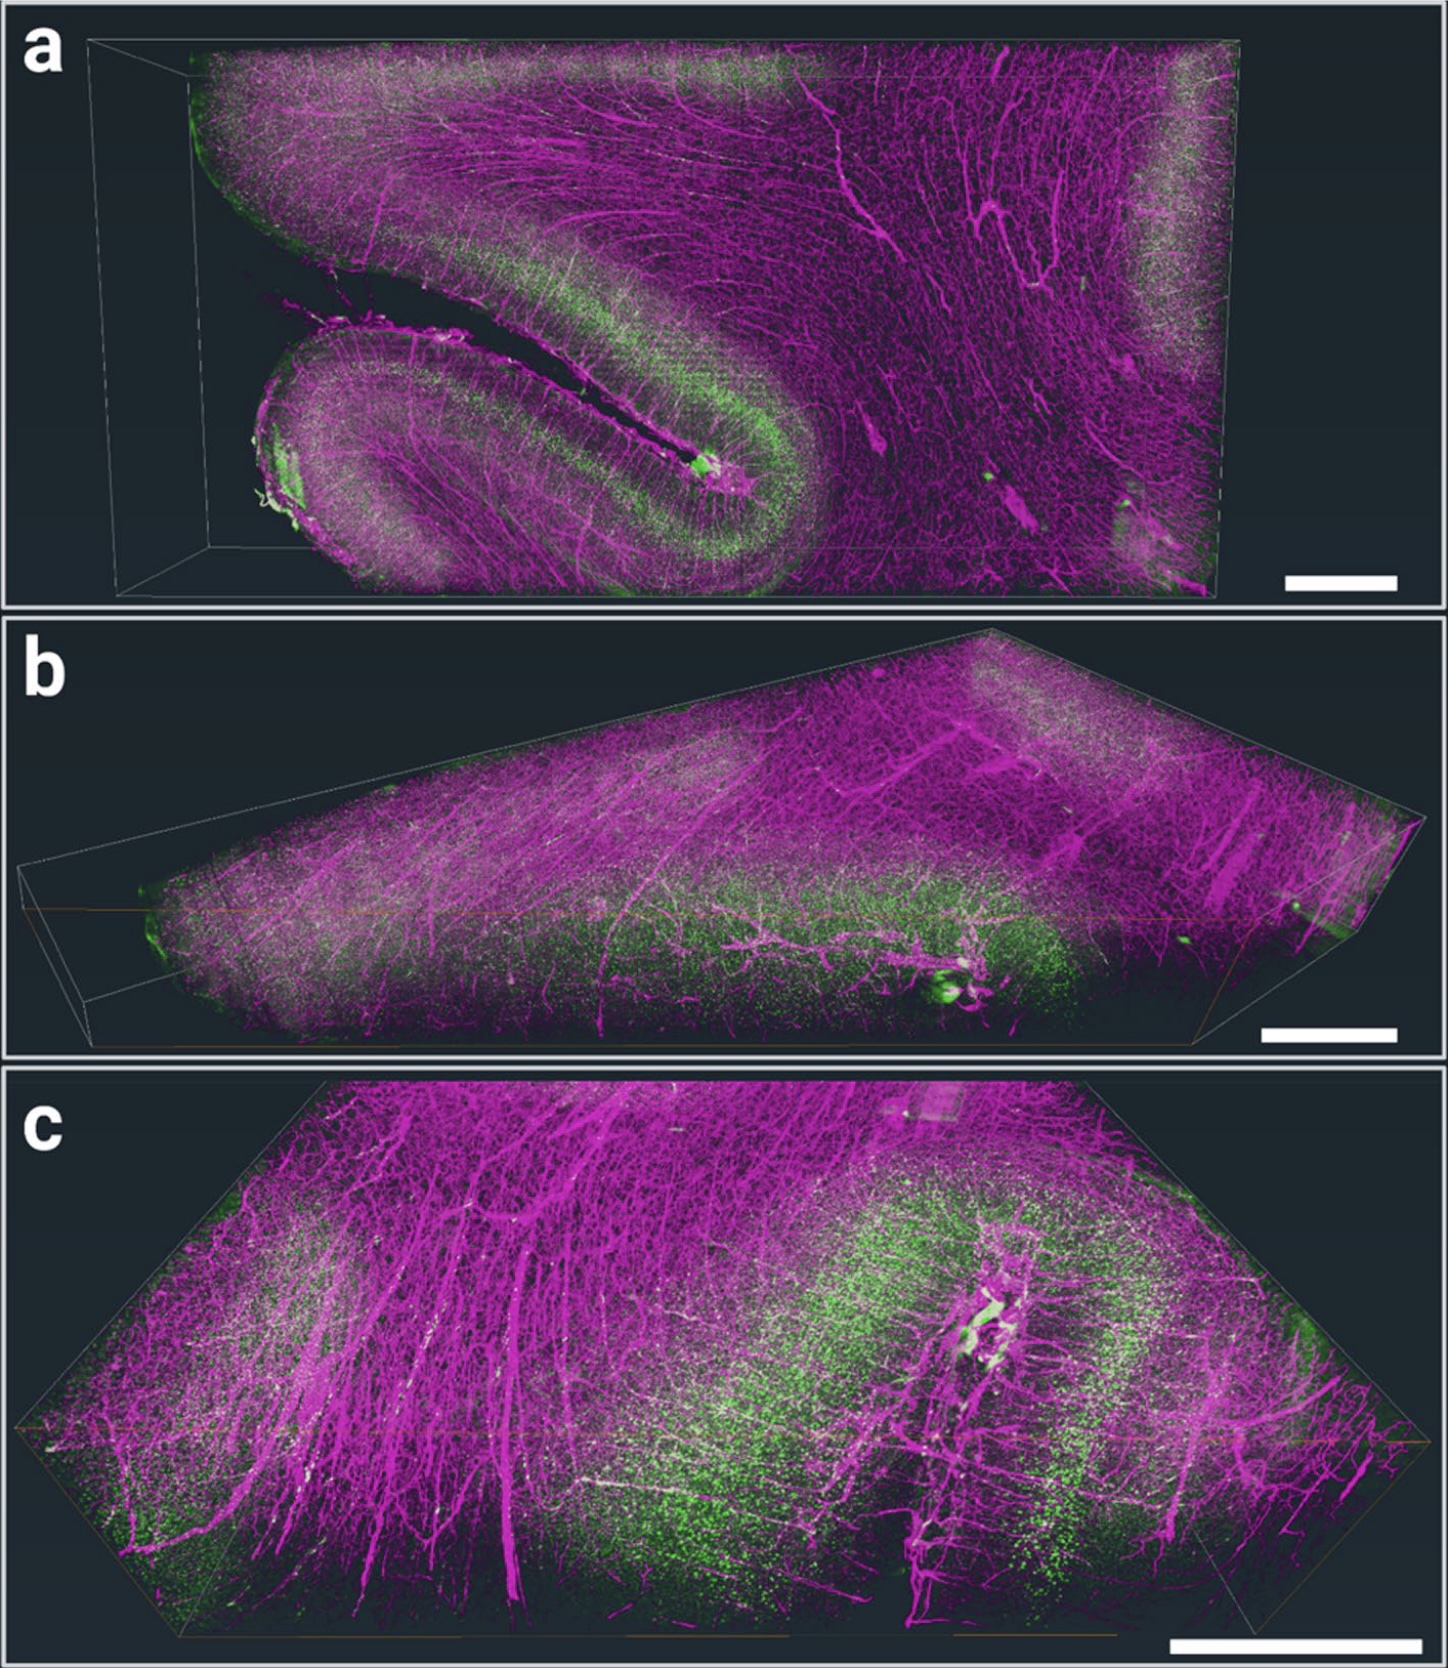
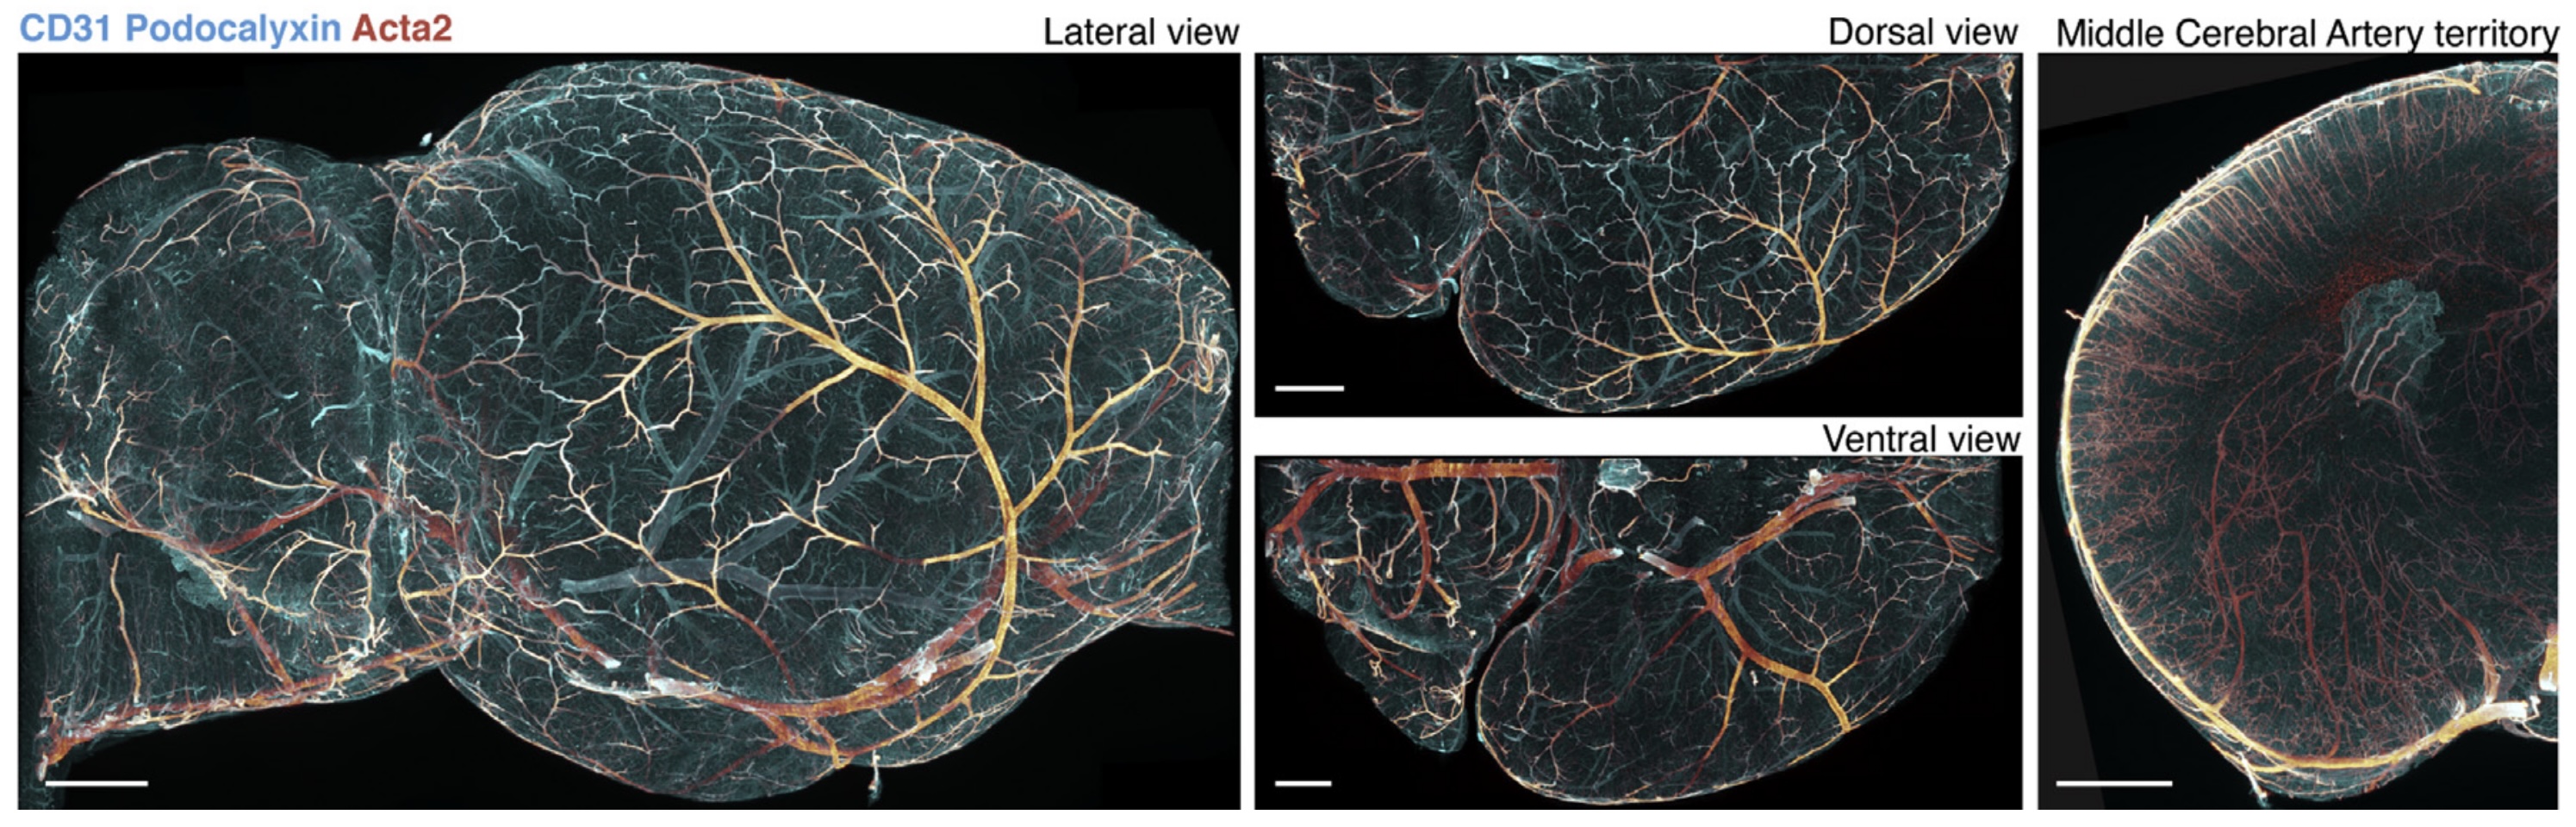
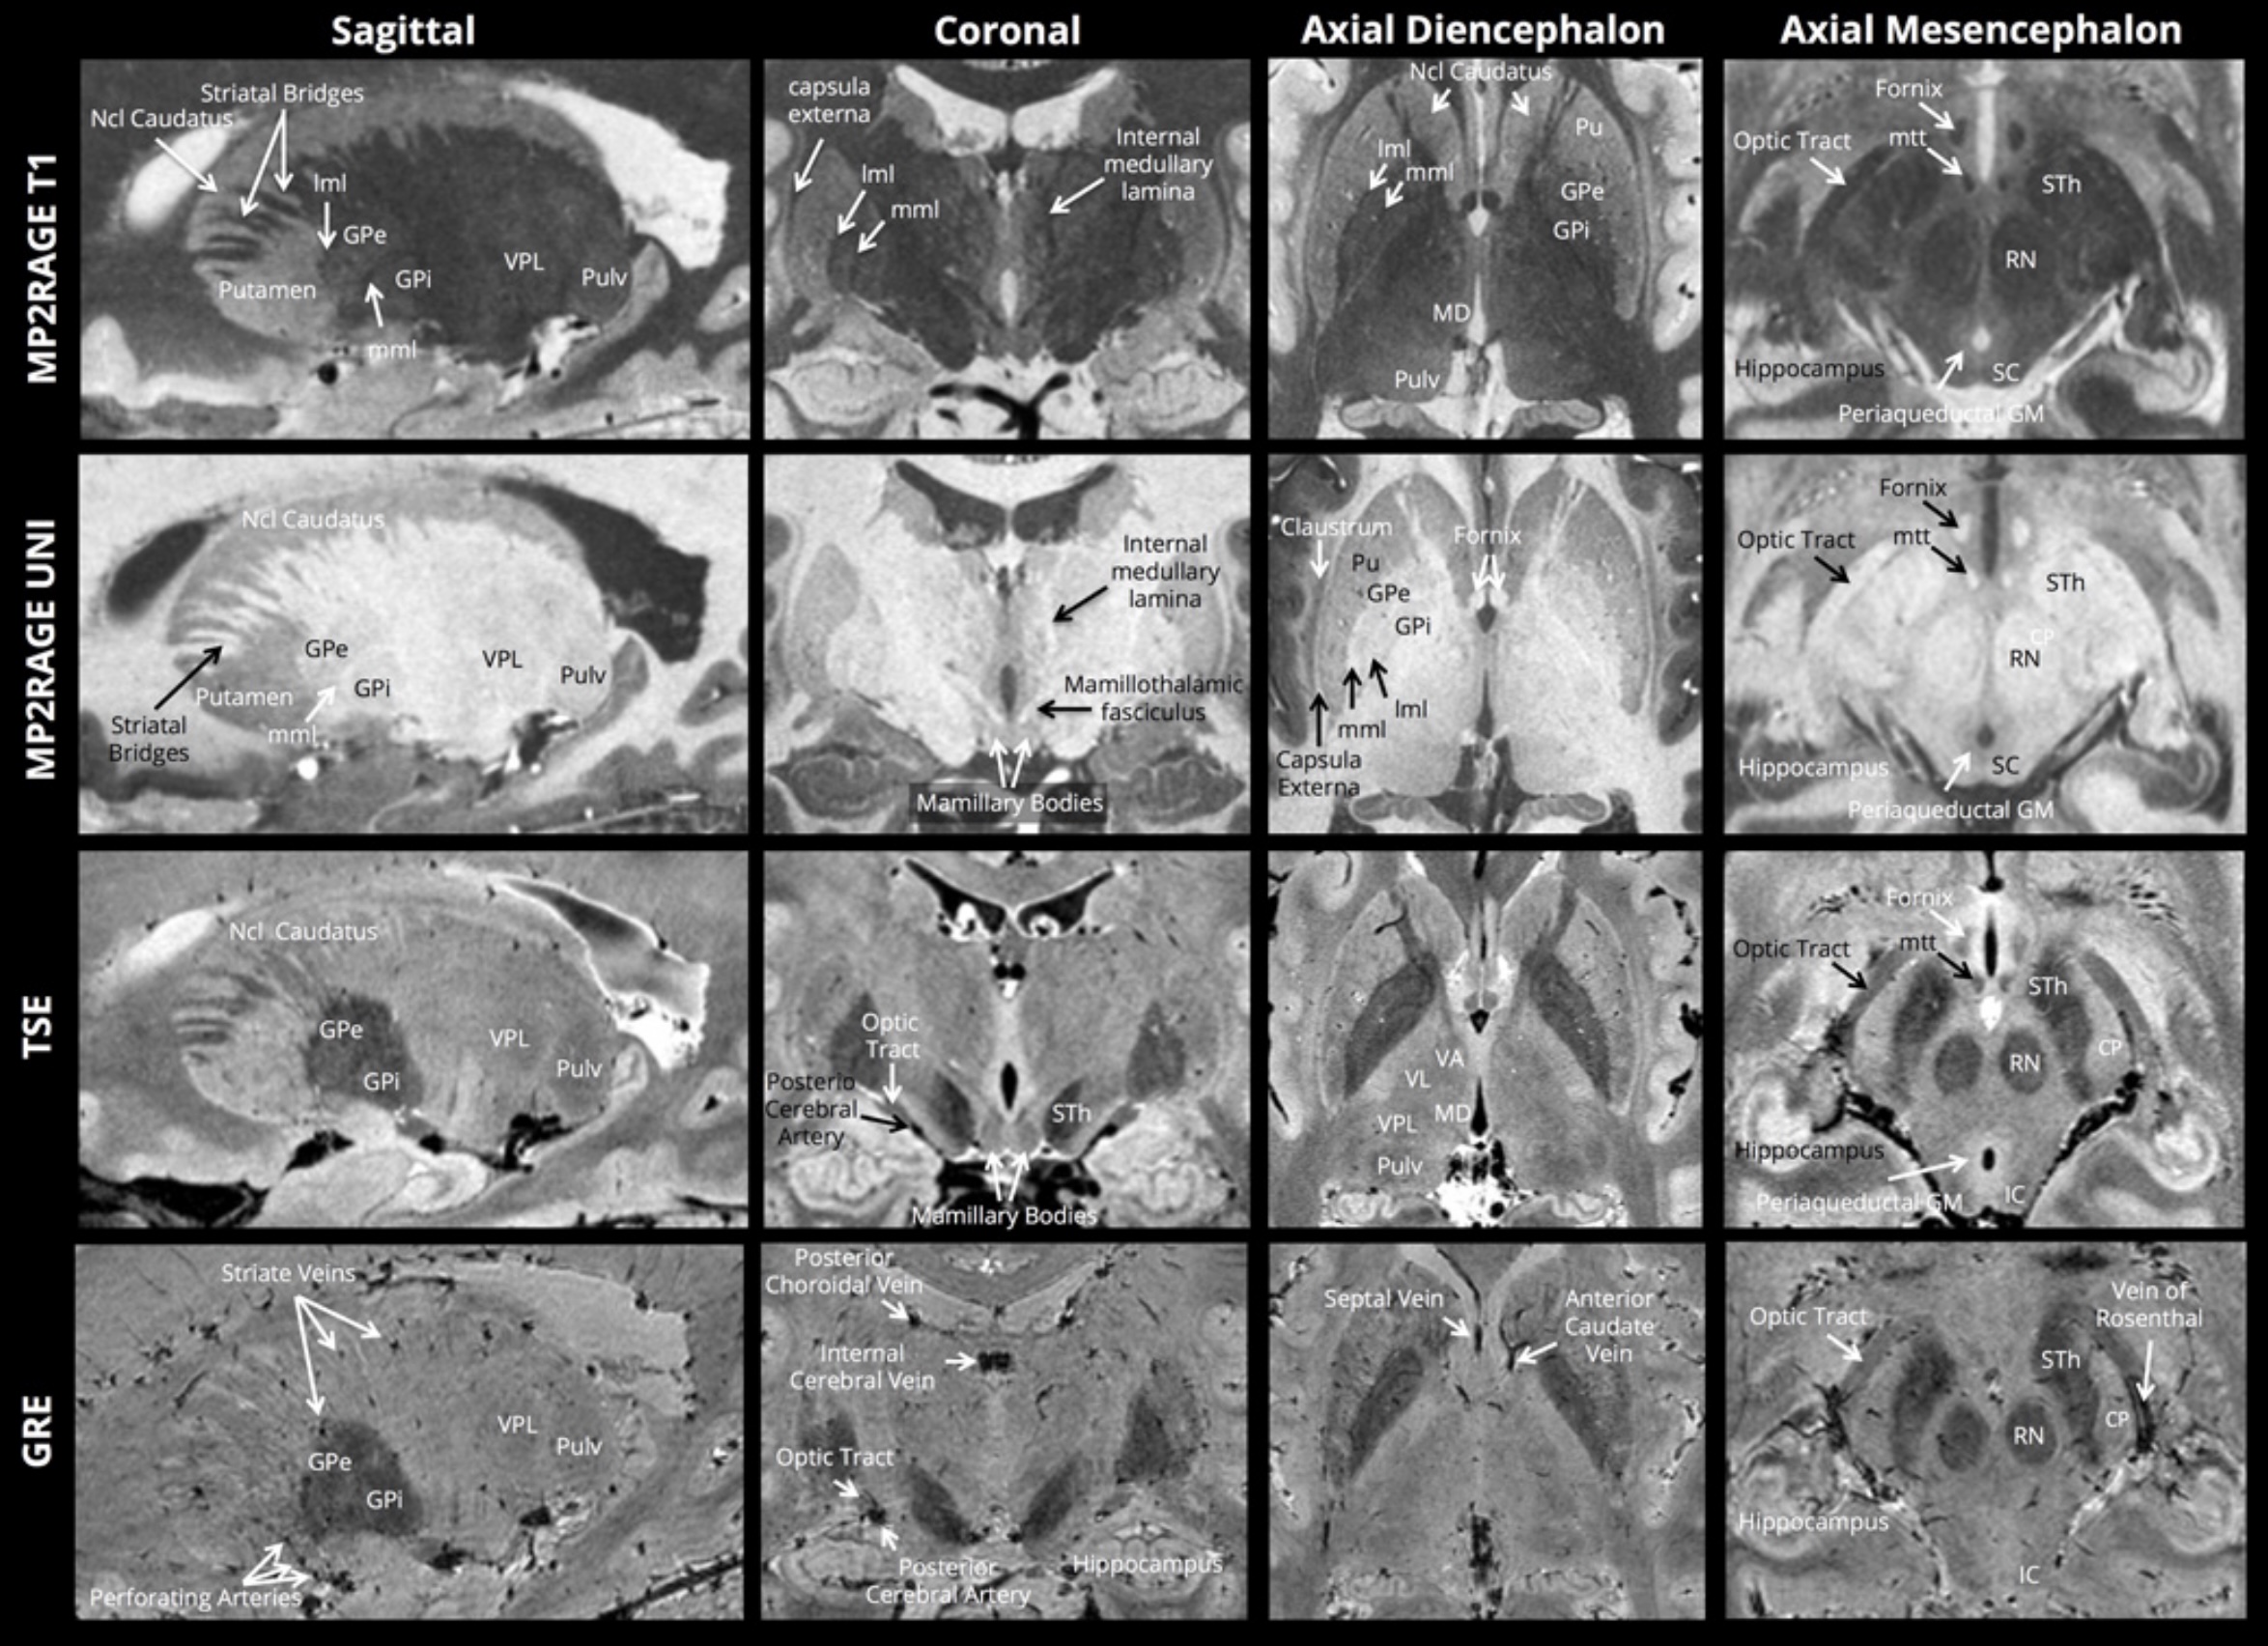
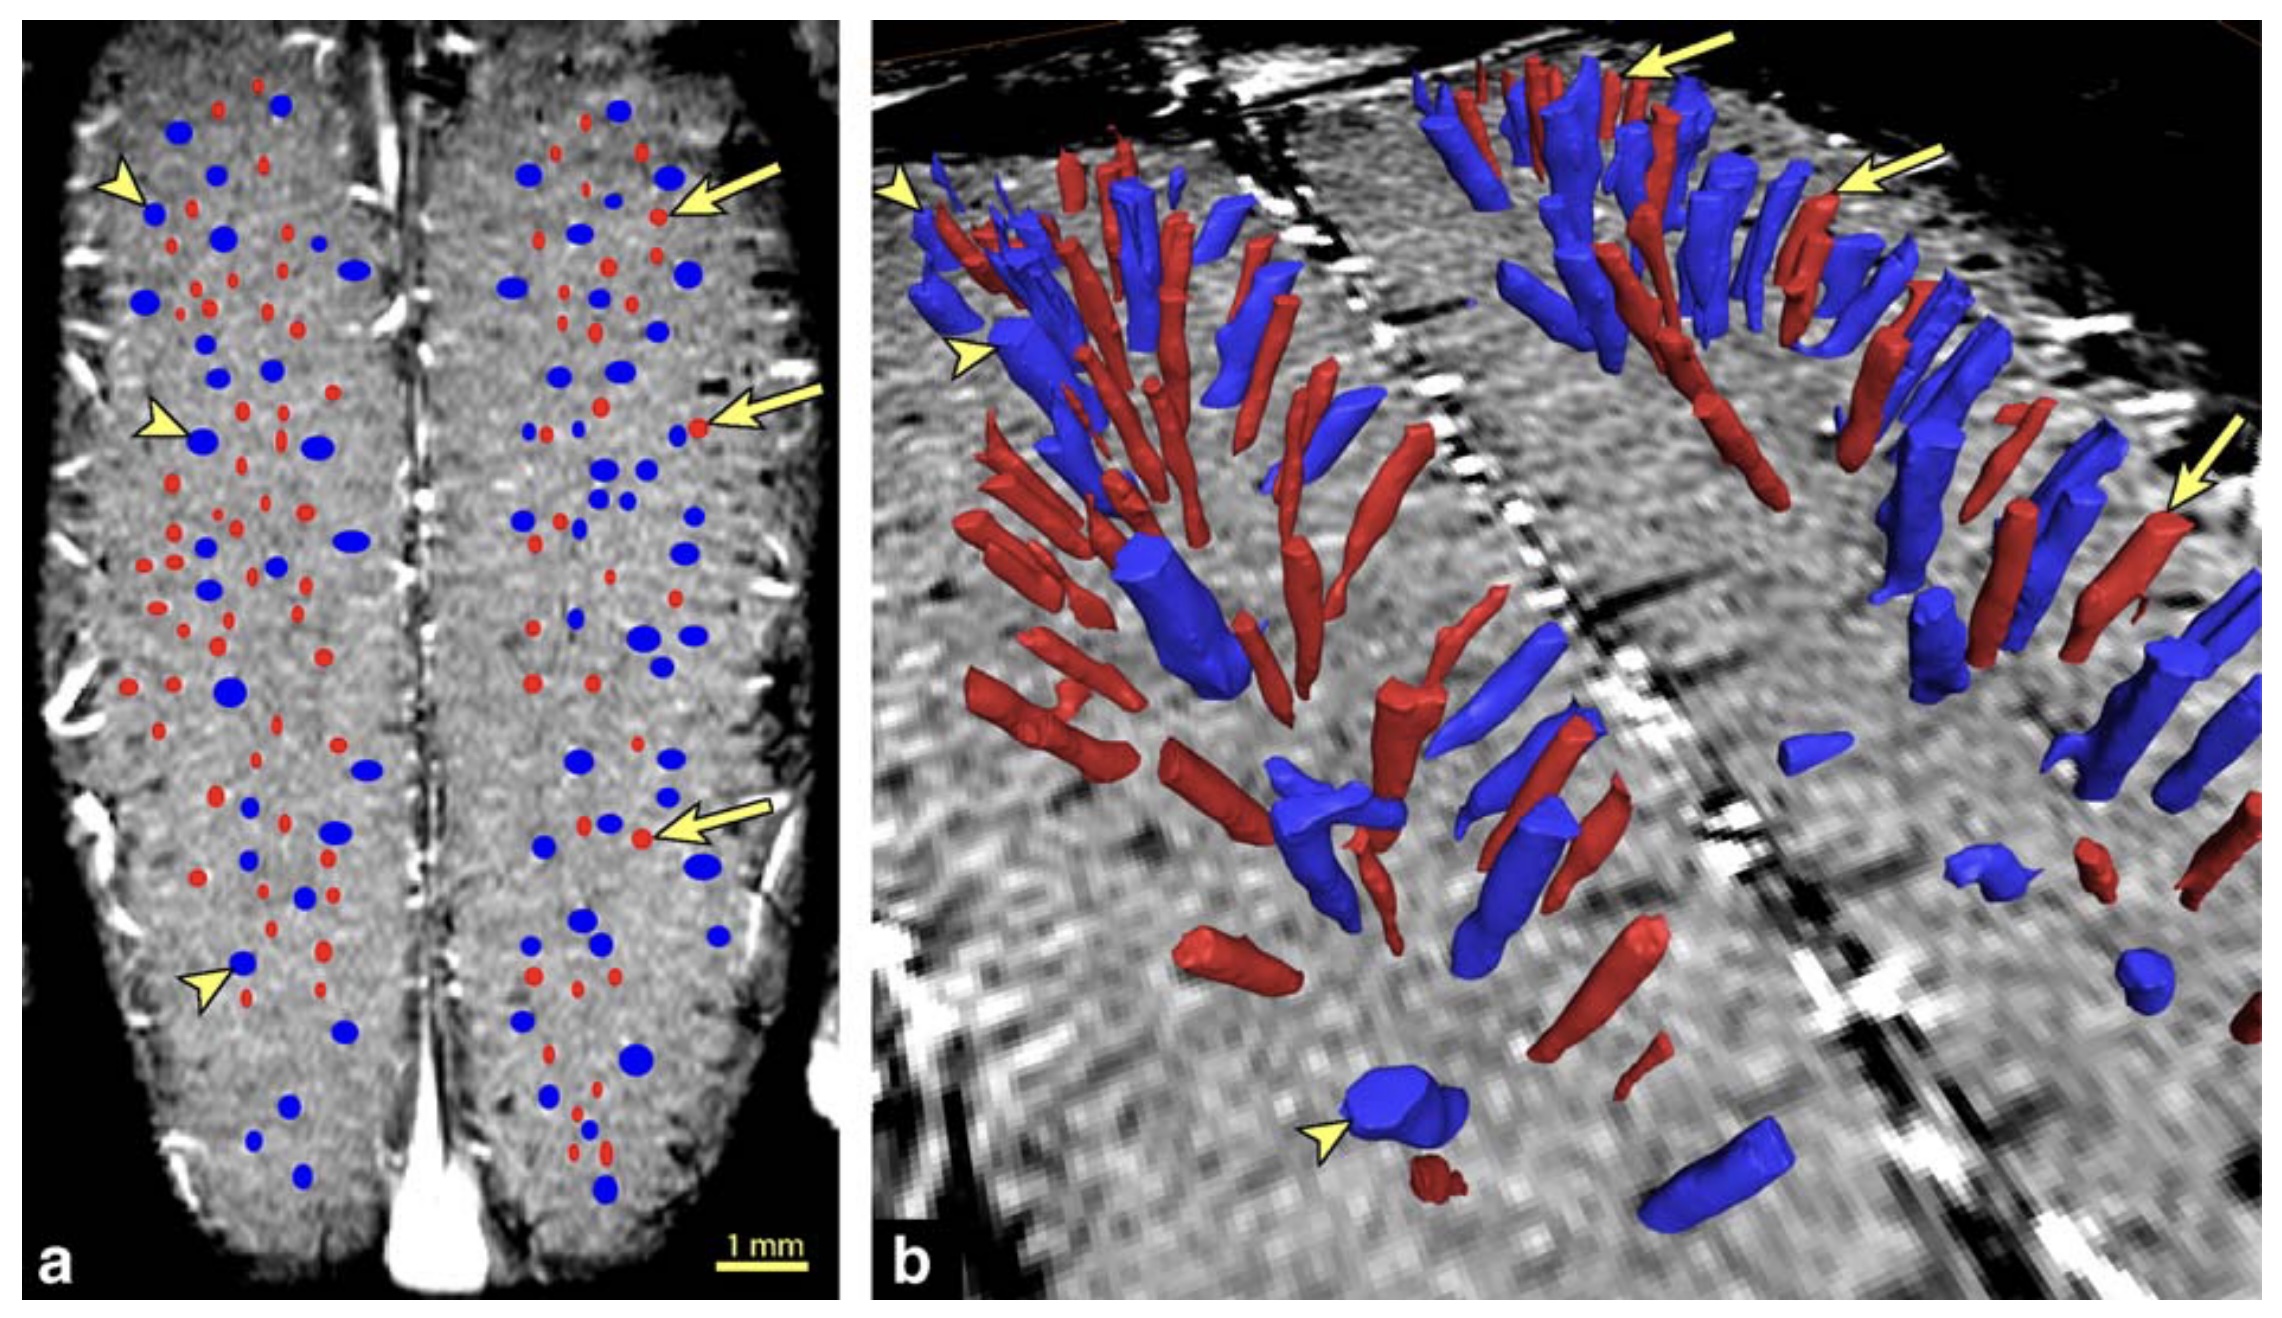
Priovoulos et al., 2026 // FIG 3 // Cerebellum meso-vessels. Arterial (red-yellow) and venous (blue-light blue) segmentations. (C) Maximum intensity projection of time-of-flight contrast overlaid on T1 map. (D) 3D reconstructions. In vivo MRI, 0.4 mm isotropic voxels for MP2RAGE, 0.5 mm isotropic voxels for TOF, 0.6 mm isotropic voxels for GRE.
doi.org/10.1073/pnas.2516608123
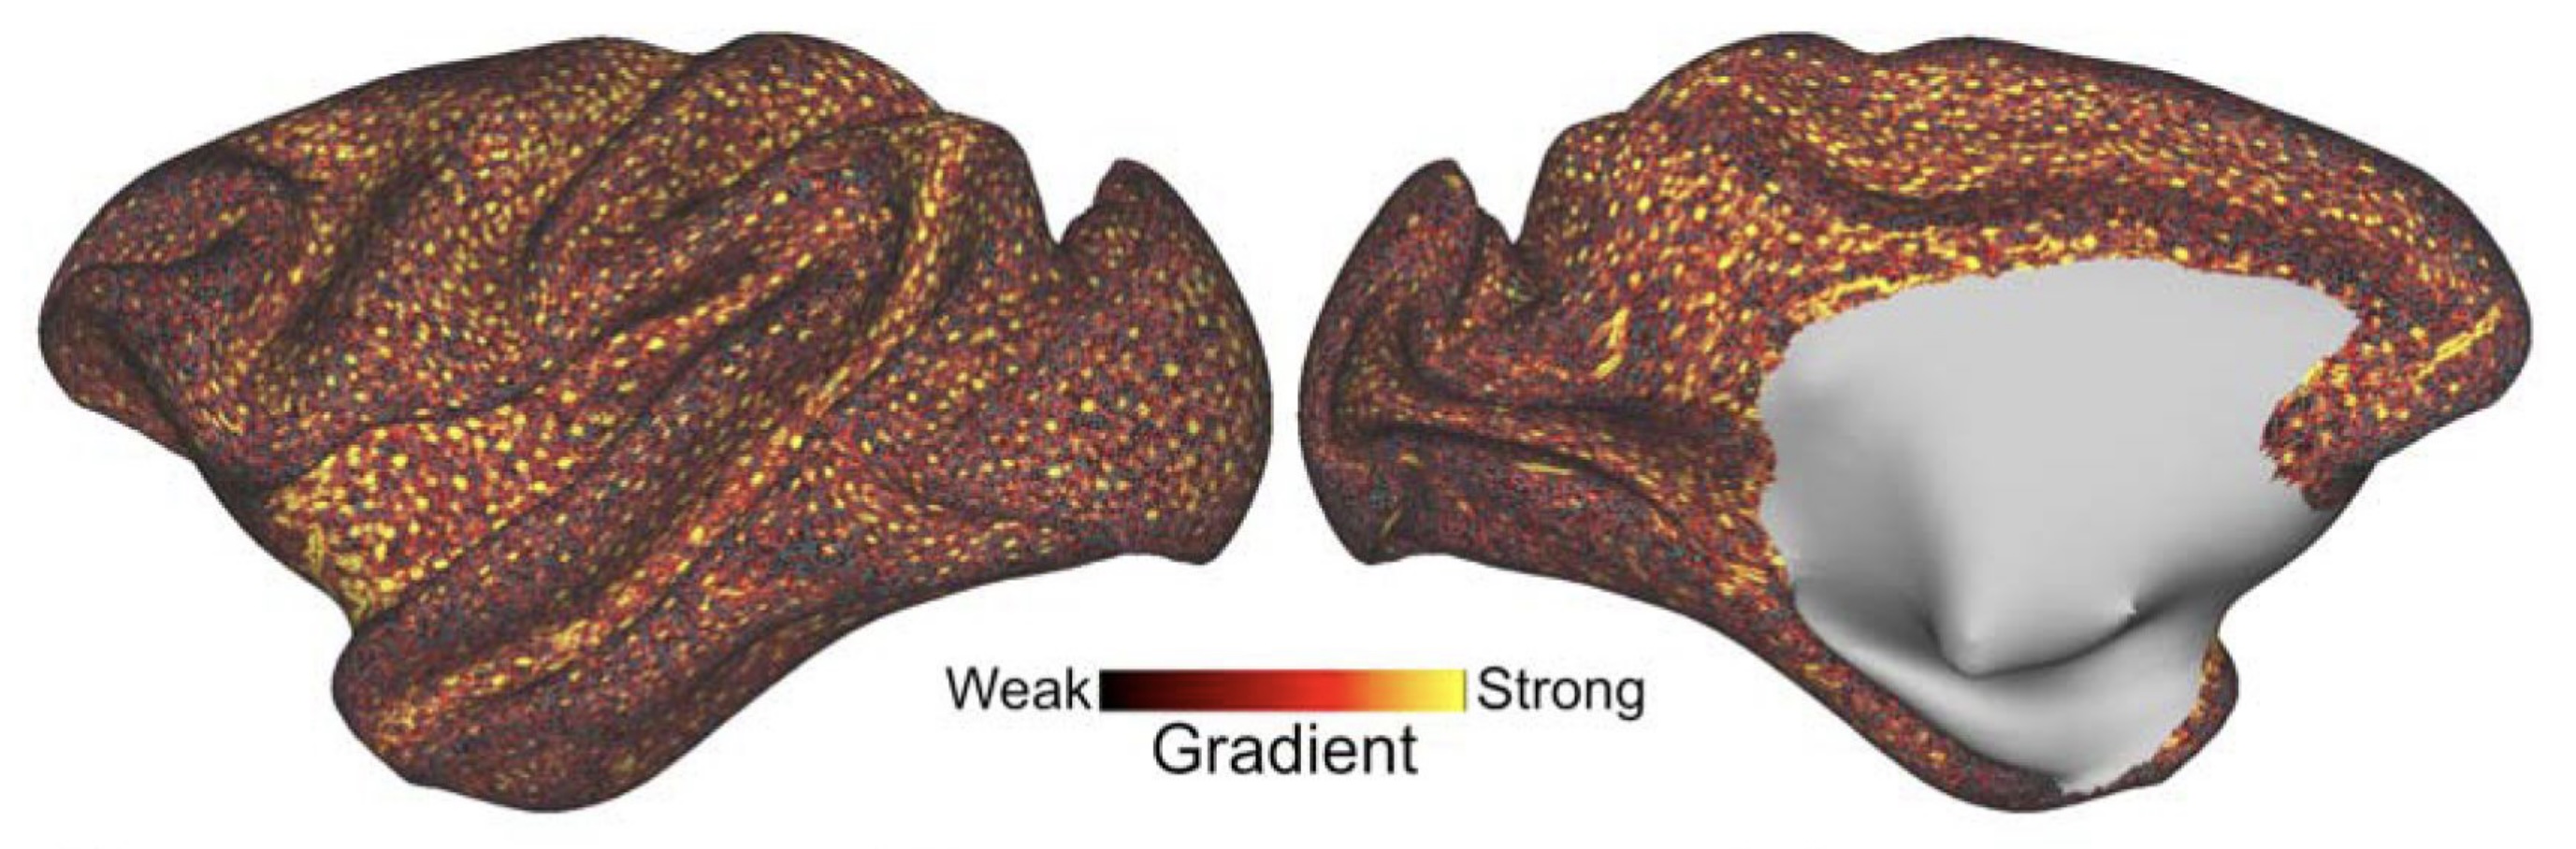
Autio et al., 2025 // FIG 2 // Macaque intracortical meso-vessels (yellow dots) on a cortical surface (~layer 4a). In vivo MRI at 0.23 mm isotropic voxels.
doi.org/10.7554/eLife.99940.3
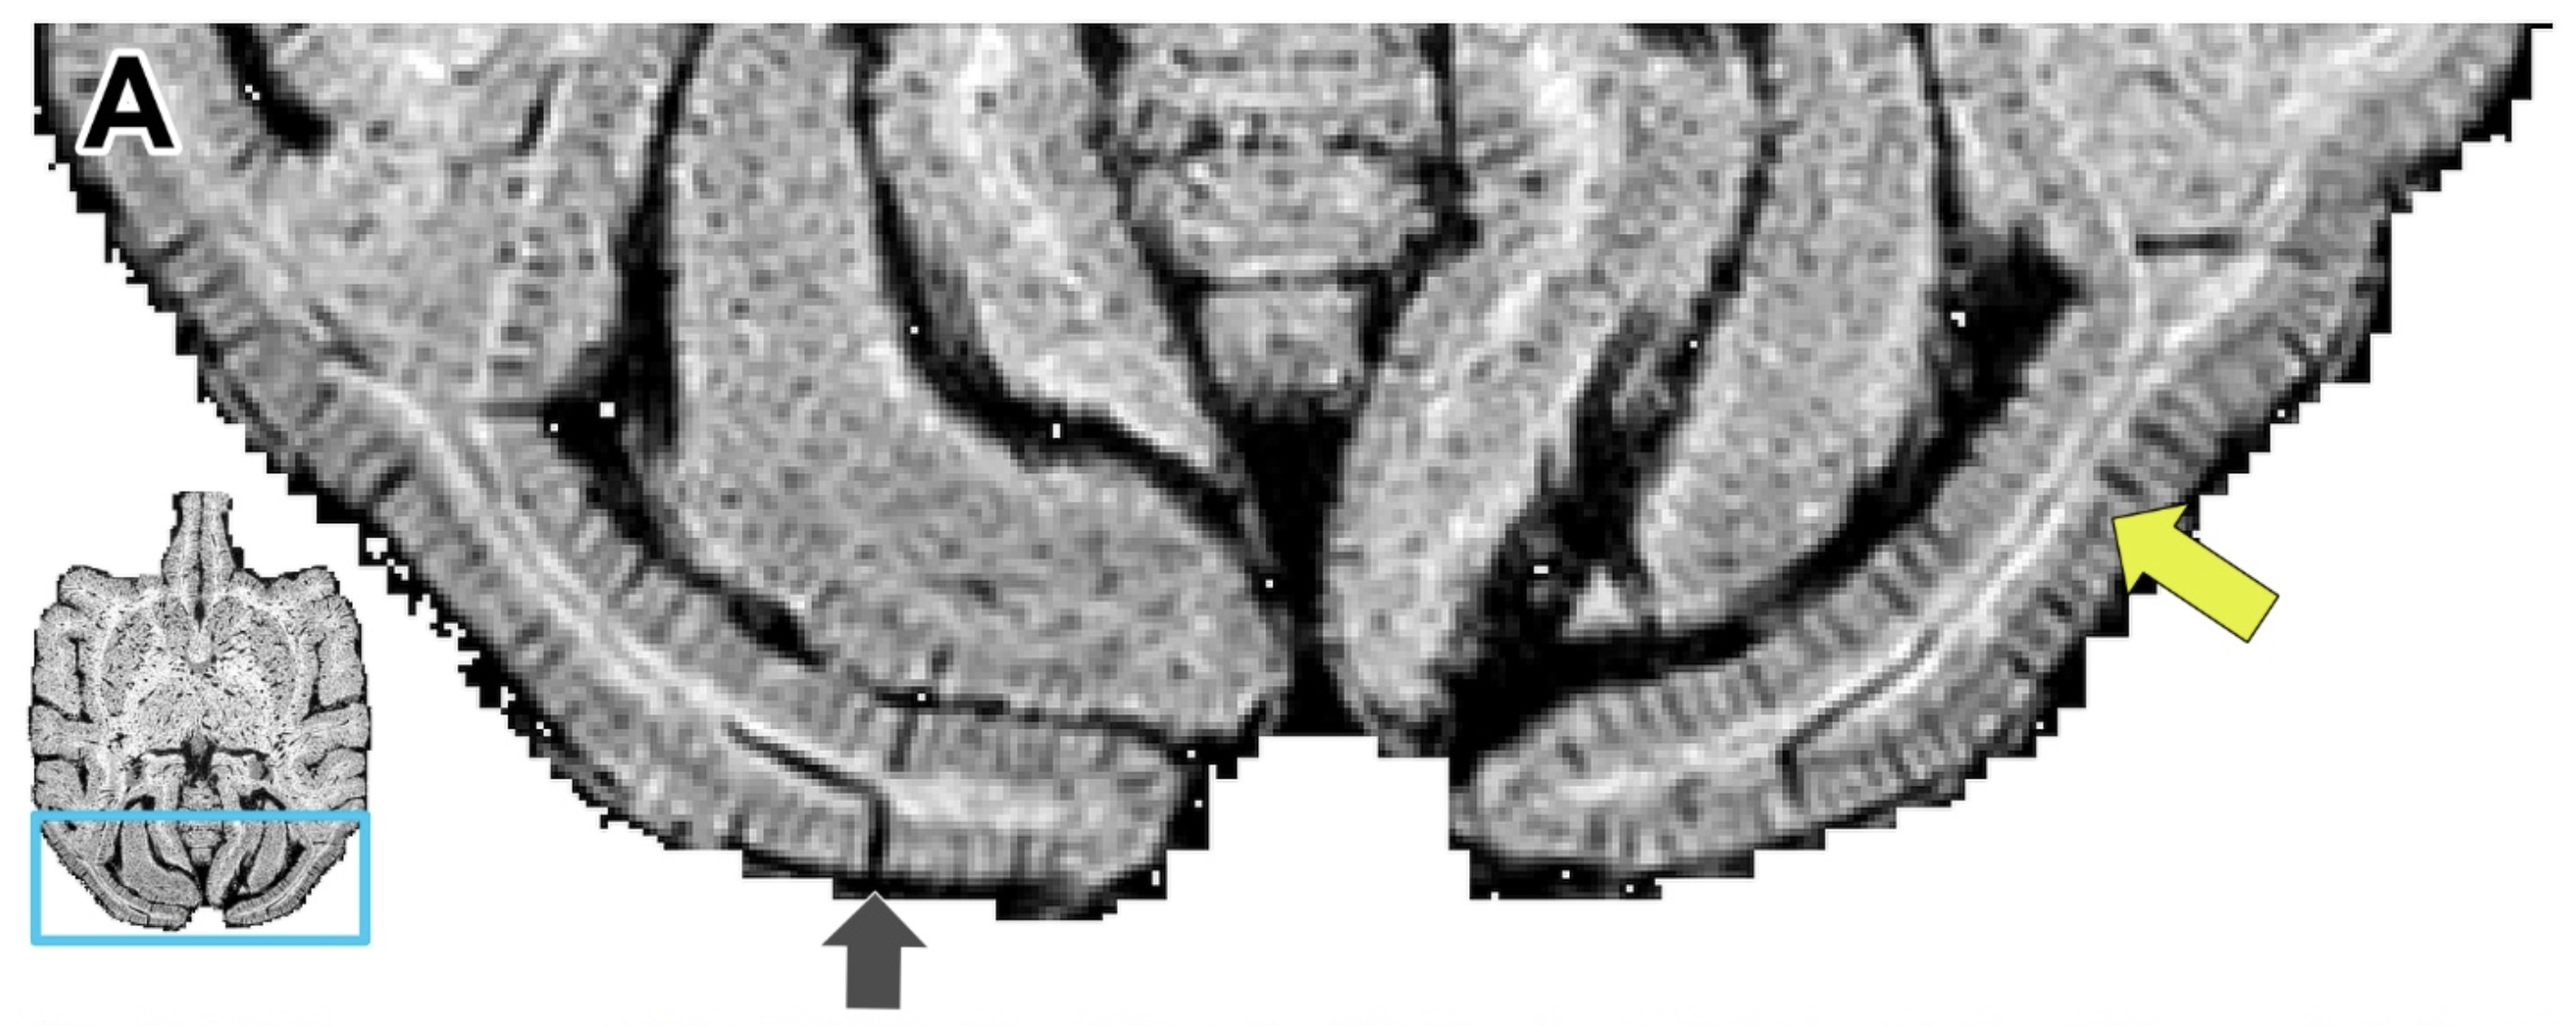
Autio et al., 2025 // FIG S3 // Ferumoxytol-weighted gradient-echo image shows meso-vessels in macaque. The yellow arrow highlights a layer with high vascular density, likely corresponding to the primary input layer IVc. In vivo MRI at 0.23 mm isotropic voxels.
doi.org/10.7554/eLife.99940.3
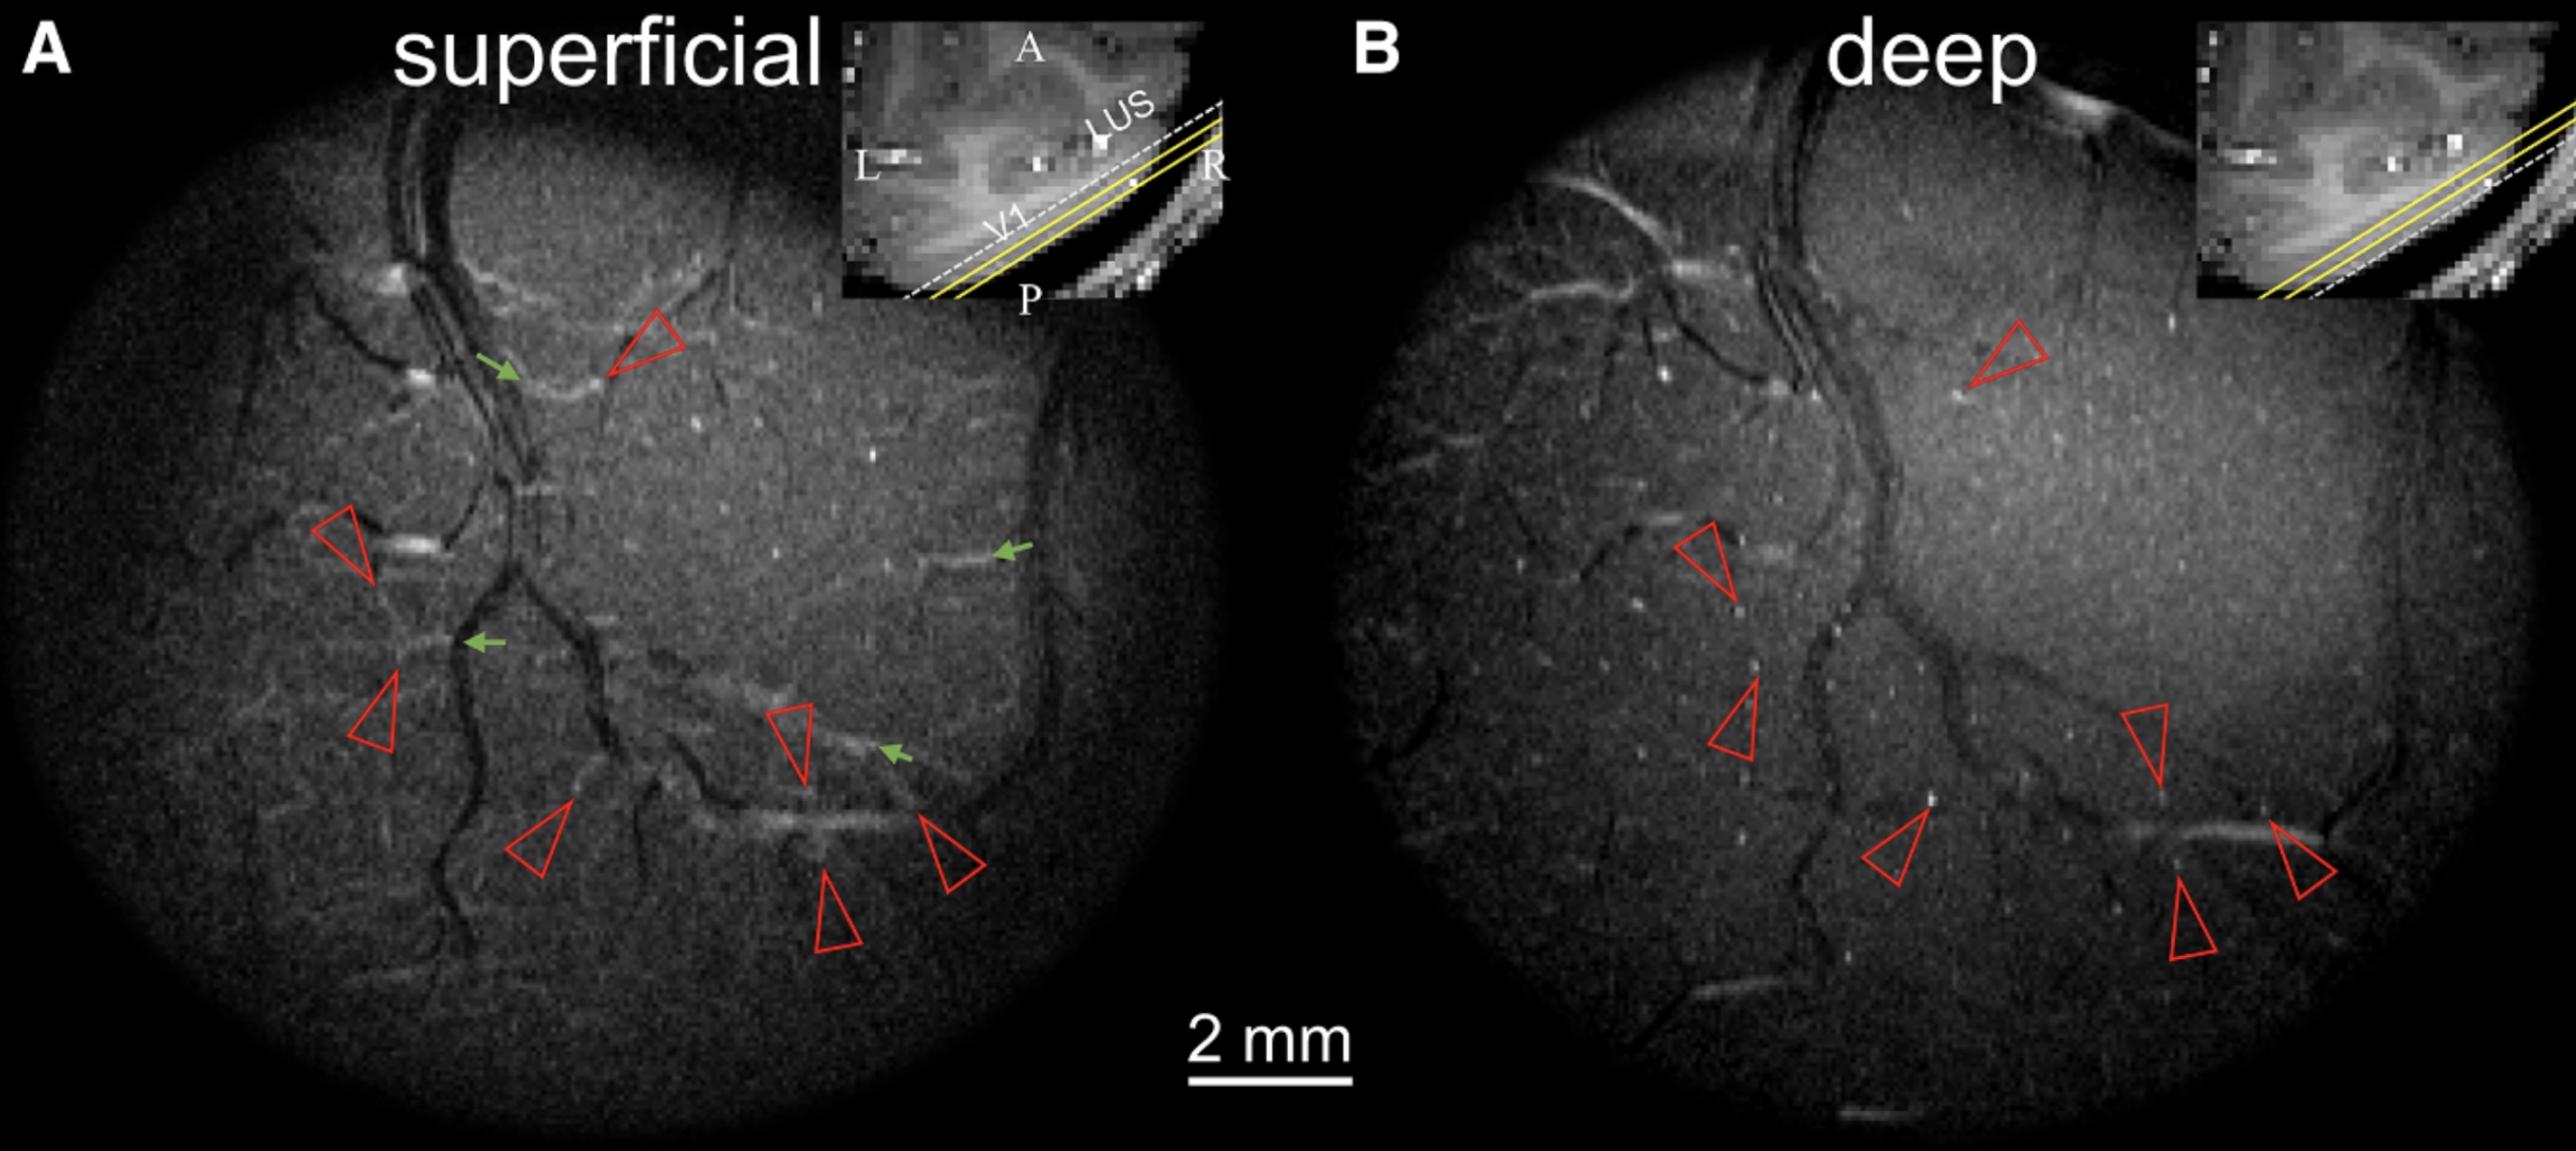
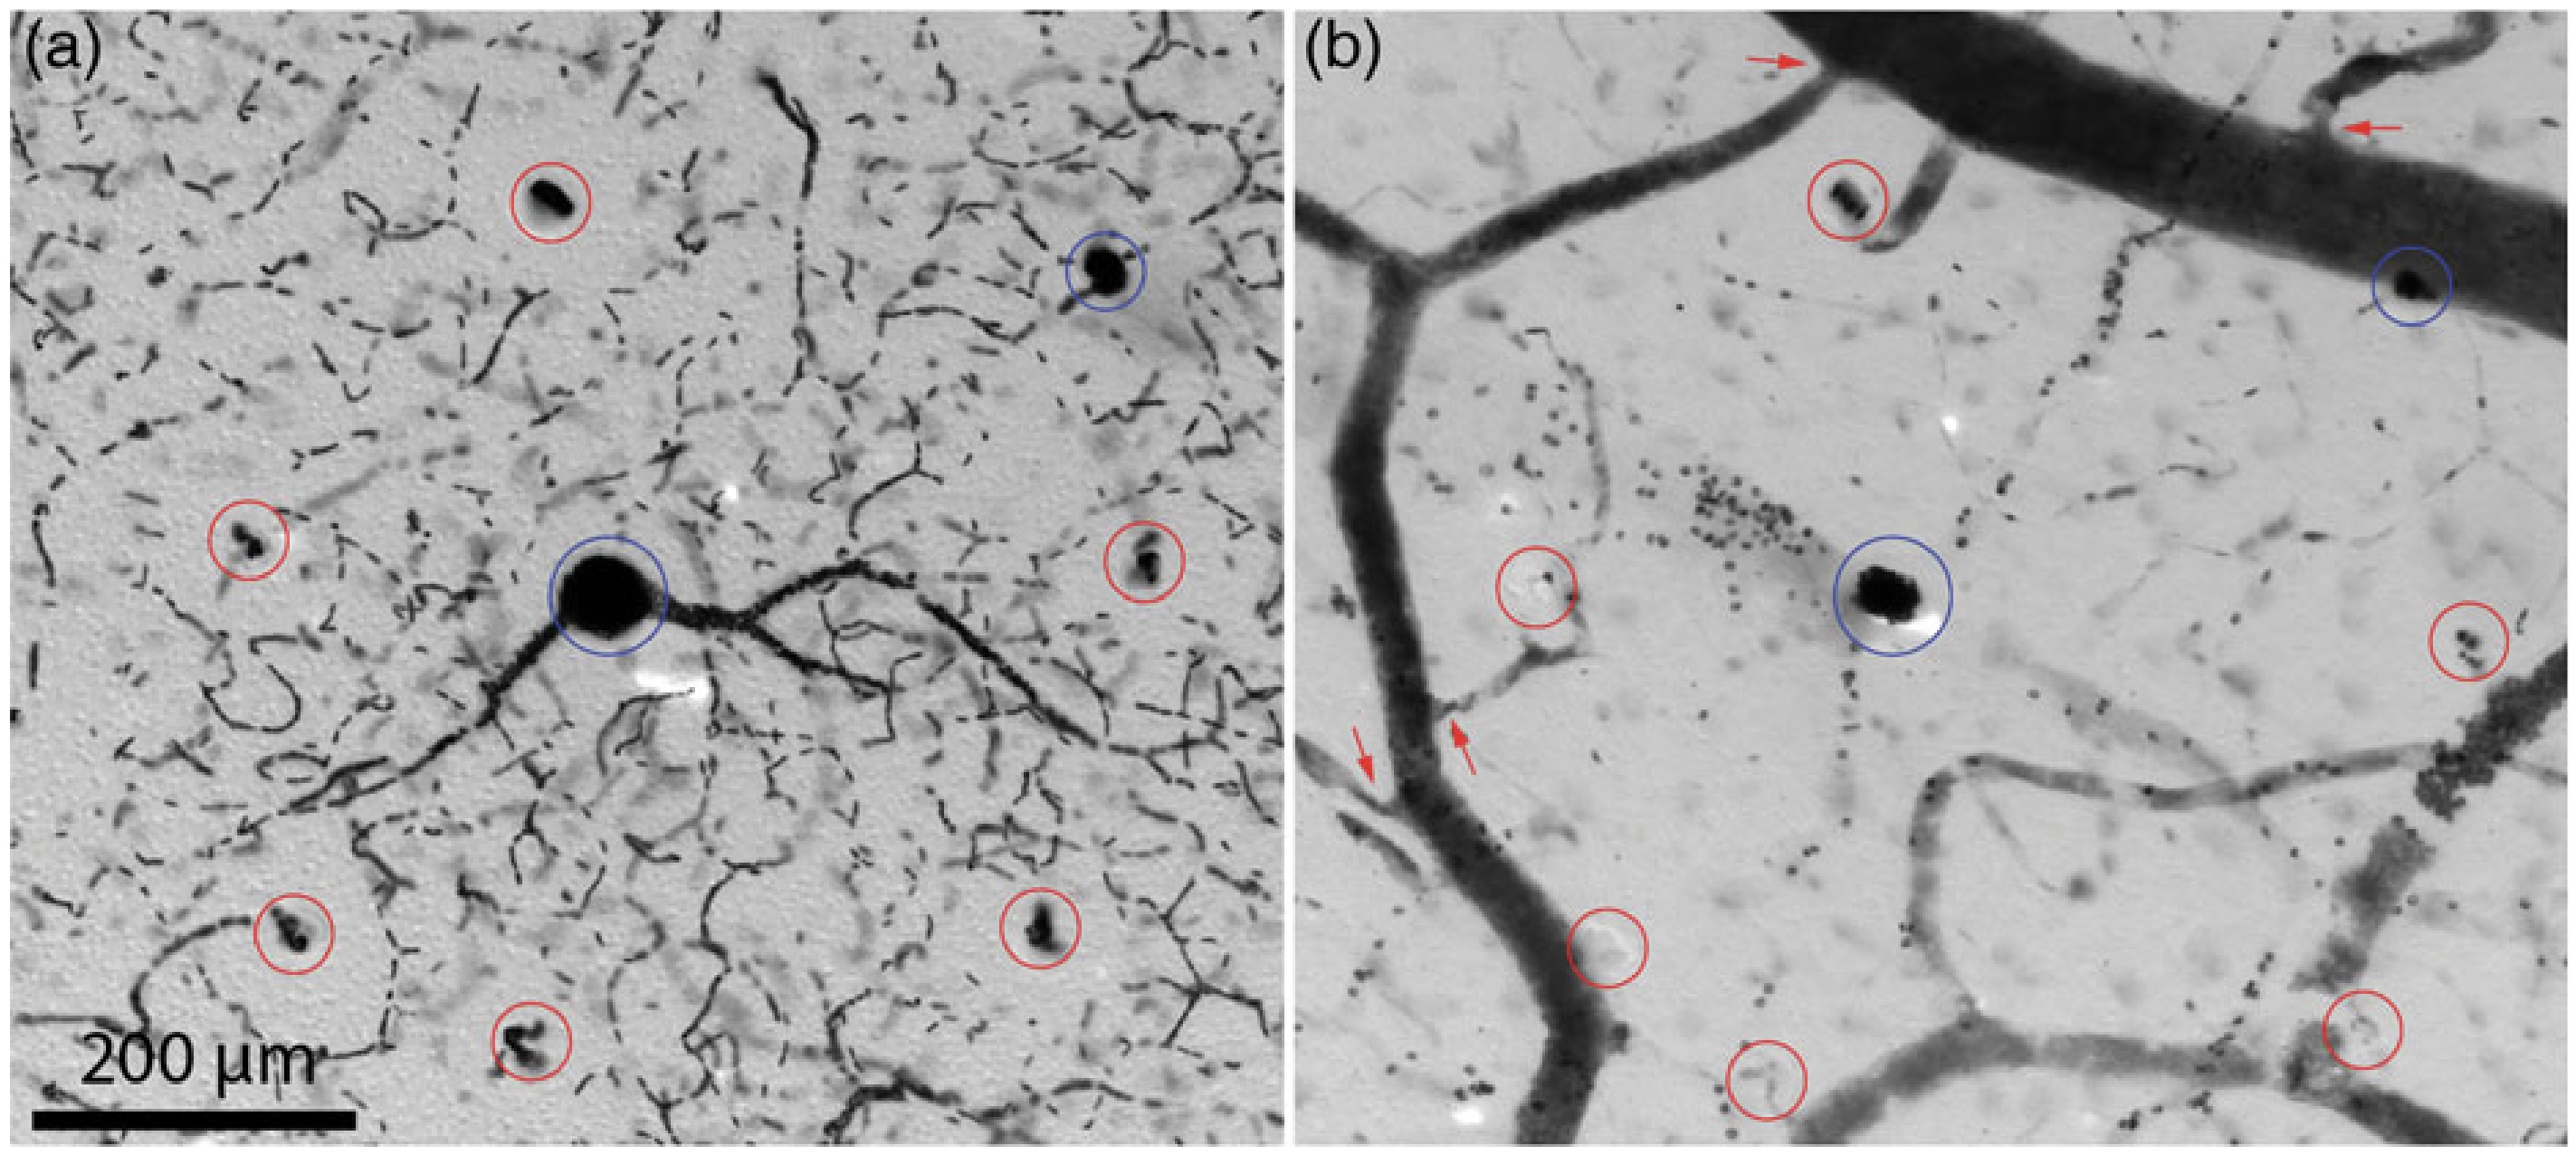
Wang et al., 2025 // FIG 6 // Macaque intracortical meso-vessels. Red arrows indicate locations intersection between tangential pial (in A) and radial (in B) arteries. Green arrows indicate bifurcations of pial vessels. In vivo MRI, time-of-flight contrast, 64 × 64 × 1000 μm3 voxels.
doi.org/10.1016/j.neuron.2025.05.028
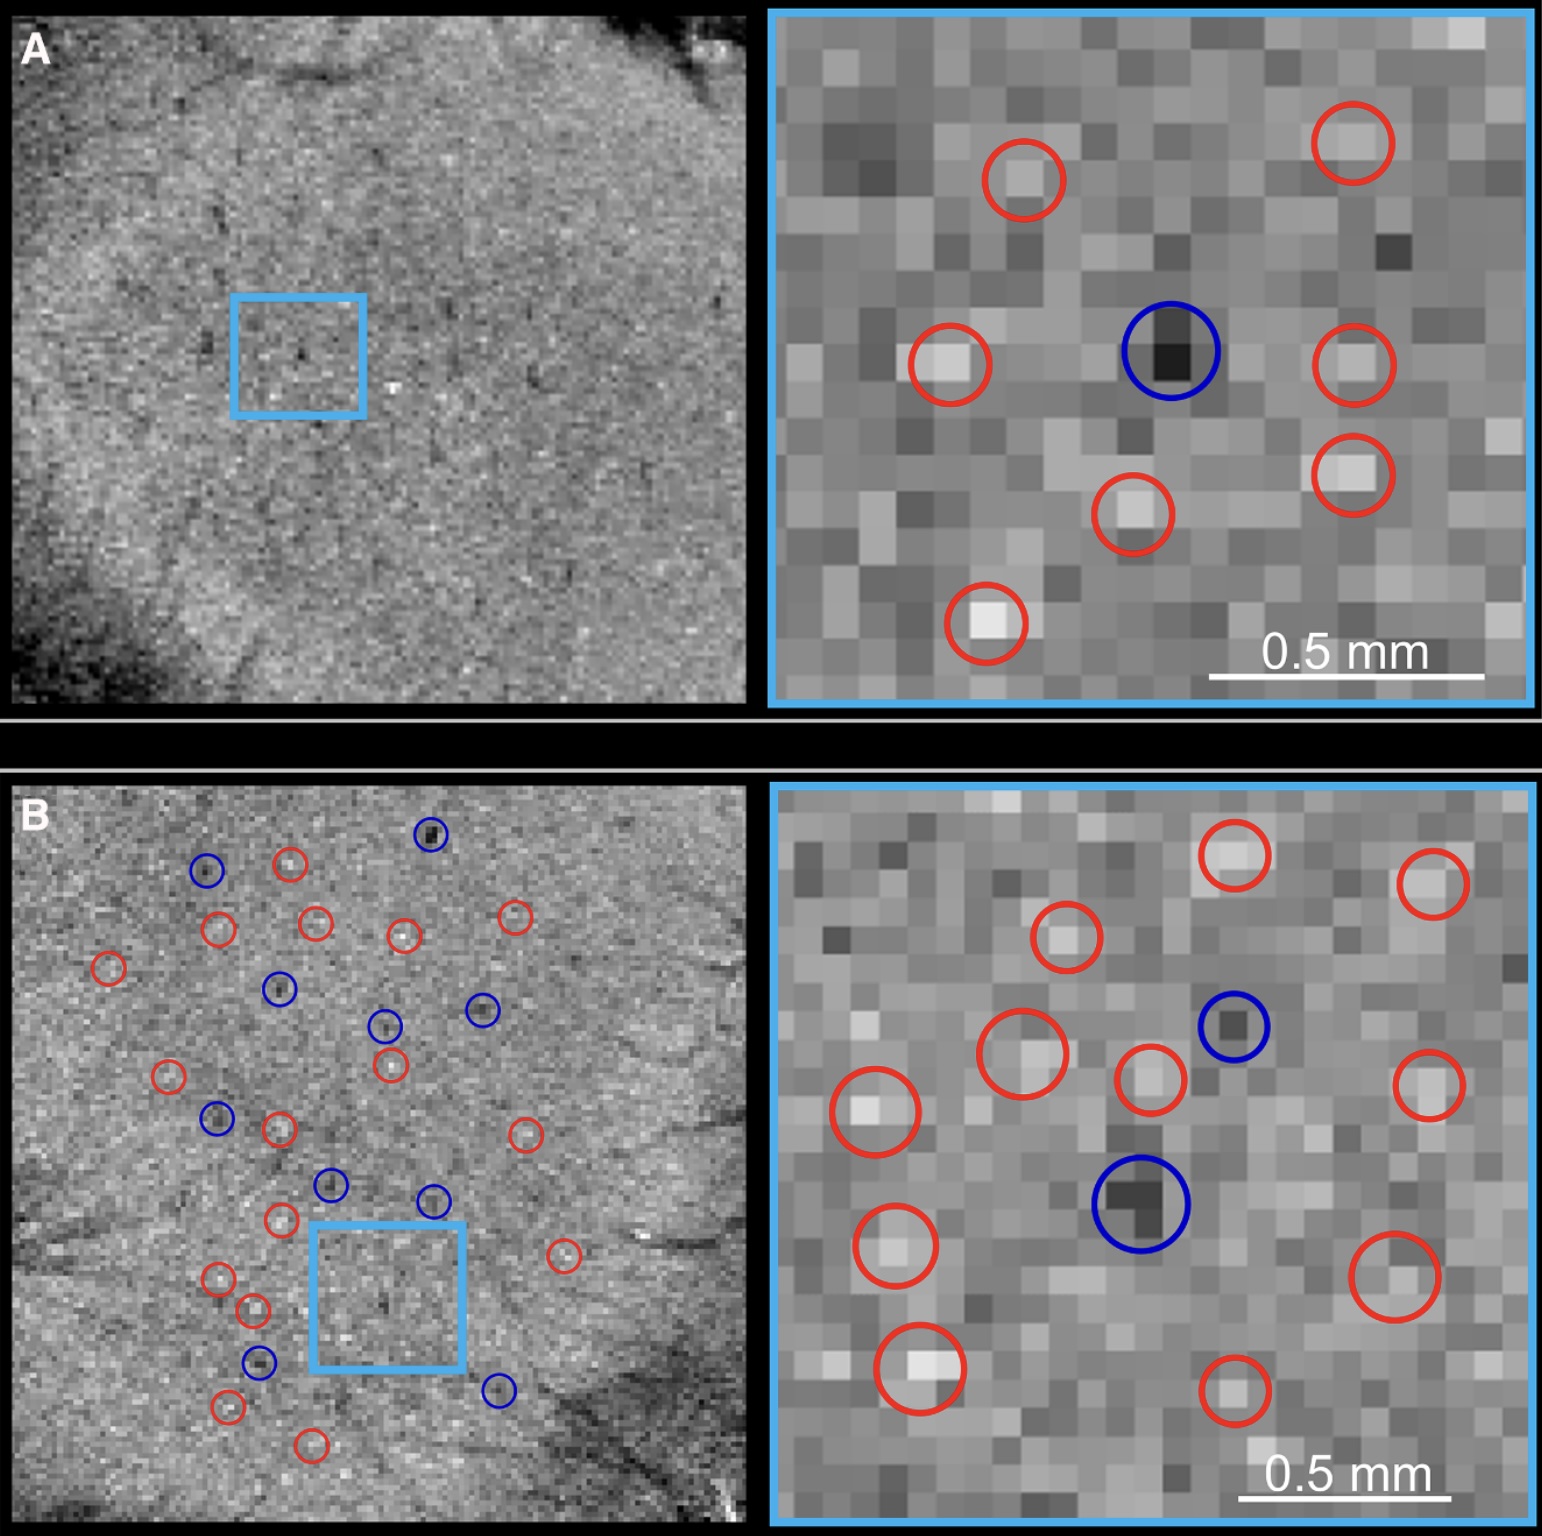
Wang et al., 2025 // FIG 7 // Macaque intracortical meso-vessels. Red circles indicate arteries, blue circles indicate veins. In vivo MRI, time-of-flight contrast, 64 × 64 × 1000 μm3 voxels.
doi.org/10.1016/j.neuron.2025.05.028
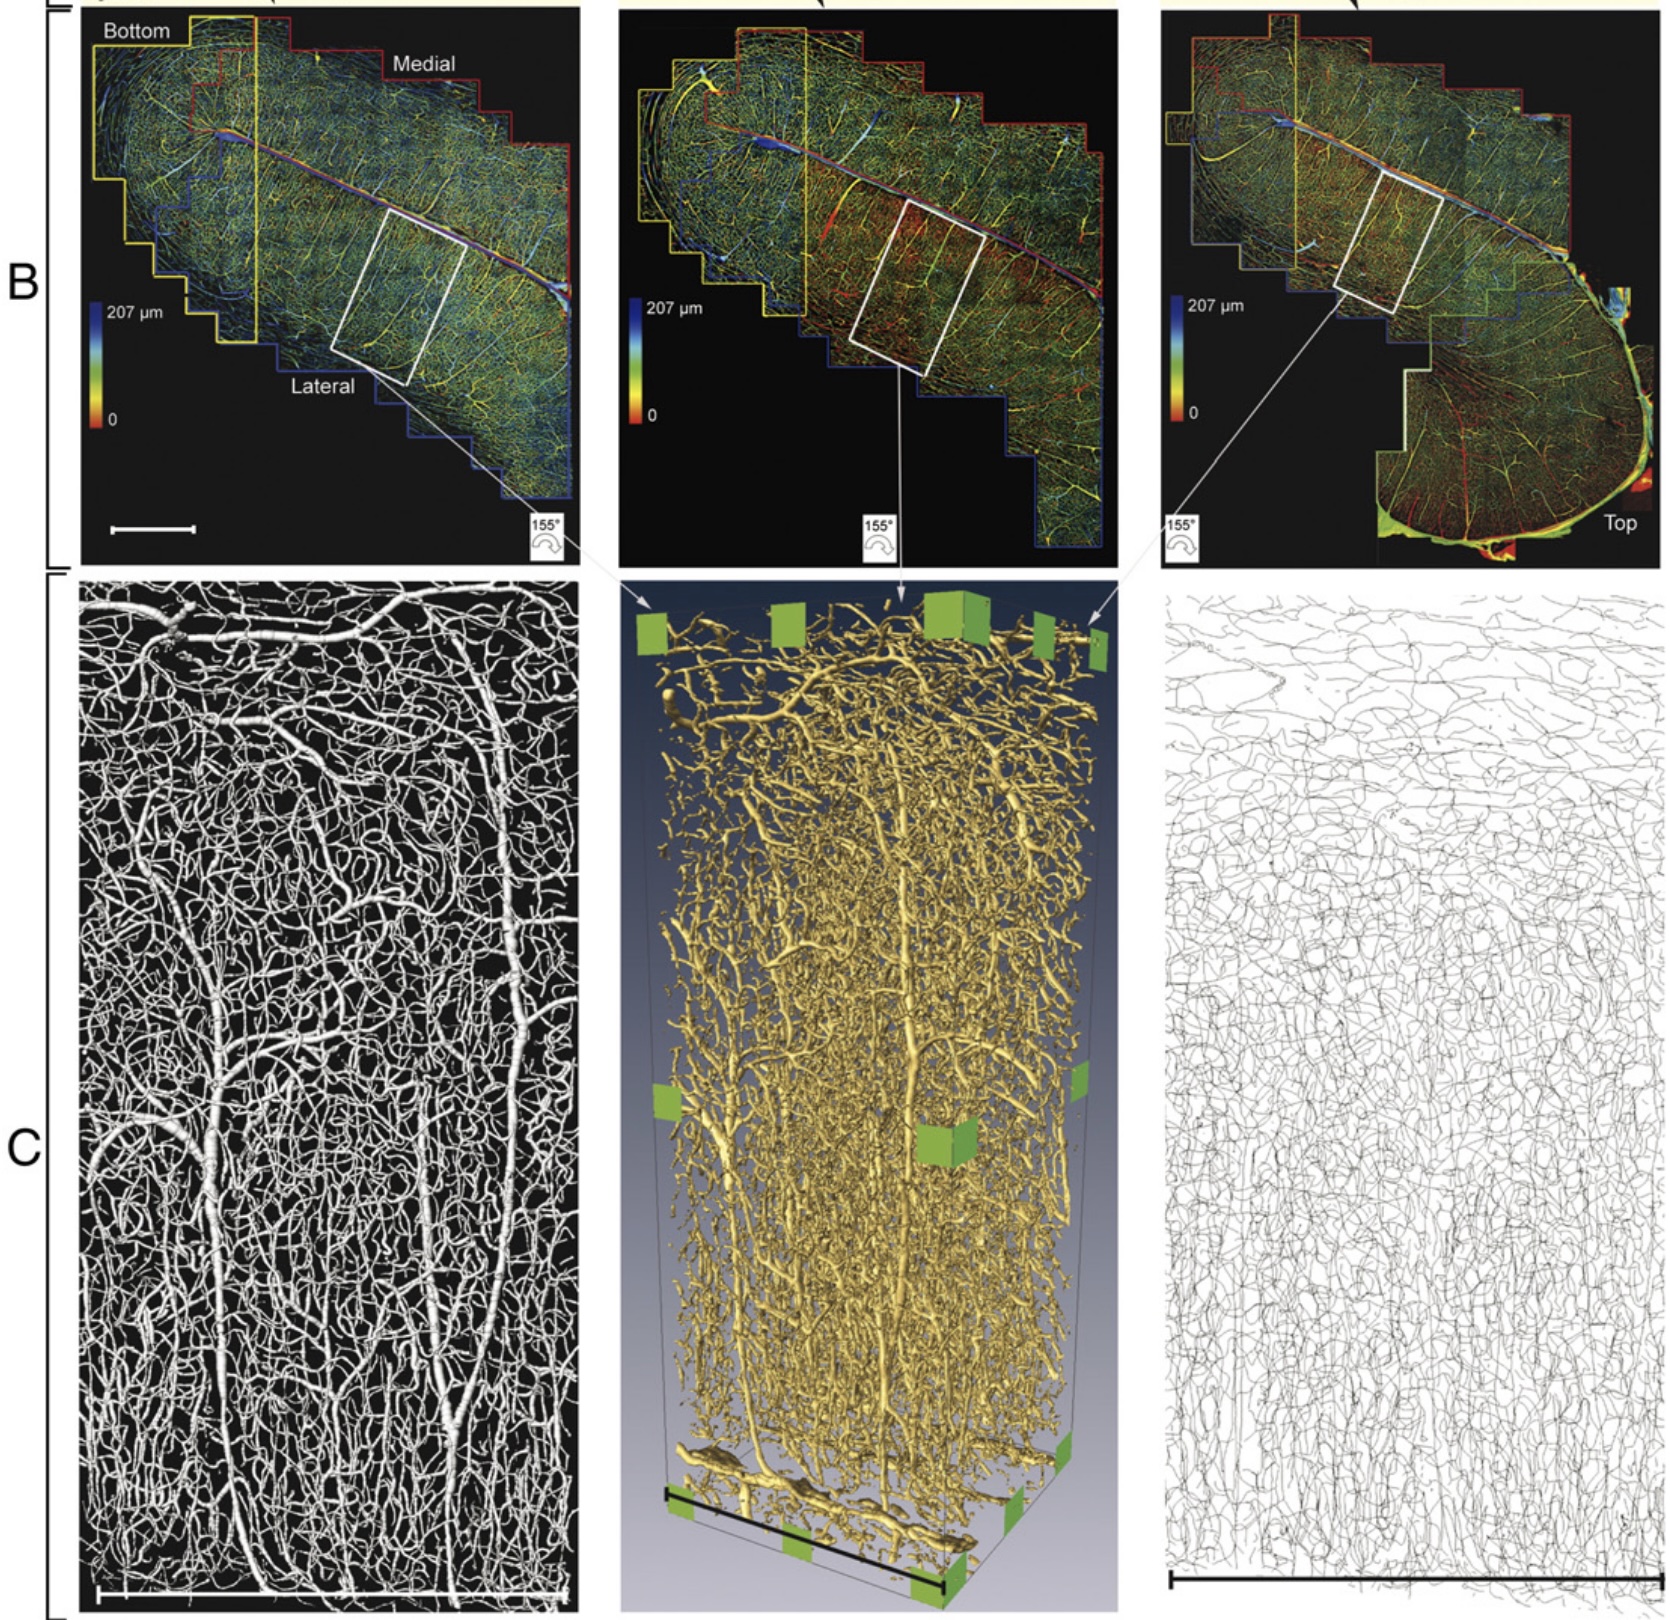
Hildebrand et al., 2025 // FIG 5 // Human occipital lobe meso-vessels. Microscopic 3D imaging, angio- and cytoMASH OTC and staining, 8 × 8 × 8 μm3 voxels. The scale bars are 3 mm.
doi.org/10.1007/s12565-025-00859-w
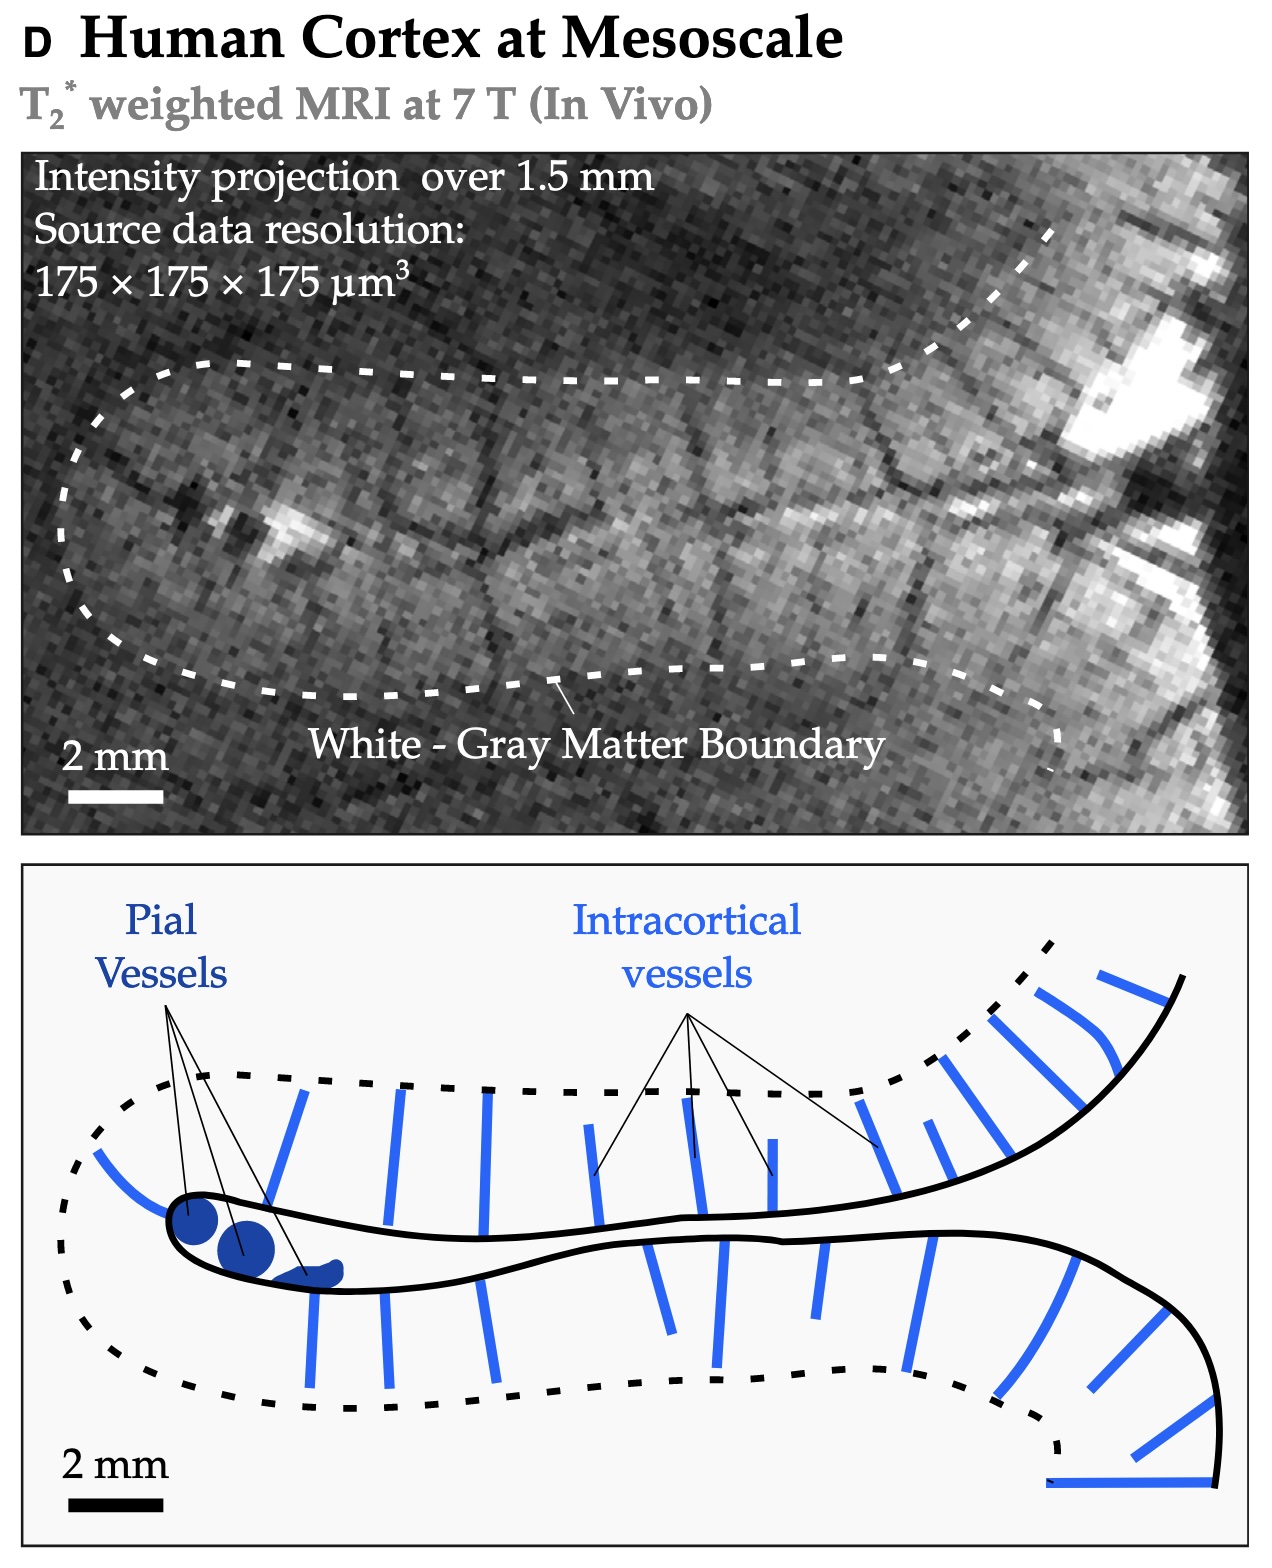
Gulban and Huber 2024 // FIG 12 // Meso-veins are visible at 0.175 mm isotropic voxels. In vivo human MRI.
doi.org/10.1016/B978-0-12-820480-1.00188-1
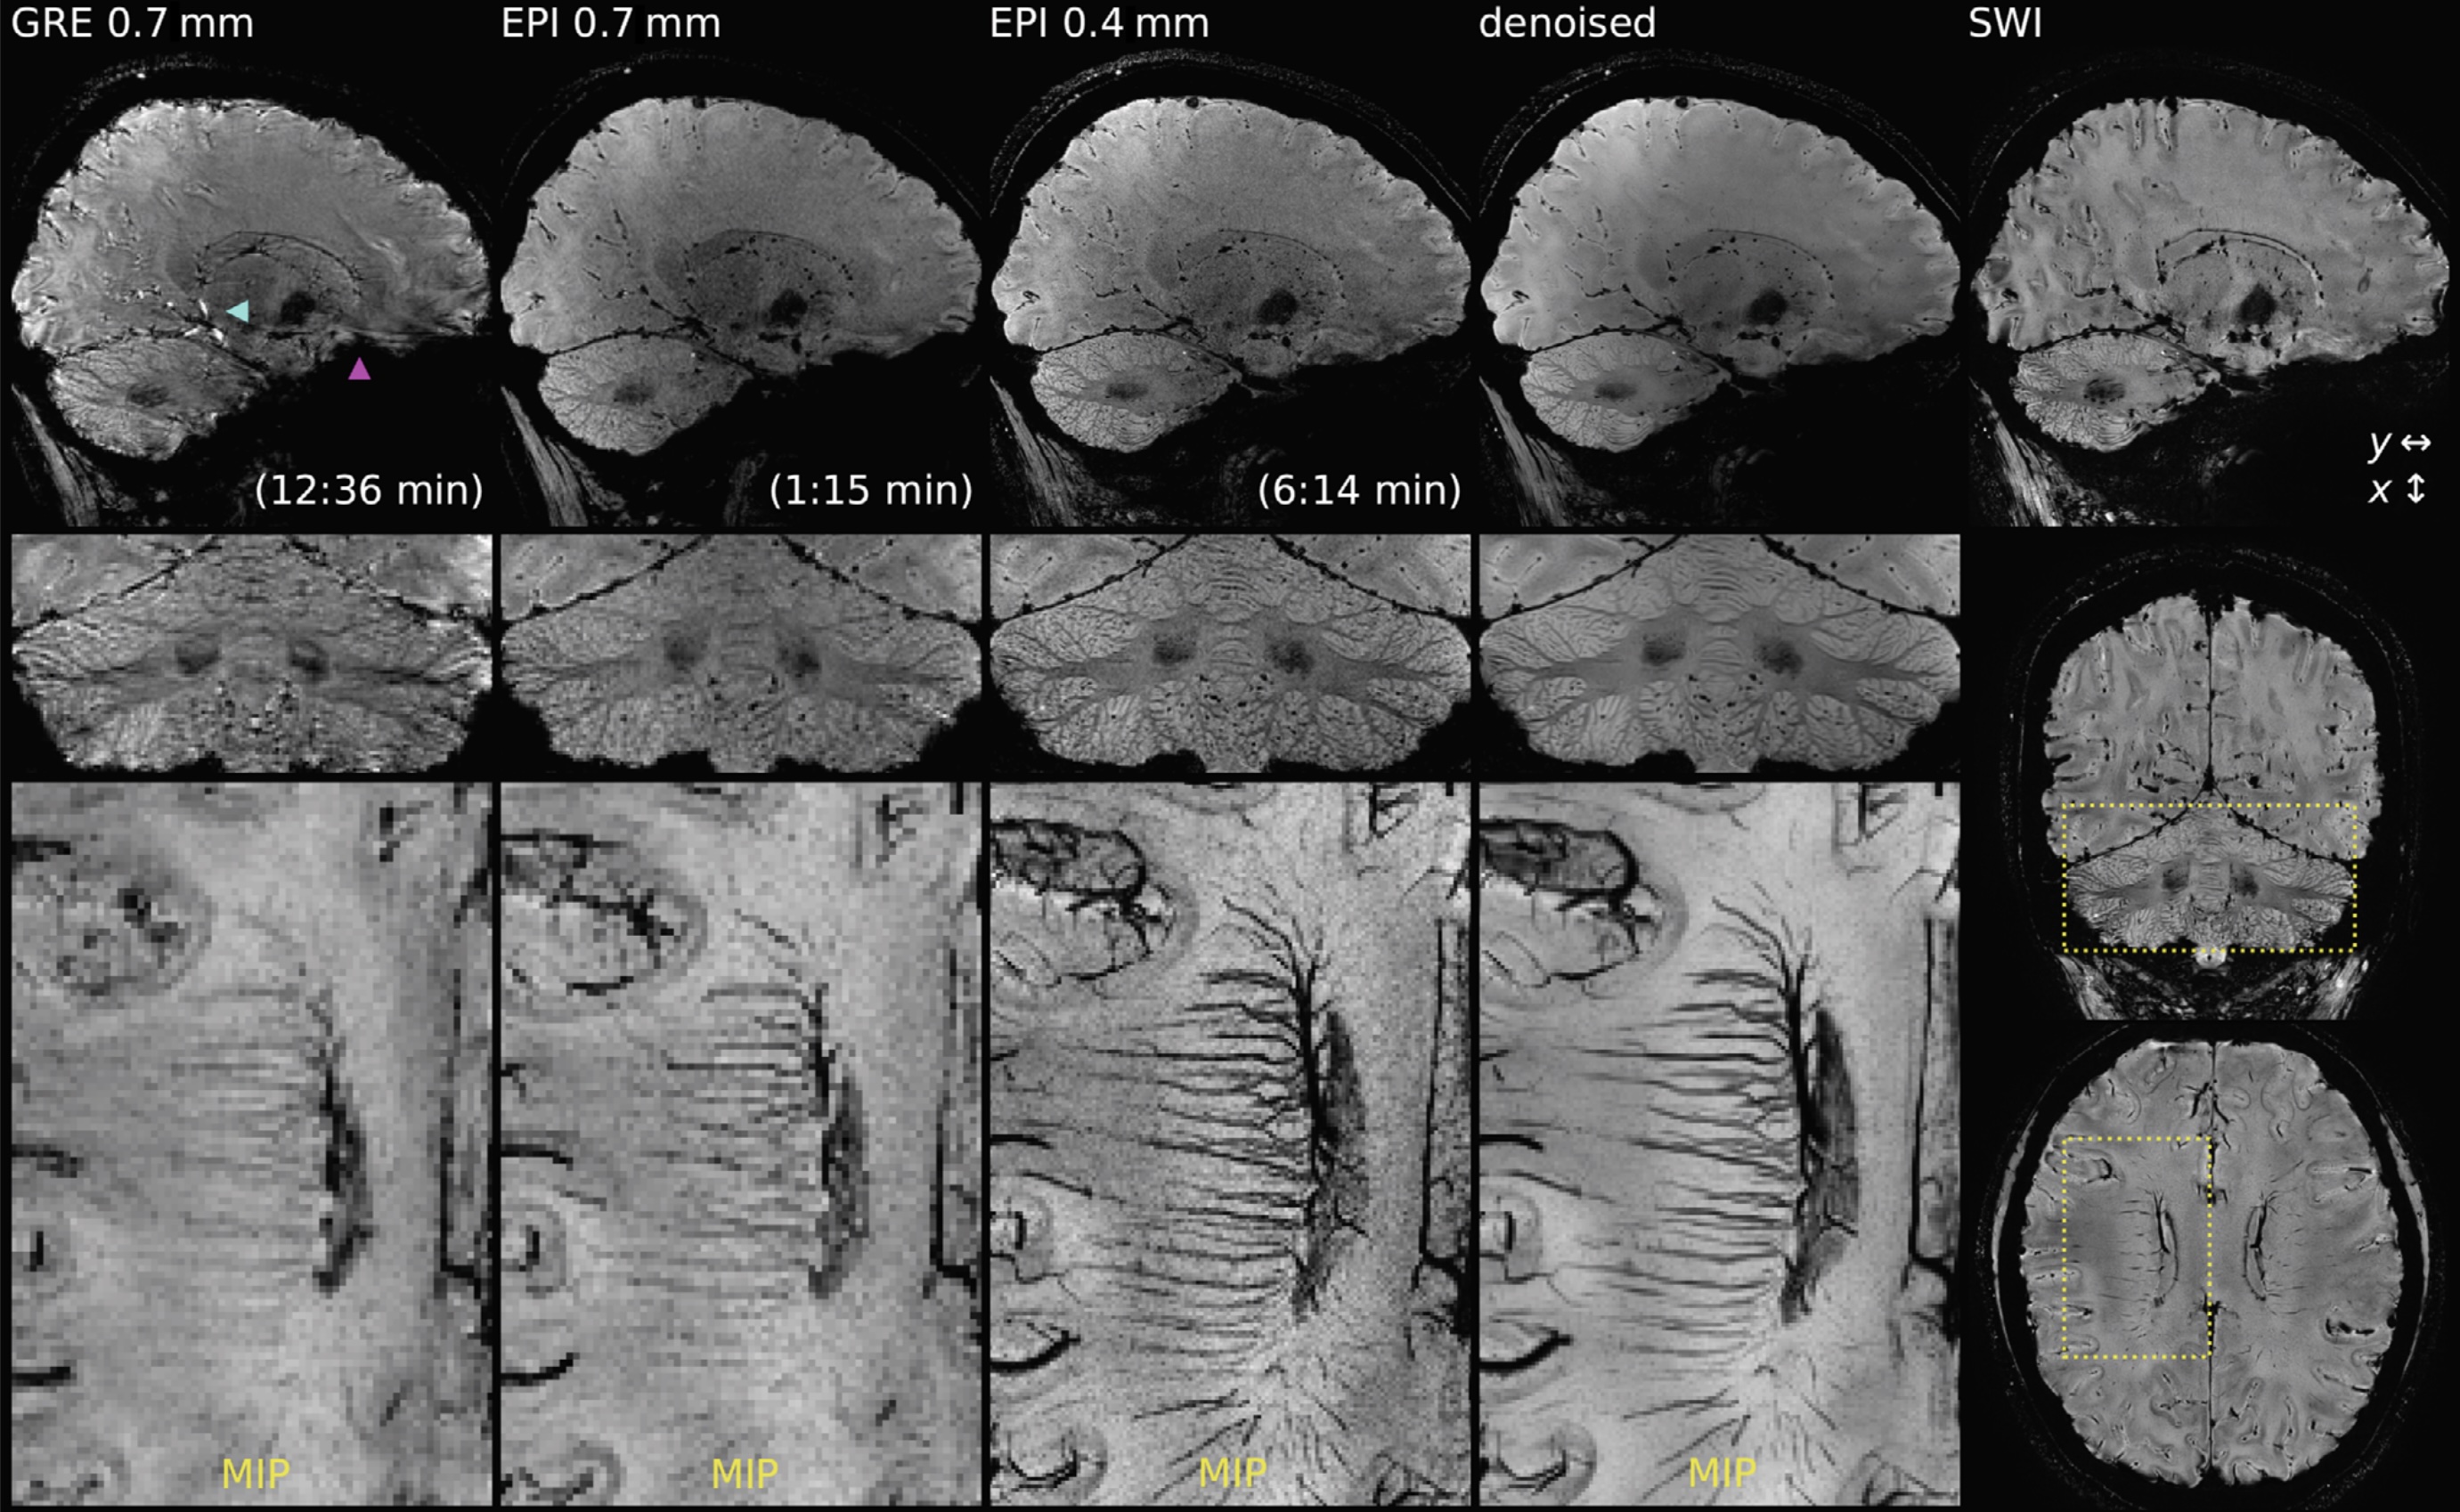
Stirnberg et al., 2024 // FIG 4 // Meso-veins are visible at 0.4 mm isotropic voxels. In vivo human MRI.
doi.org/10.1002/mrm.30216
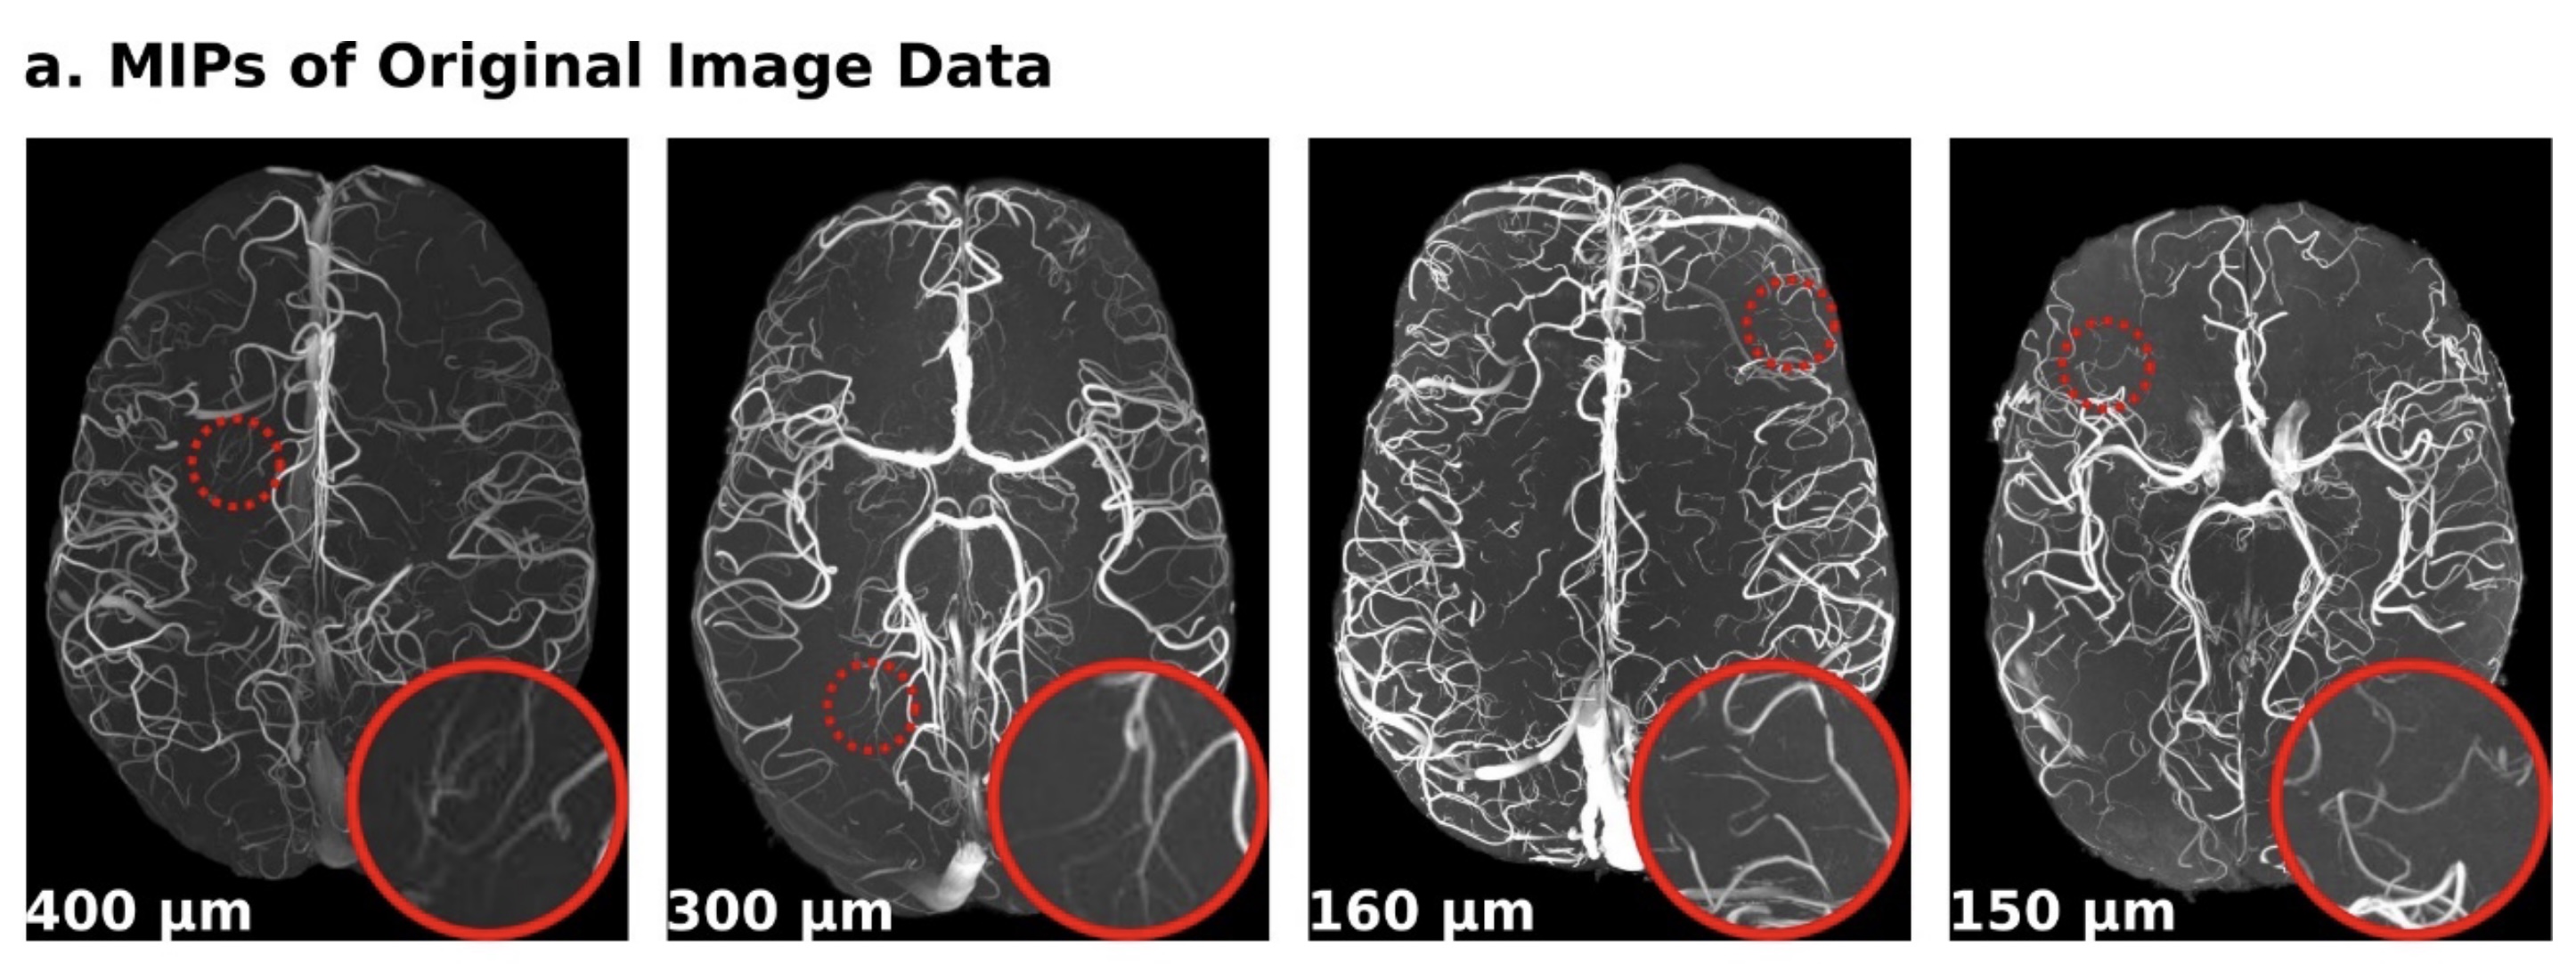
Xu et al., 2024 // FIG 3 // Visibility of meso-arteries across individuals and resolutions. In vivo human MRI, time-of-flight contrast.
doi.org/10.52294/001c.123217
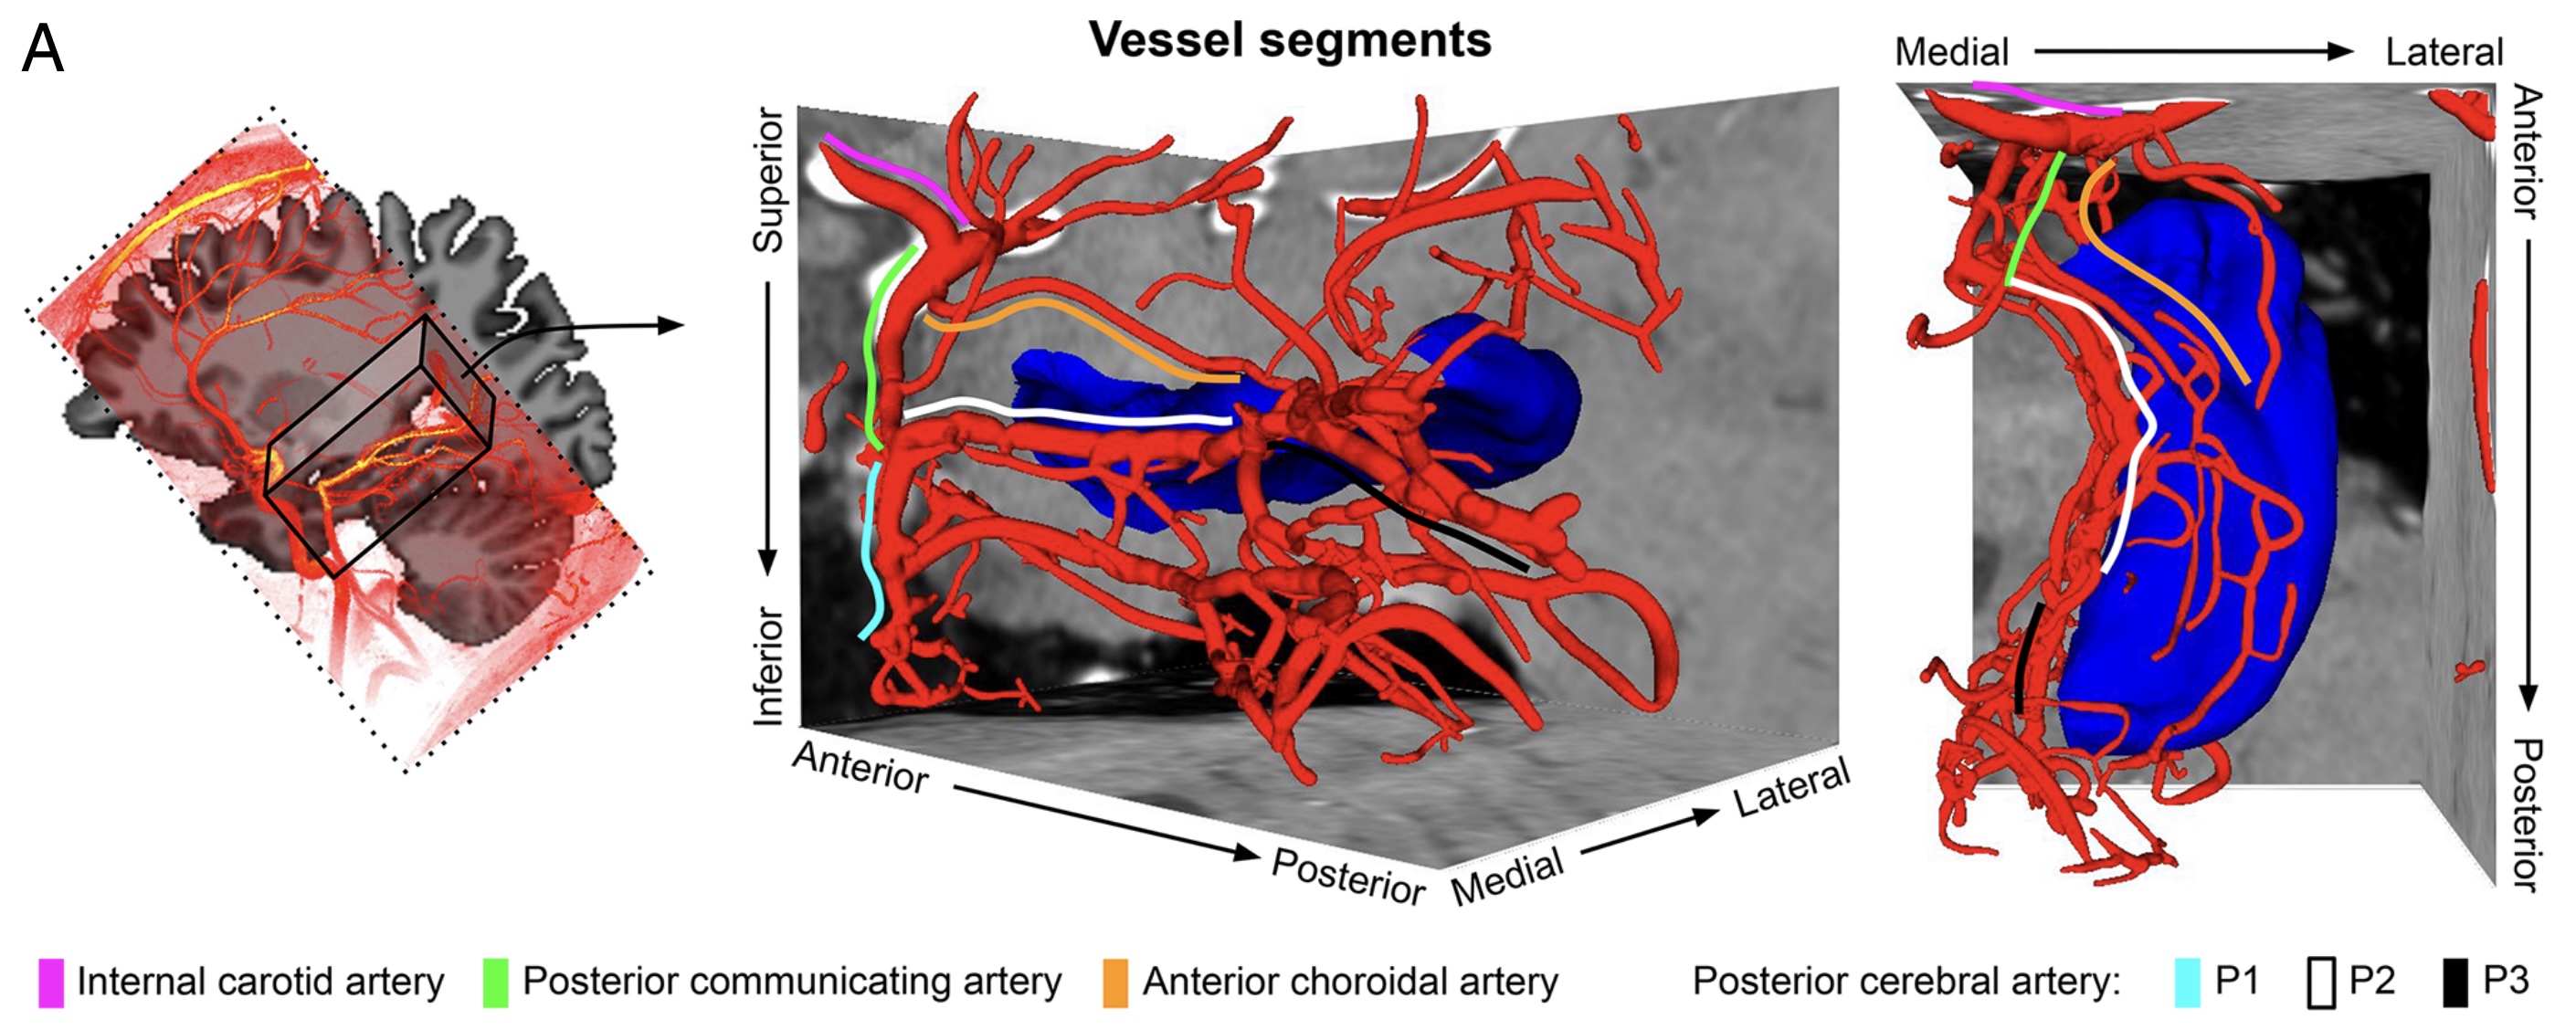
Haast & Kashyap et al., 2024 // FIG 3 // Human hippocampal macro and meso-arteries. In vivo human MRI, arteries are segmented based on time-of-flight contrast at 0.3 mm isotropic voxels.
doi.org/10.1073/pnas.2310044121
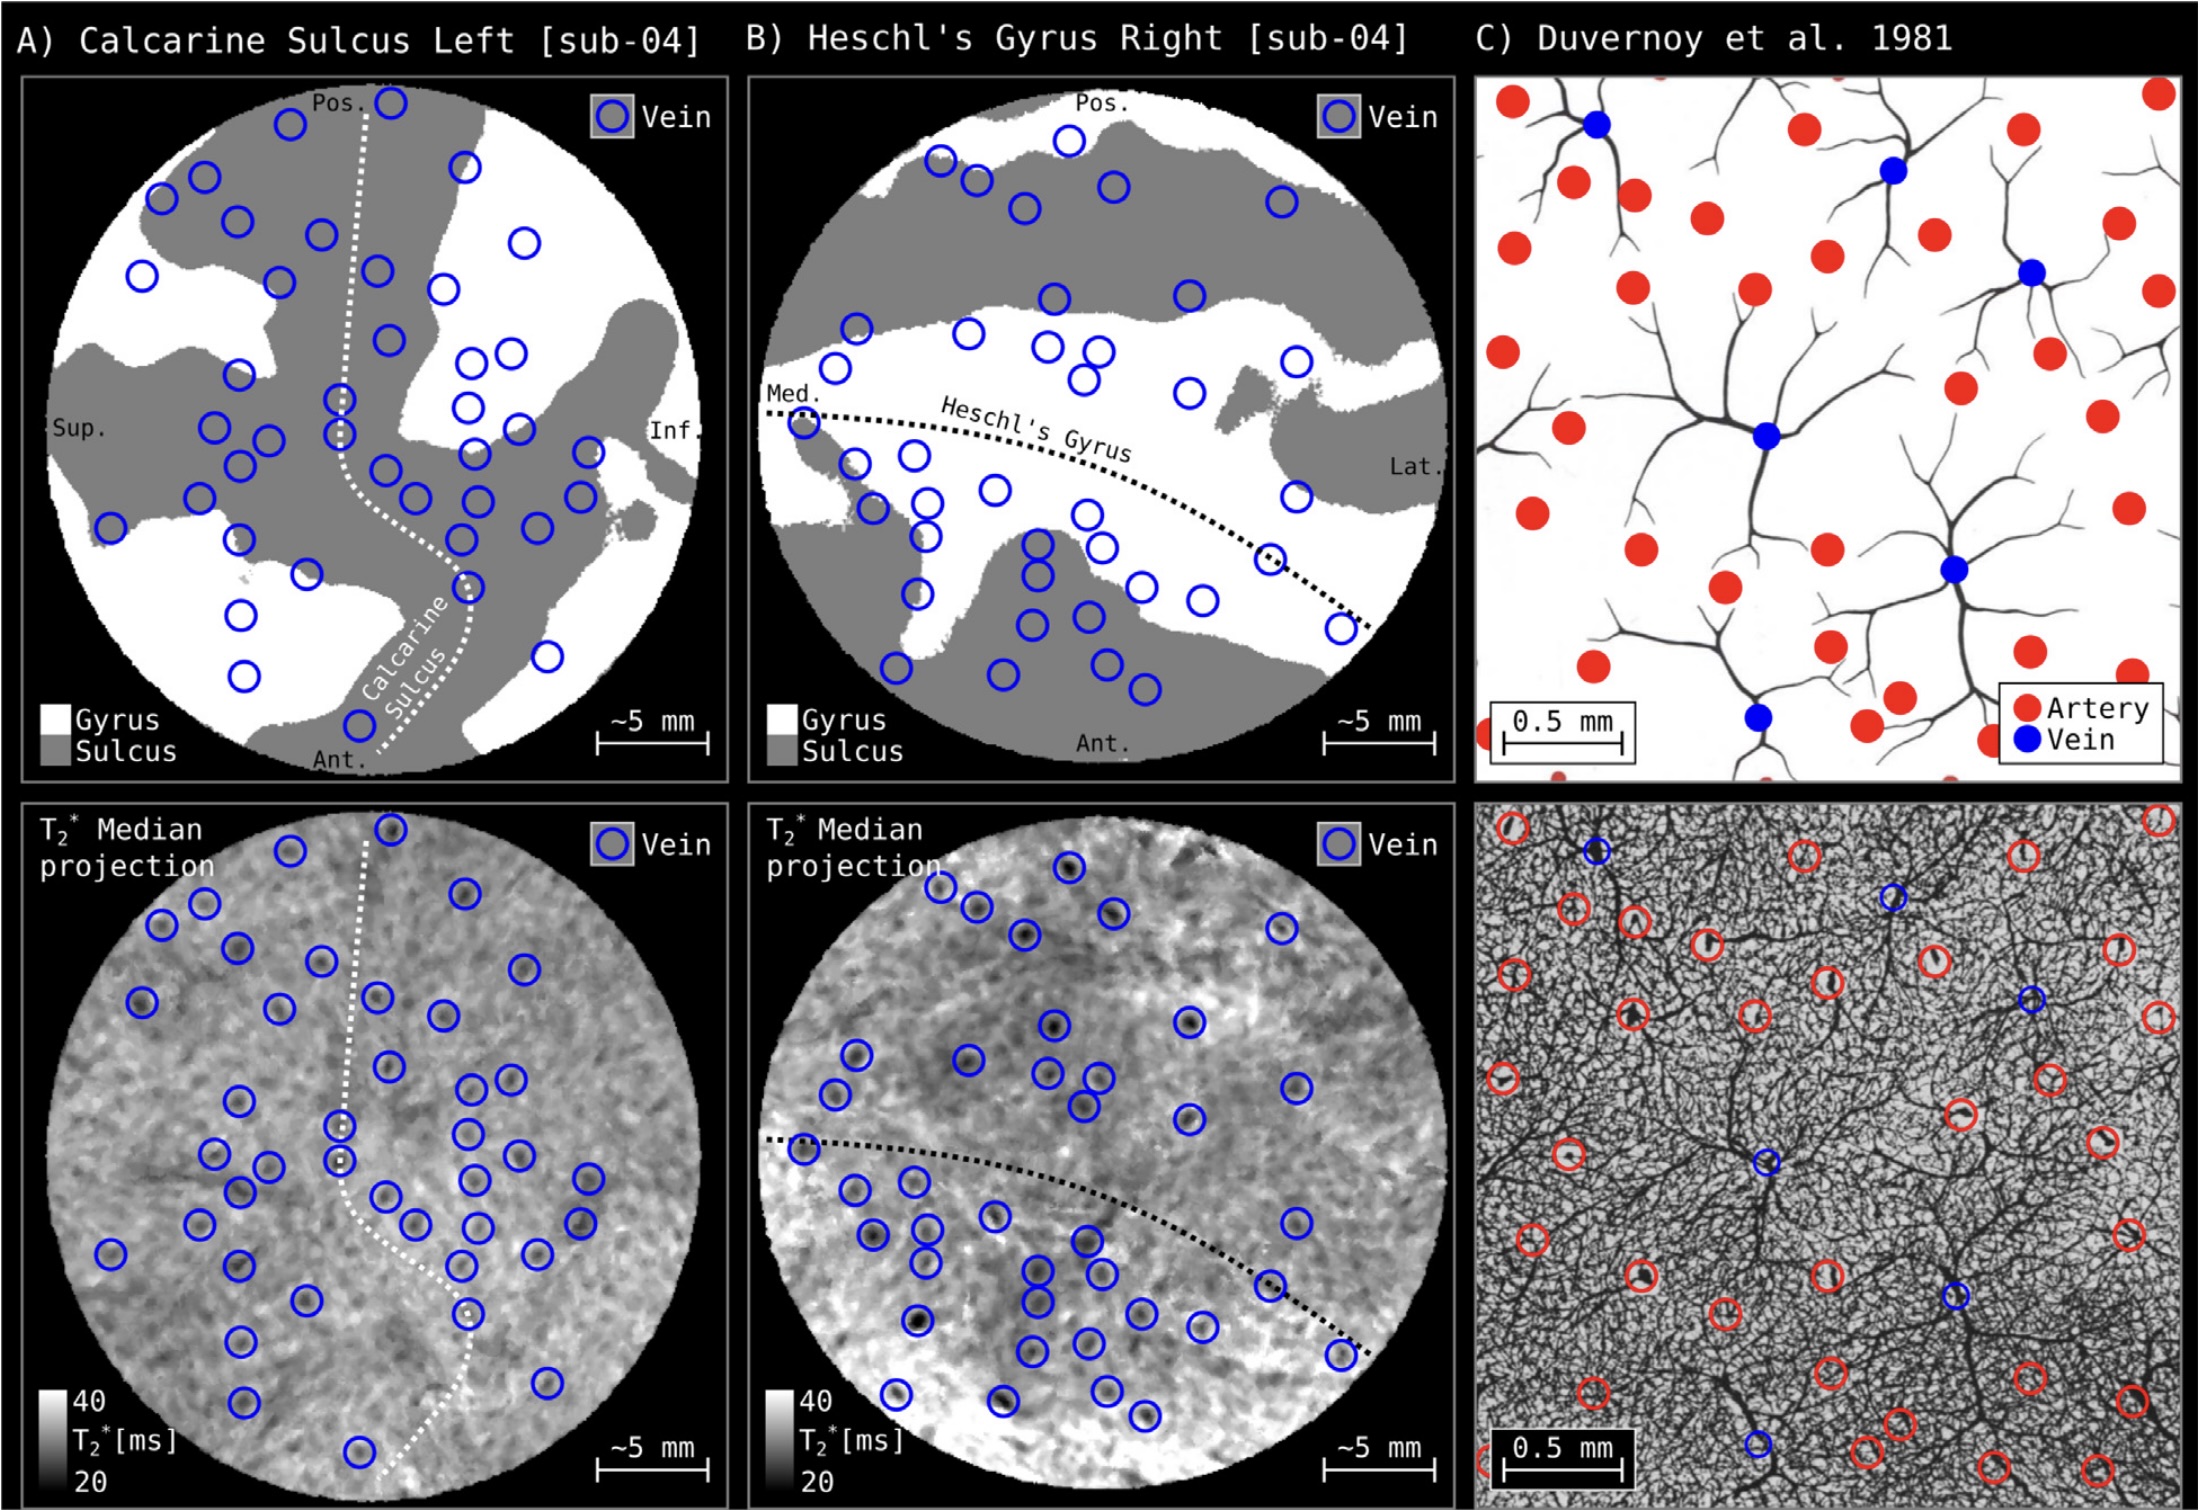
Gulban et al., 2022 // FIG 4 // In vivo intracortical veins are visible as dots on virtually flattened patches of cortex. Human MRI data at 0.35 mm isotropic resolution is compared to Duvernoy's photograph of the meso-vessels from 1981.
doi.org/10.1016/j.neuroimage.2022.119733
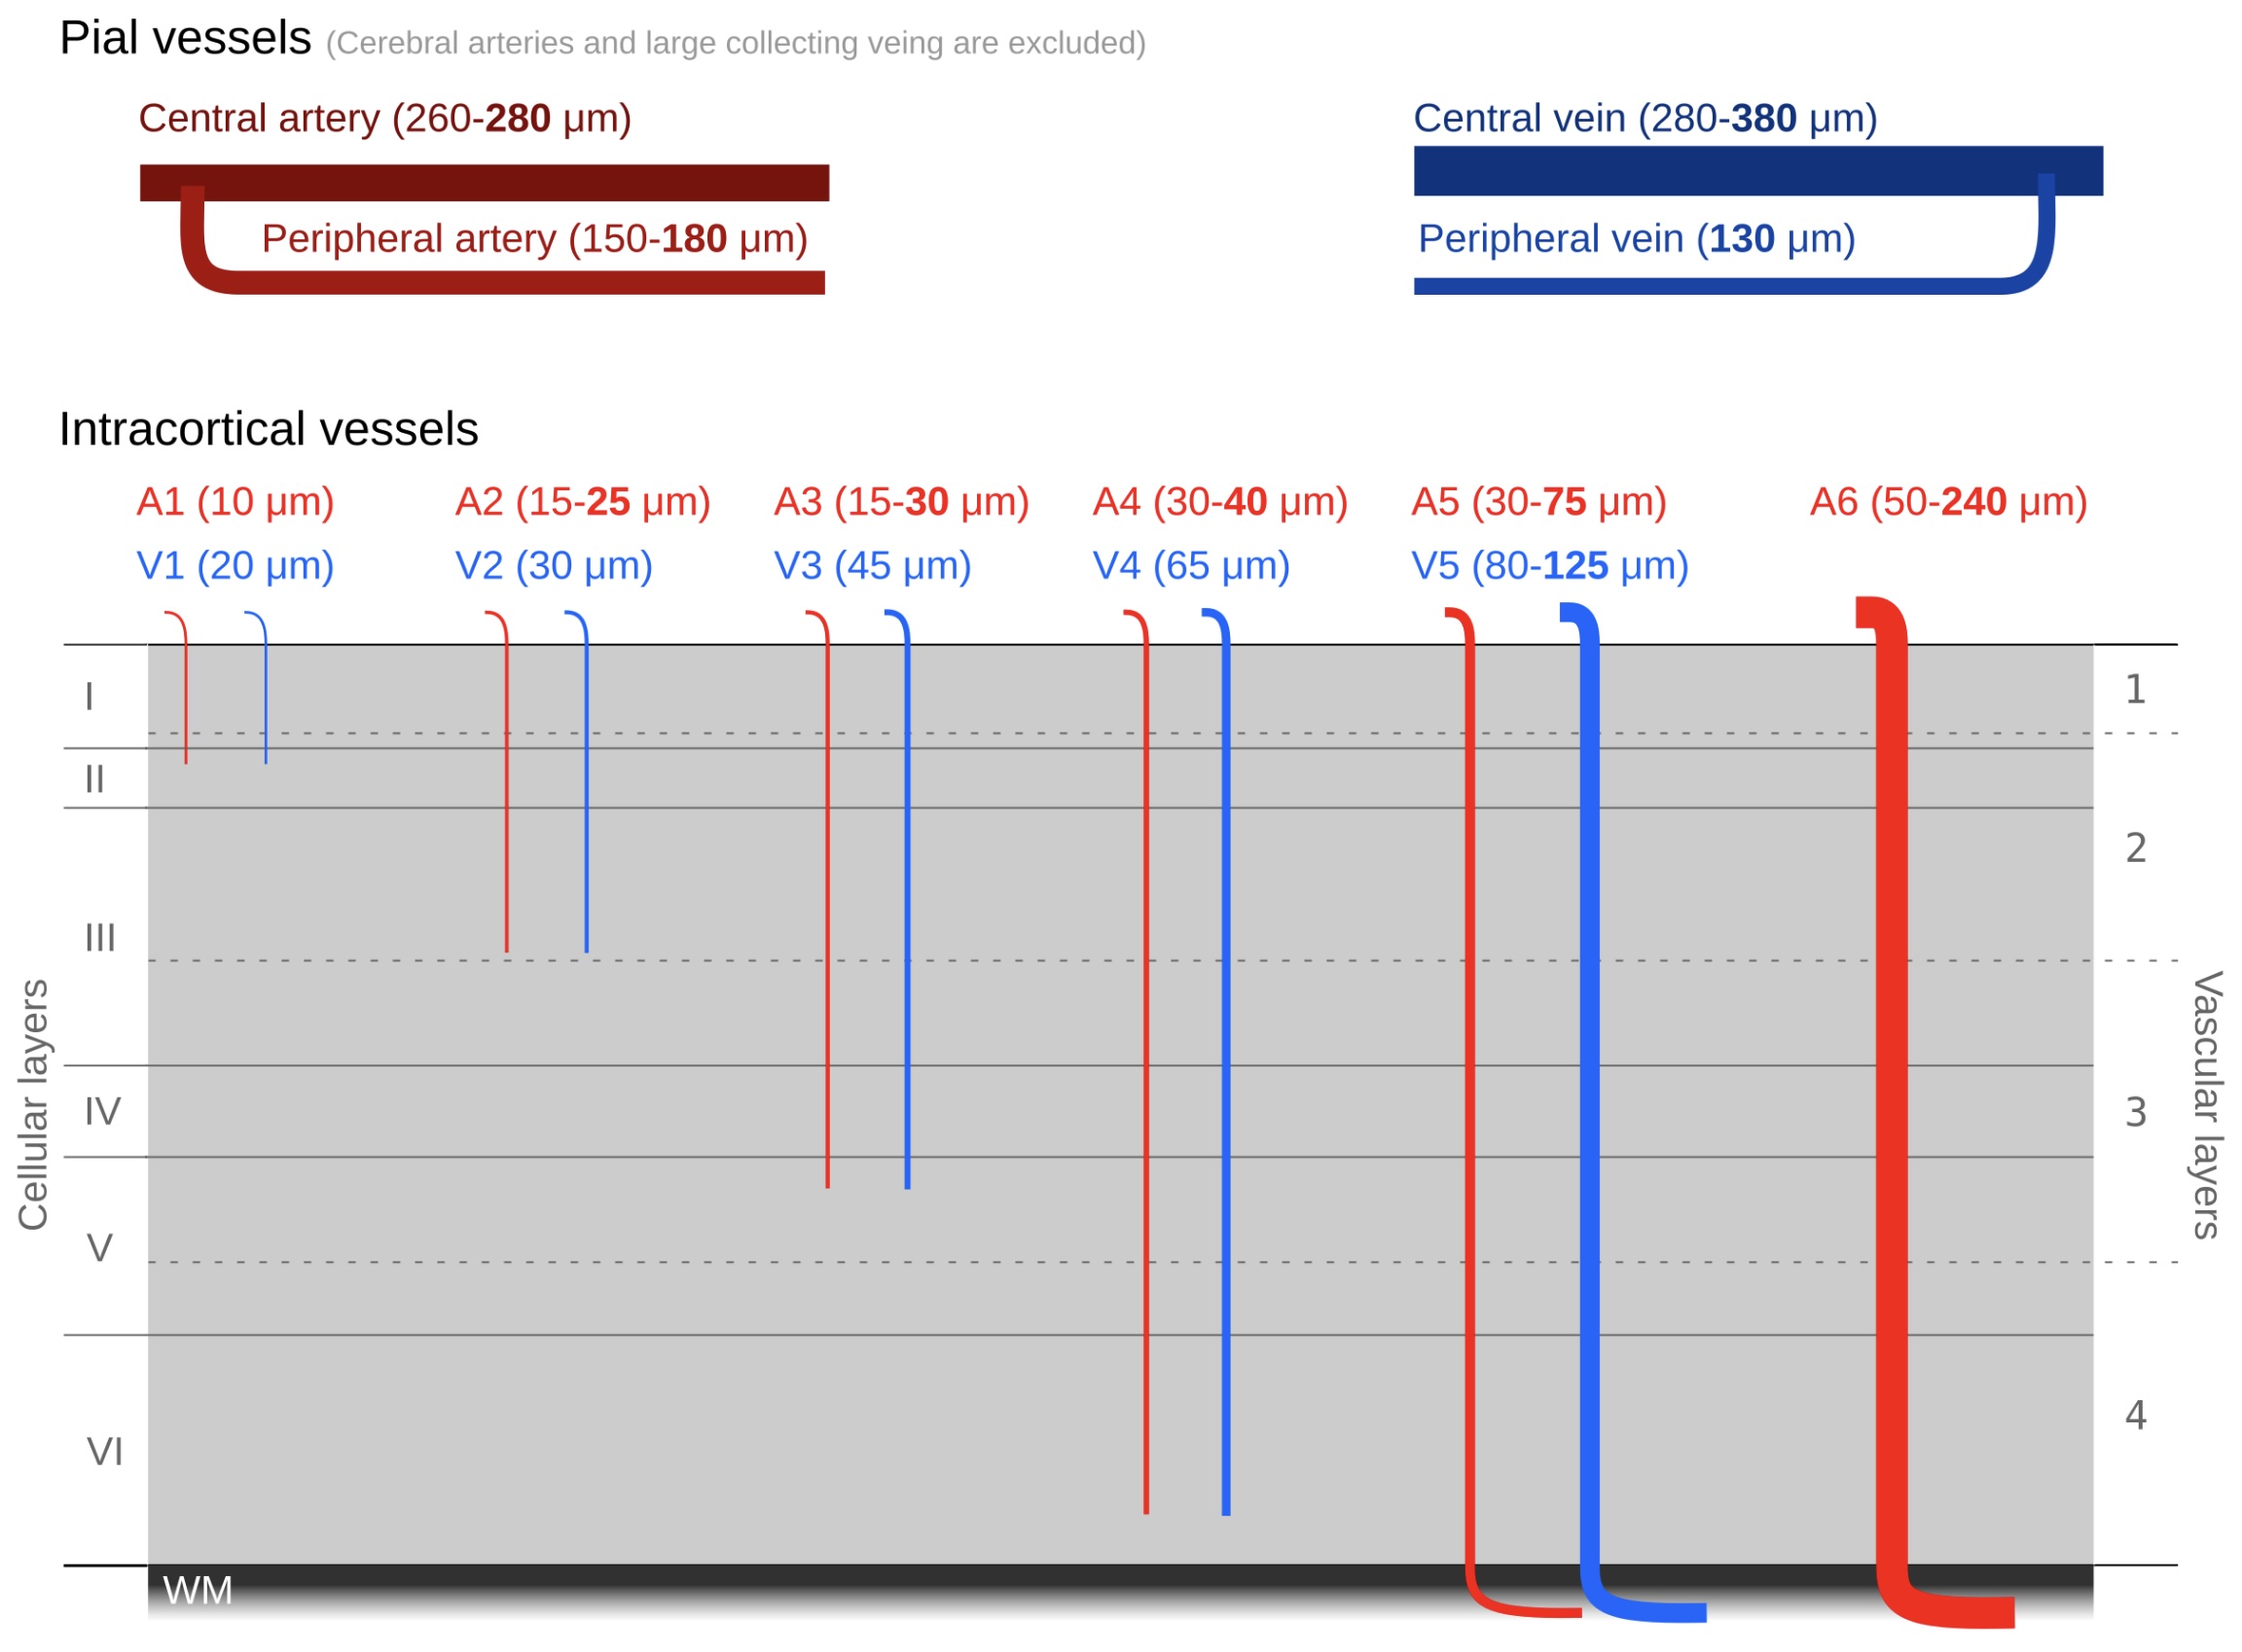
Gulban et al., 2022 // FIG S9 // Schematic representation of cortical vessel trunks based on Duvernoy, Delon, and Vannson, 1981. The vessel diameters reported here are known to be imprecise measurements. As Duvernoy states, "The diameter of cortical arteries is difficult to evaluate; the results of measurements are debatable and are a function of the pressure of injection and modifications caused by the fixation."; and "Fixation and embedding often greatly deform veins, due to the thinness of their walls; thus, diameter measurements taken after India ink injection are of little value and are often lower than those obtained with vascular casts.".
doi.org/10.1016/j.neuroimage.2022.119733
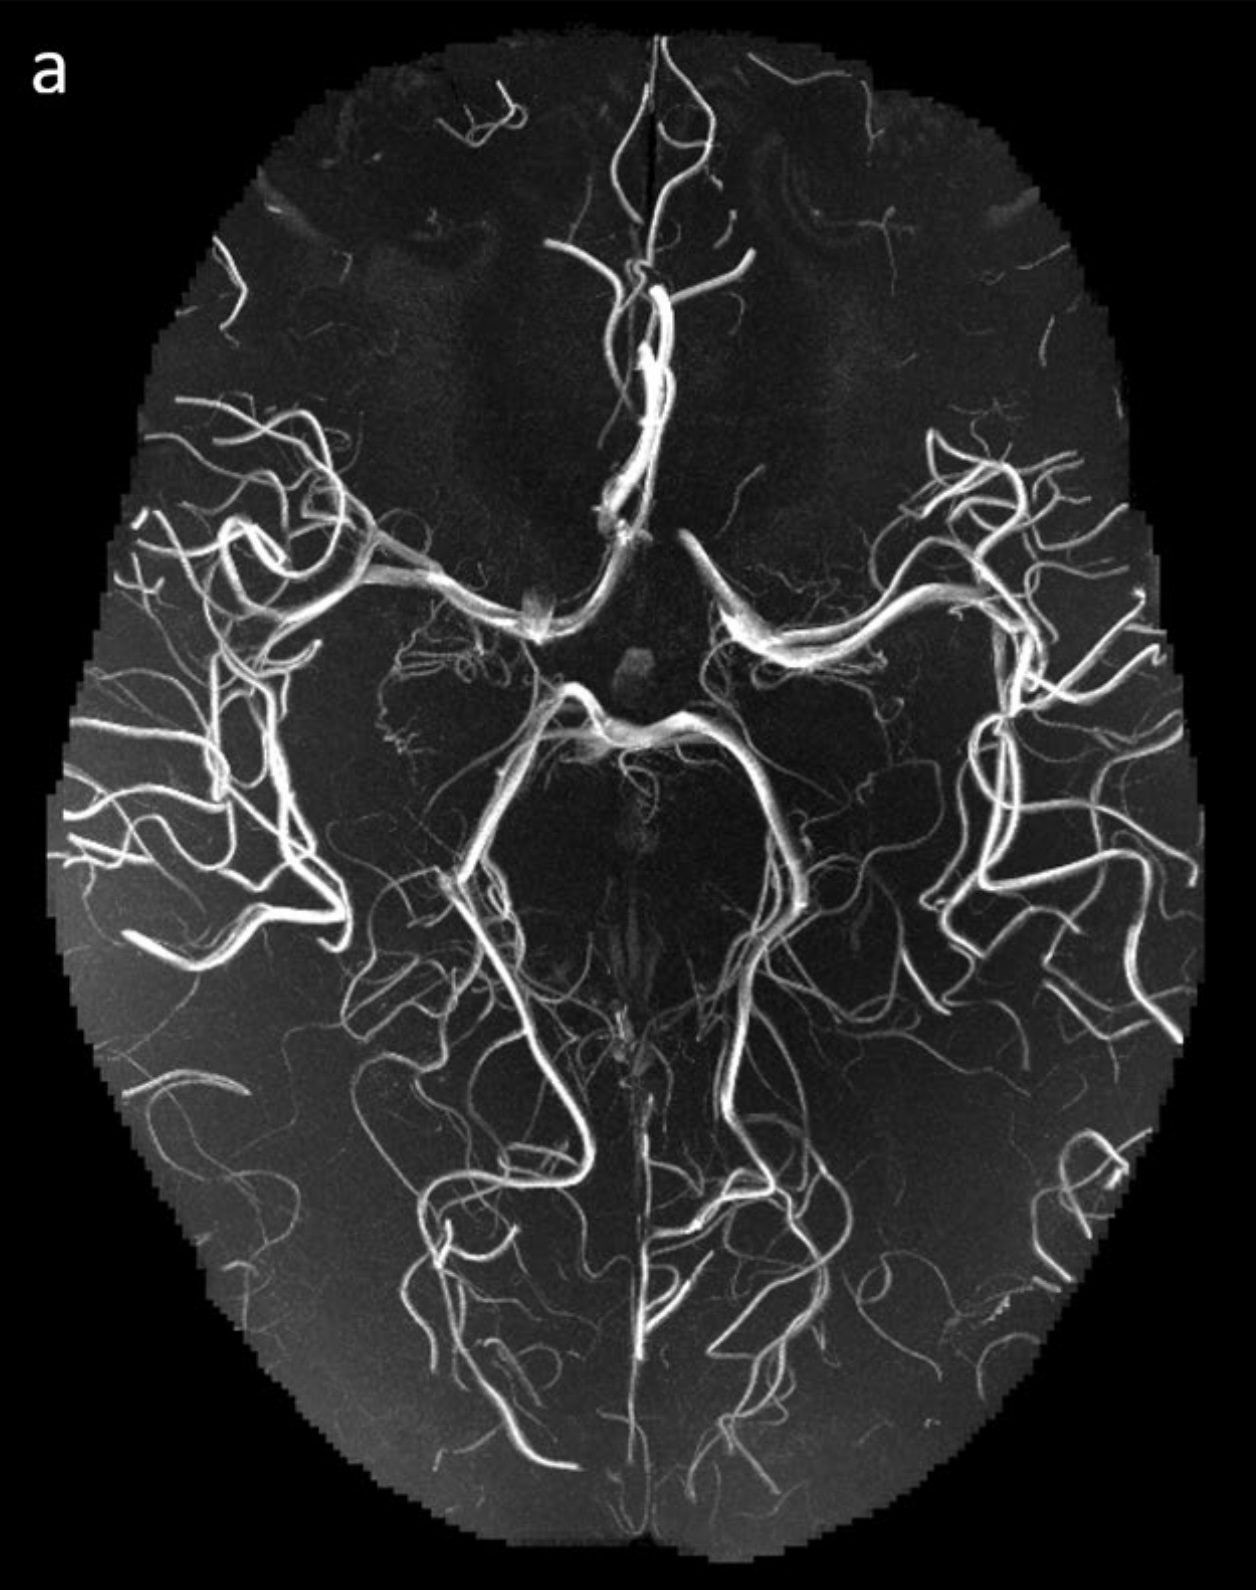
Lüsebrink et al., 2021 // FIG 3 // Human brain arteries visualized using time-of-flight imaging at 0.15 mm isotropic resolution with maximum intensity projection over 200 slices. In vivo MRI.
doi.org/10.1038/s41597-021-00923-w
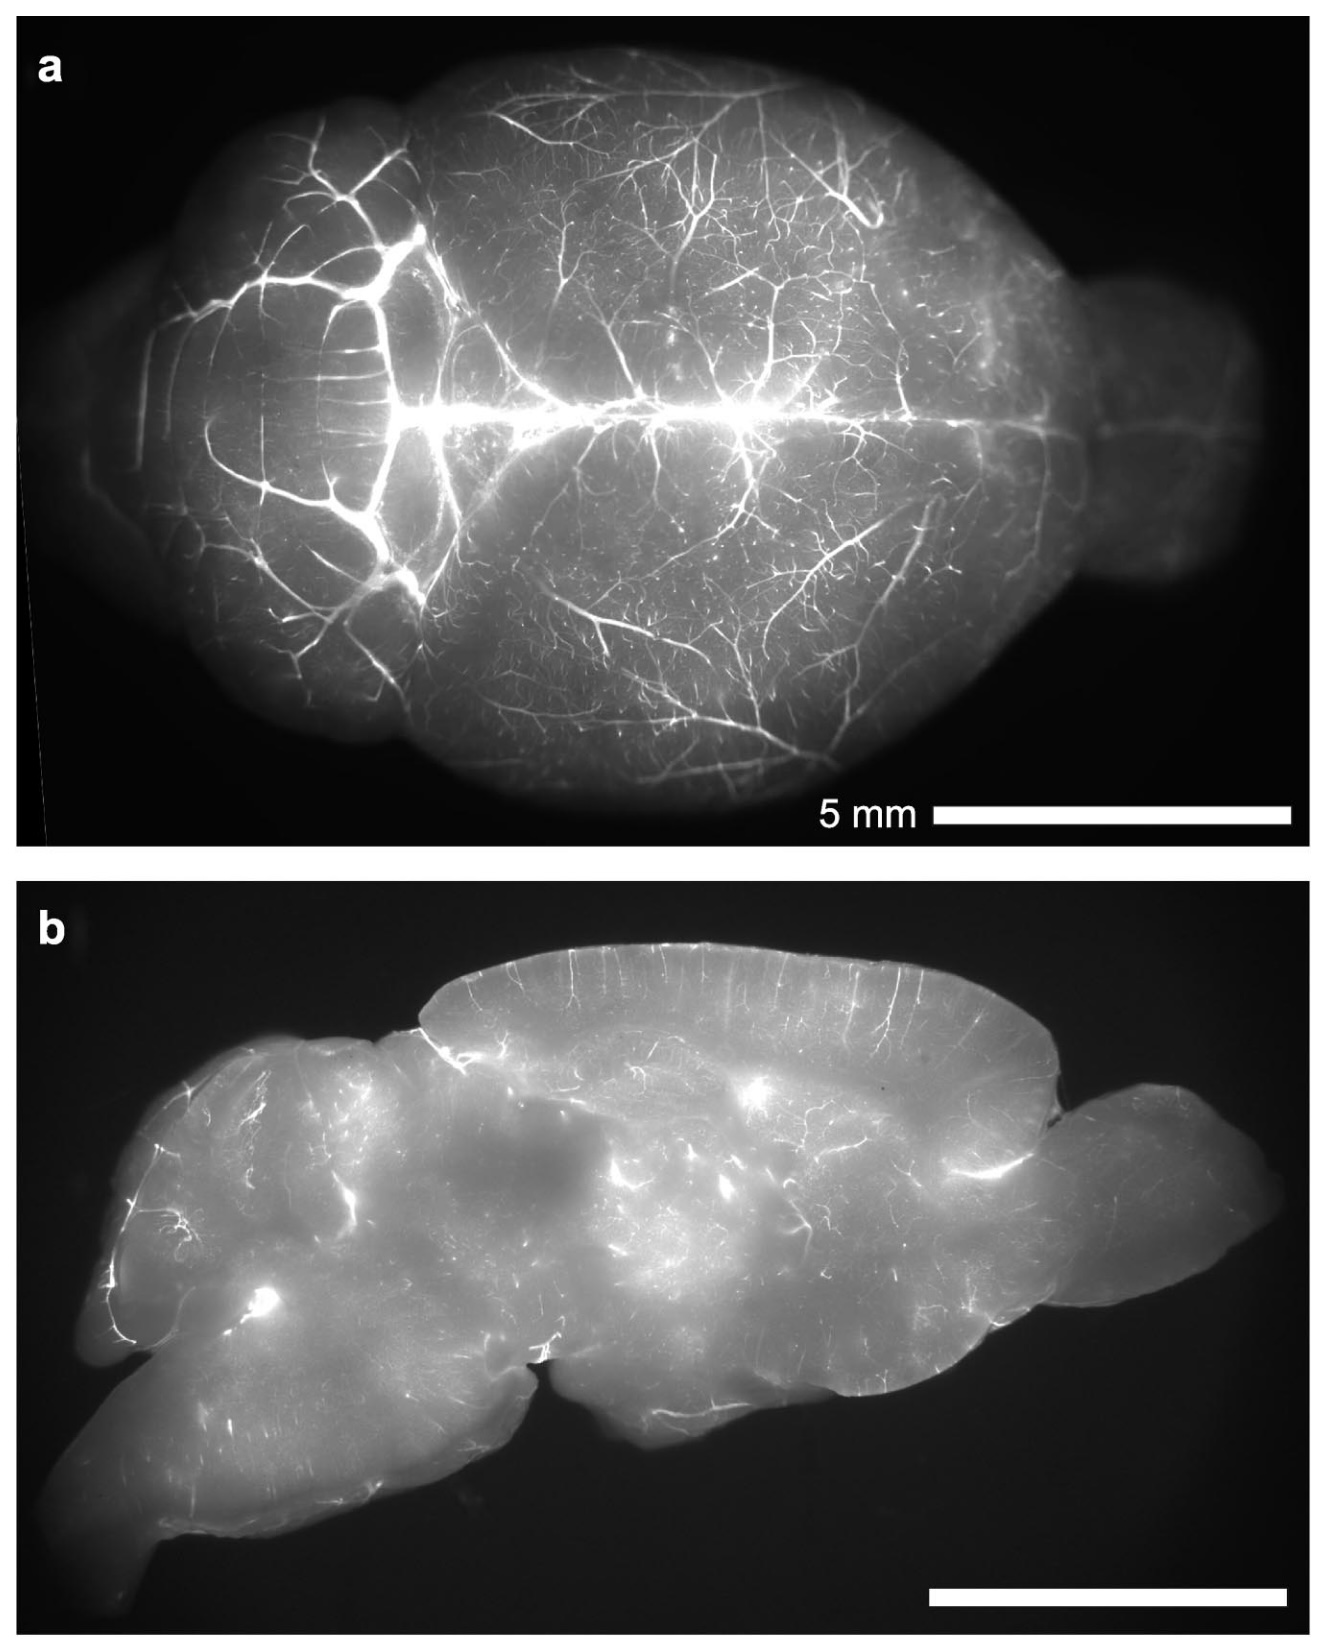
Ji et al., 2021 // FIG 1 // Mouse brain vessels filled with fluorescent gel. Photomicrograph.
doi.org/10.1016/j.neuron.2021.02.006
Ji et al., 2021 // FIG 1 // Mouse meso-vessels are visible on maximum intensity projection image of a 100 mm thick slab.
doi.org/10.1016/j.neuron.2021.02.006
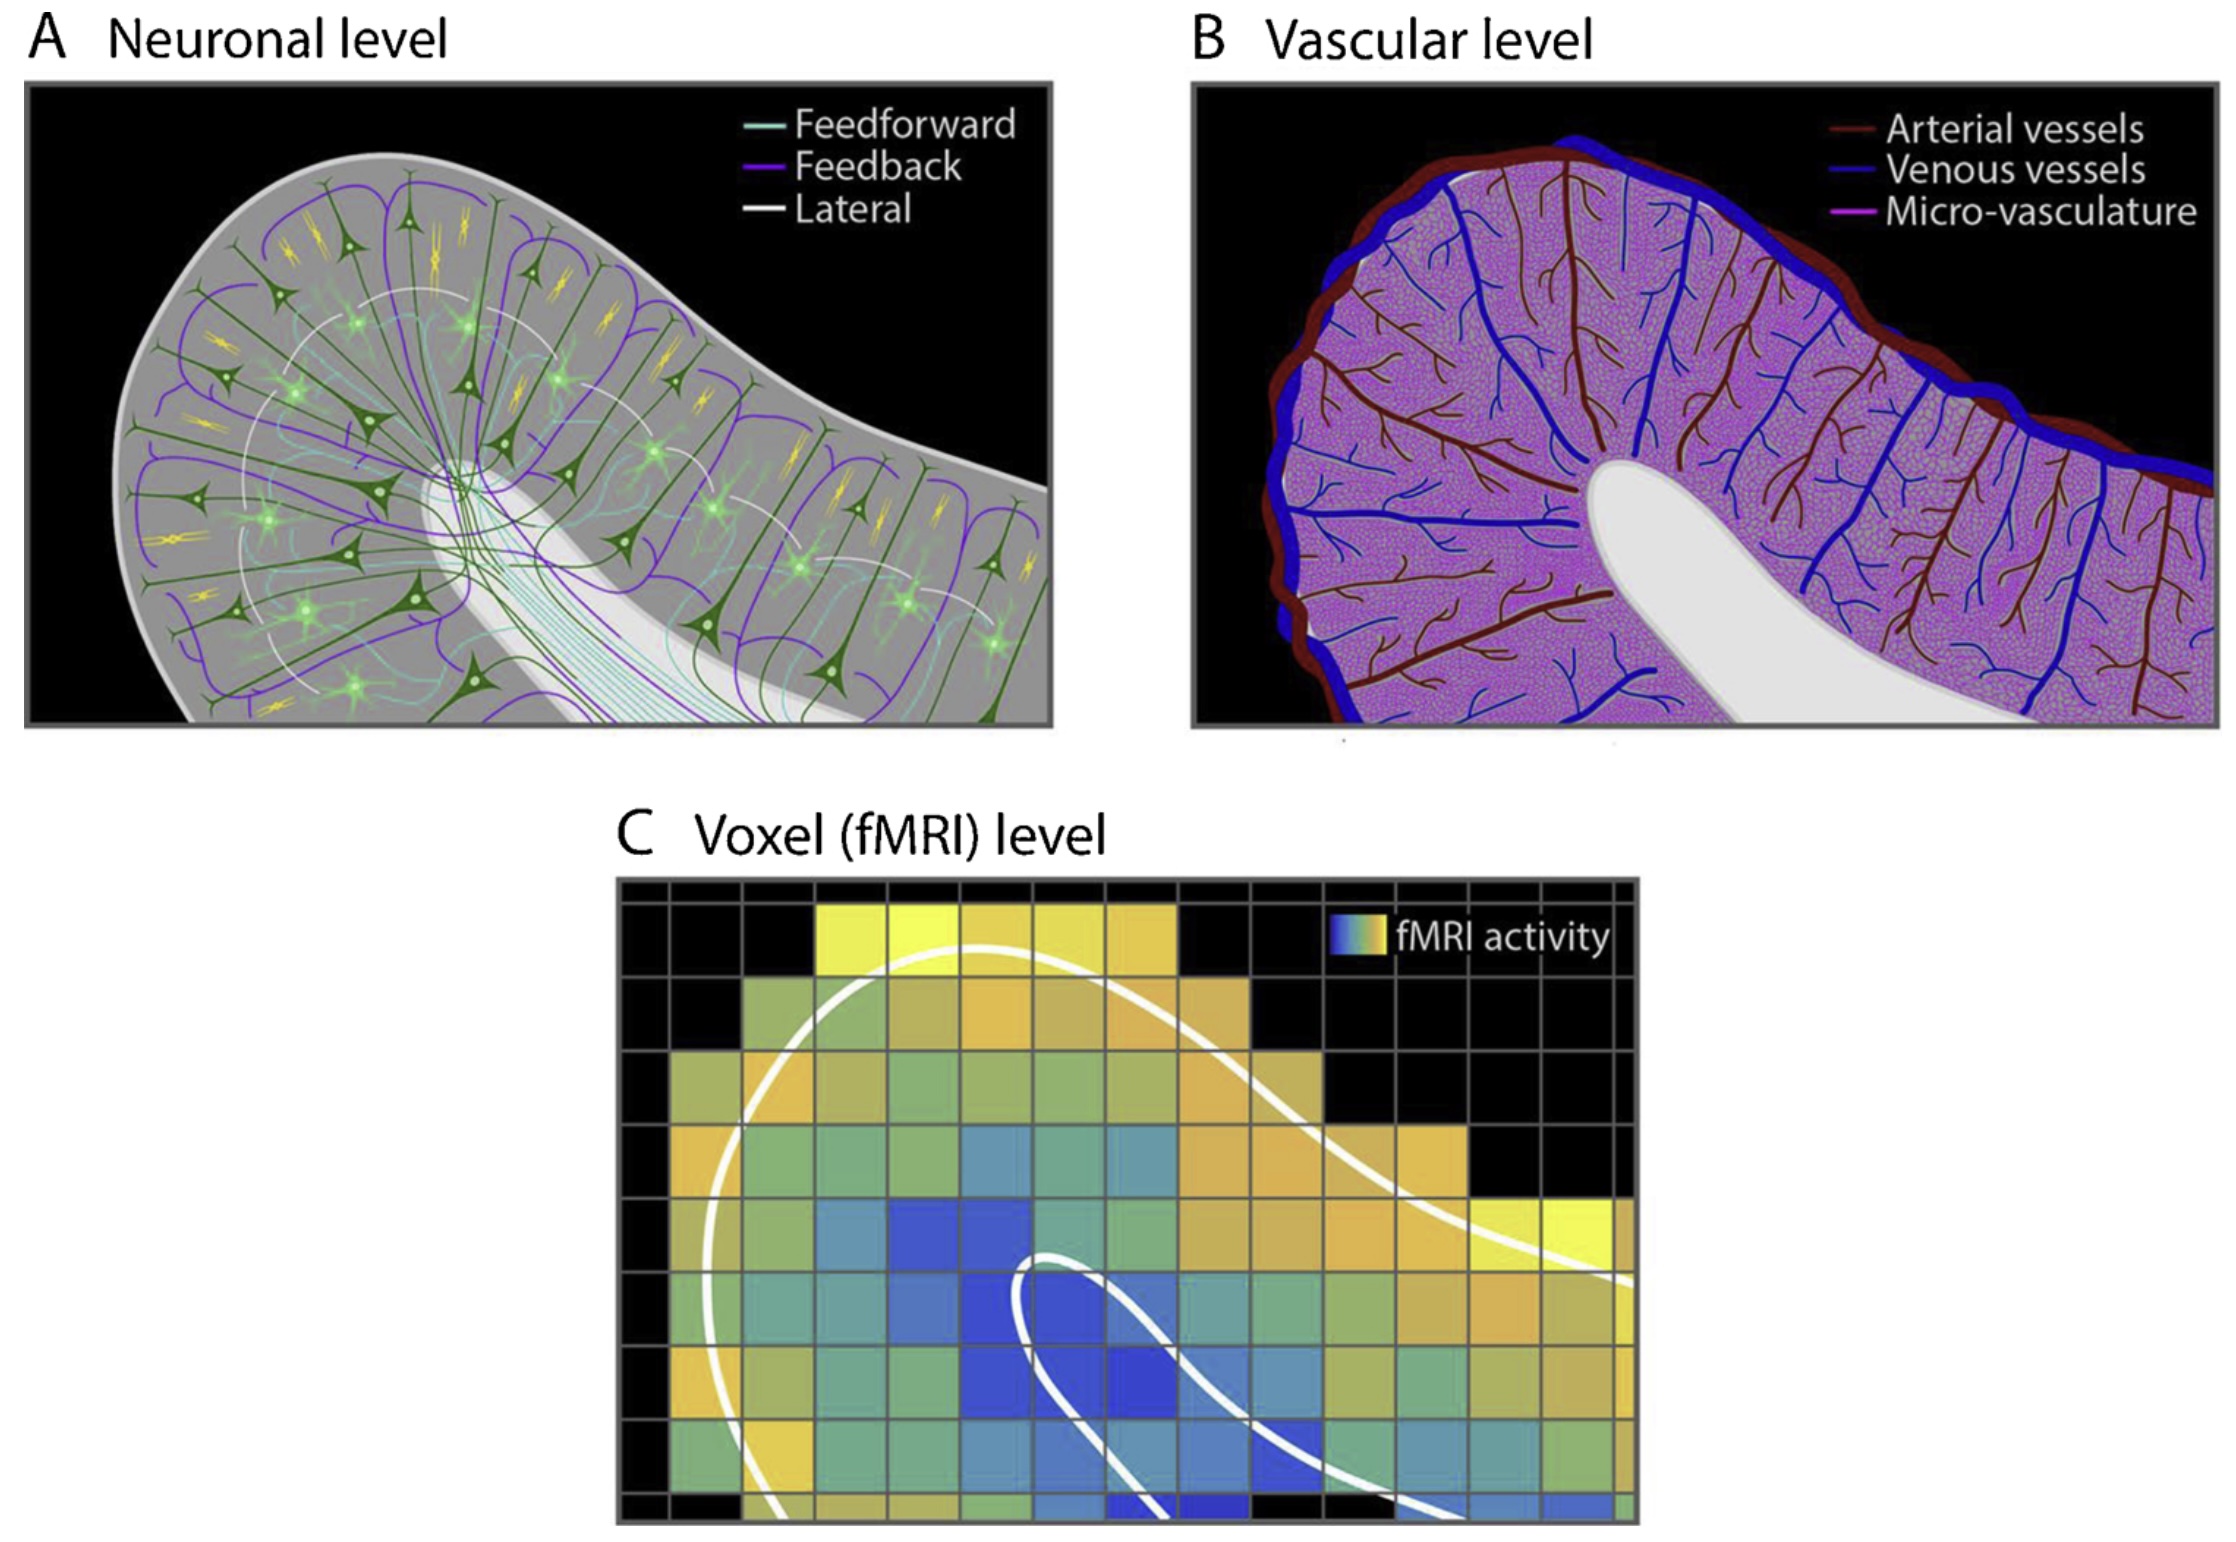
Uludag, Havlicek, 2021 // FIG 1 // Illustration of the vascular effects of the layer-fMRI signal. The activity of neuronal activity causes changes in flow, volume and oxygenation in all vascular compartments via neurovascular coupling. The blood oxygenation and volume changes of the meso-veins (blue, orthogonally oriented relative to the cortical surface) strongly influence gradient echo fMRI signal.
doi.org/10.1016/j.pneurobio.2021.102055
Gulban et al., 2020 // FIG 5.4 // Superior temporal cortex pial and leptomeningeal vessels captured using 0.7 mm isotropic MRI in living humans.
doi.org/10.26481/dis.20201006og
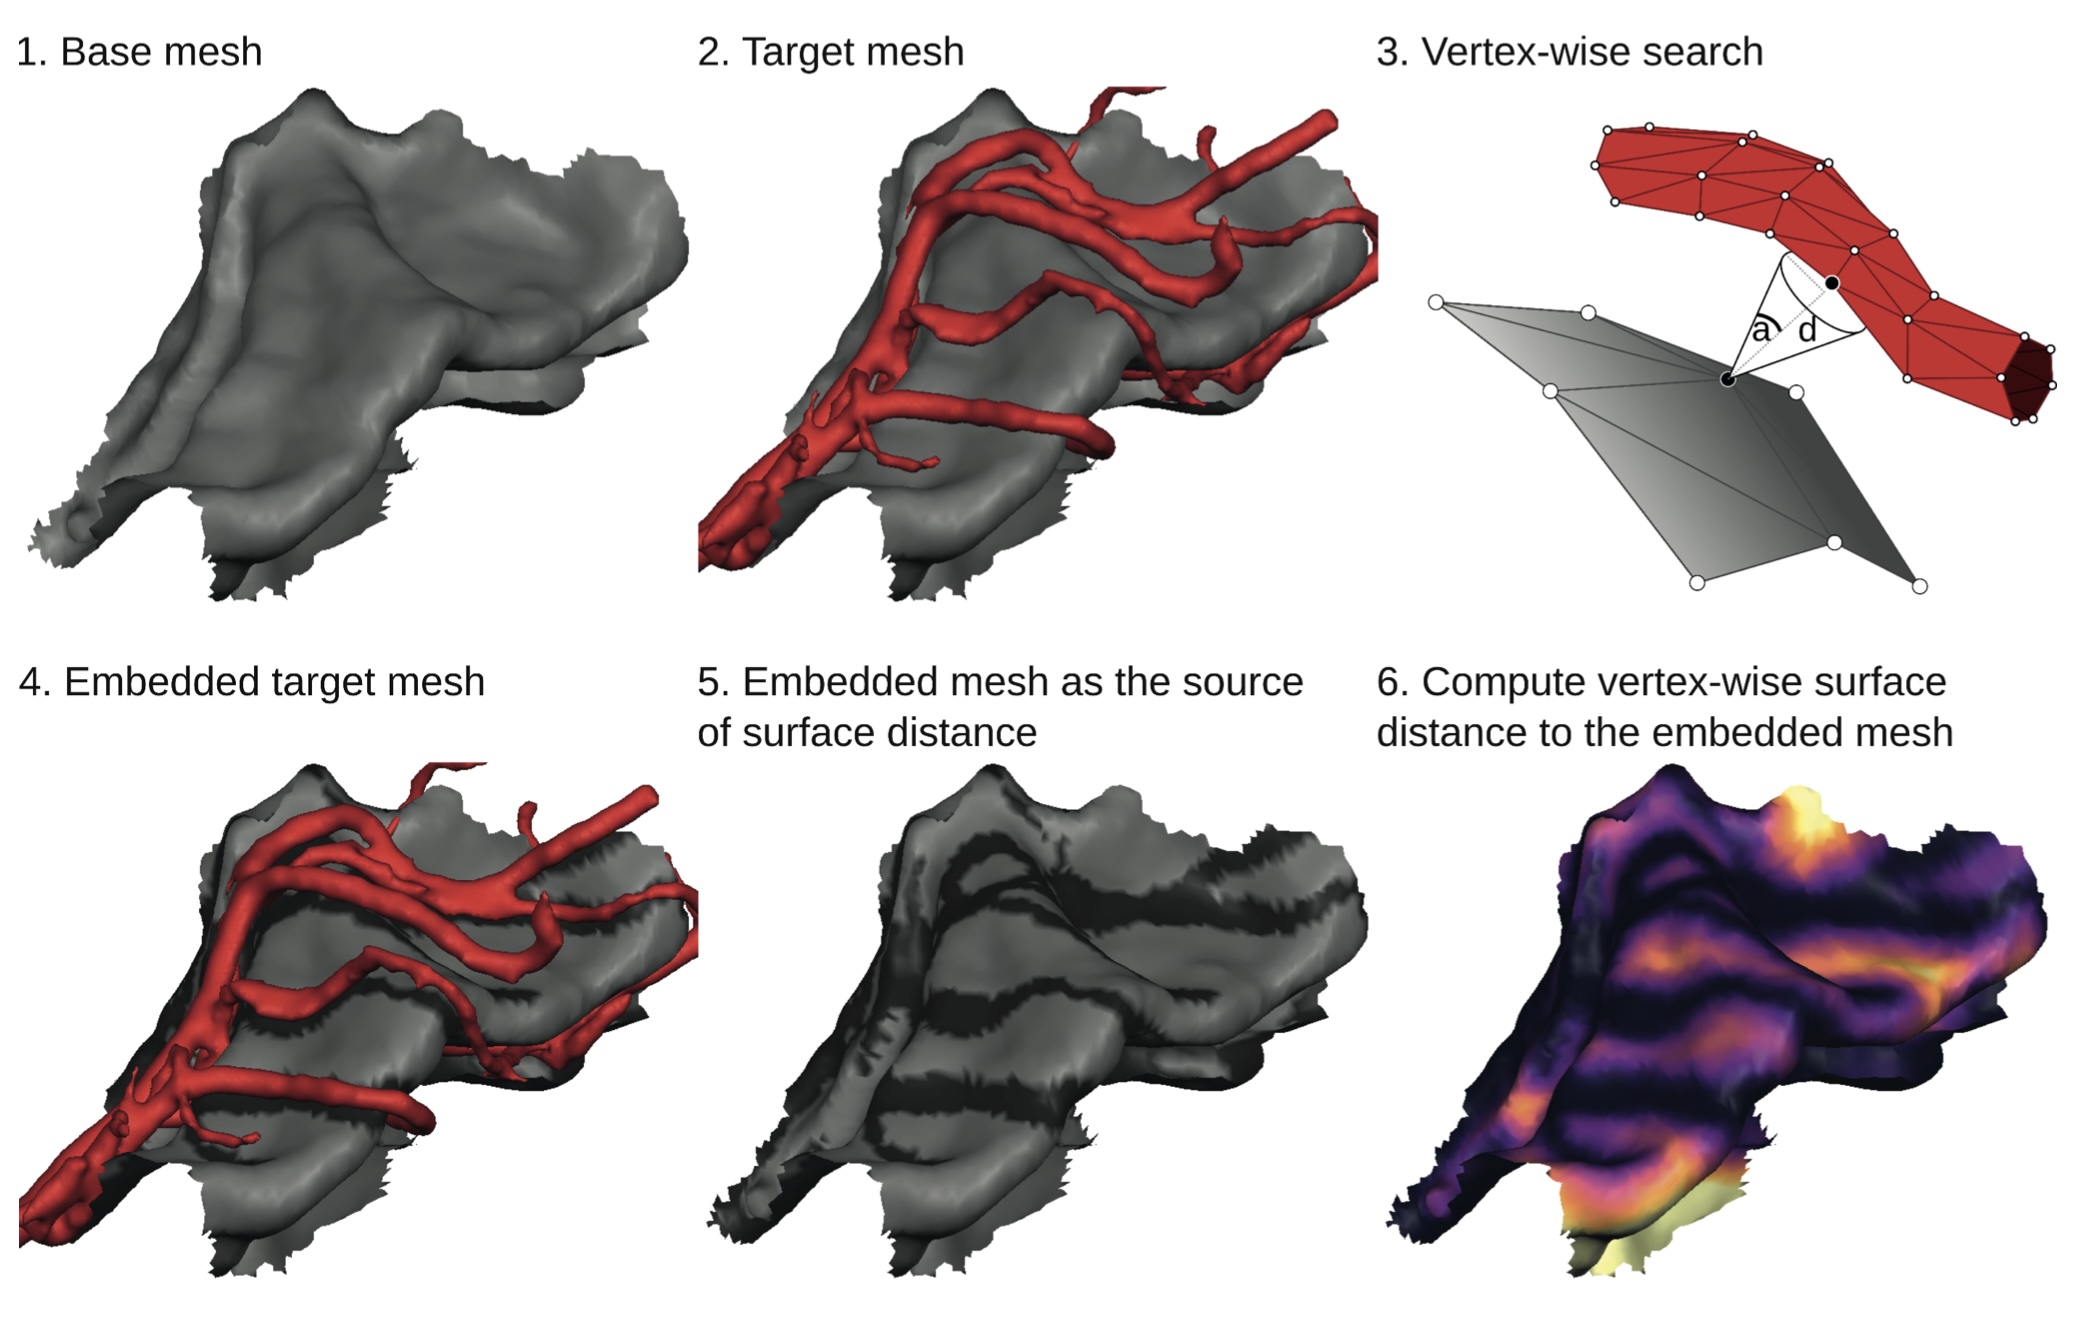
Gulban et al., 2020 // FIG 5.6 // A vessel projection method that I have developed for computing geodesic vessel proximity maps.
doi.org/10.26481/dis.20201006og
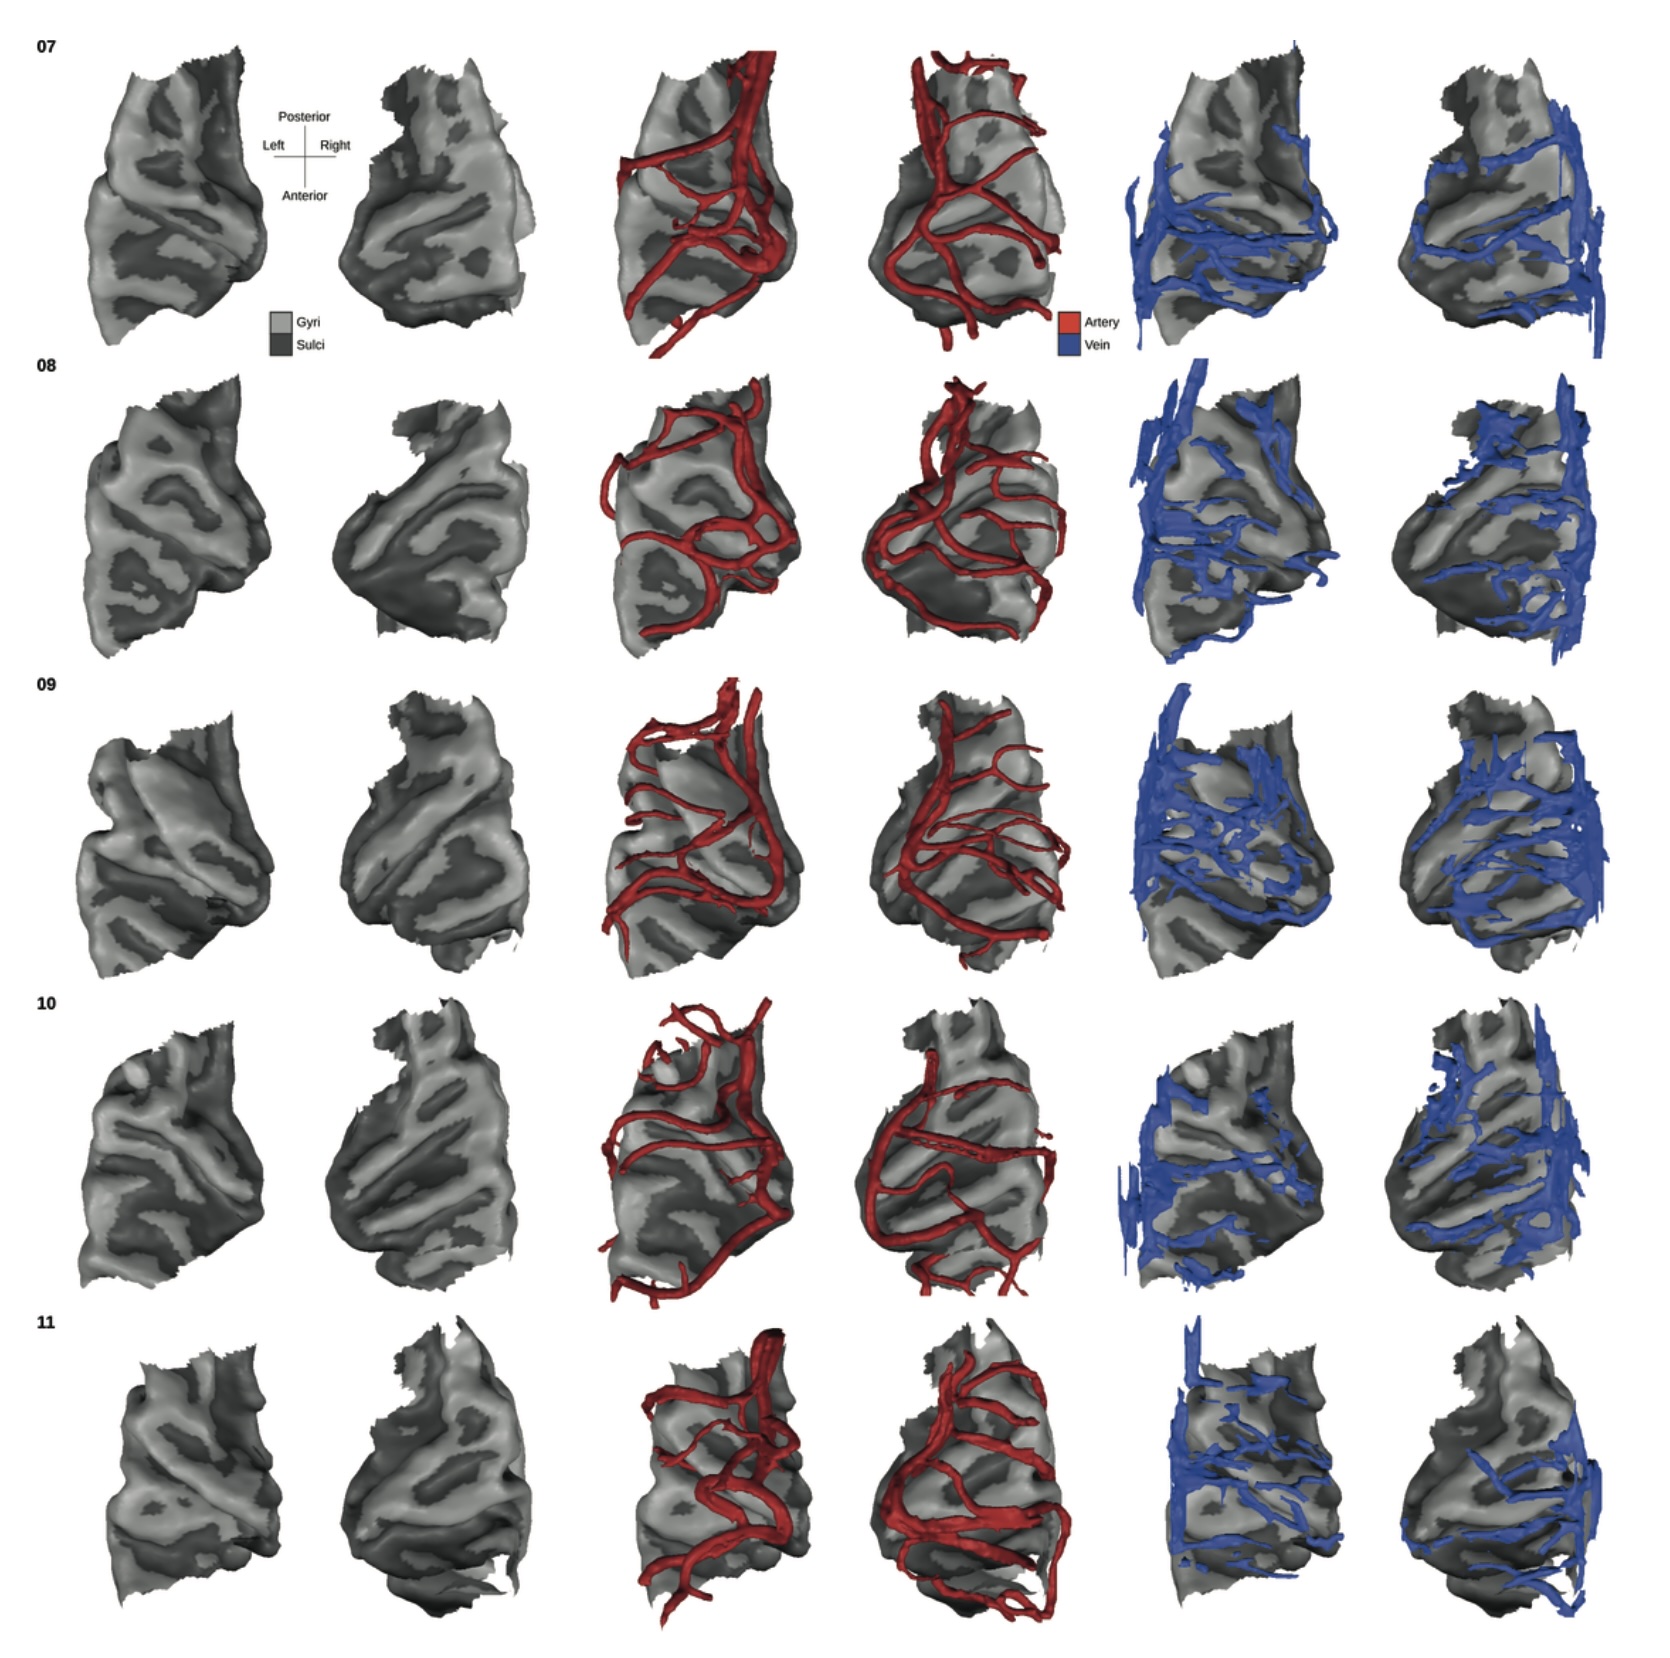
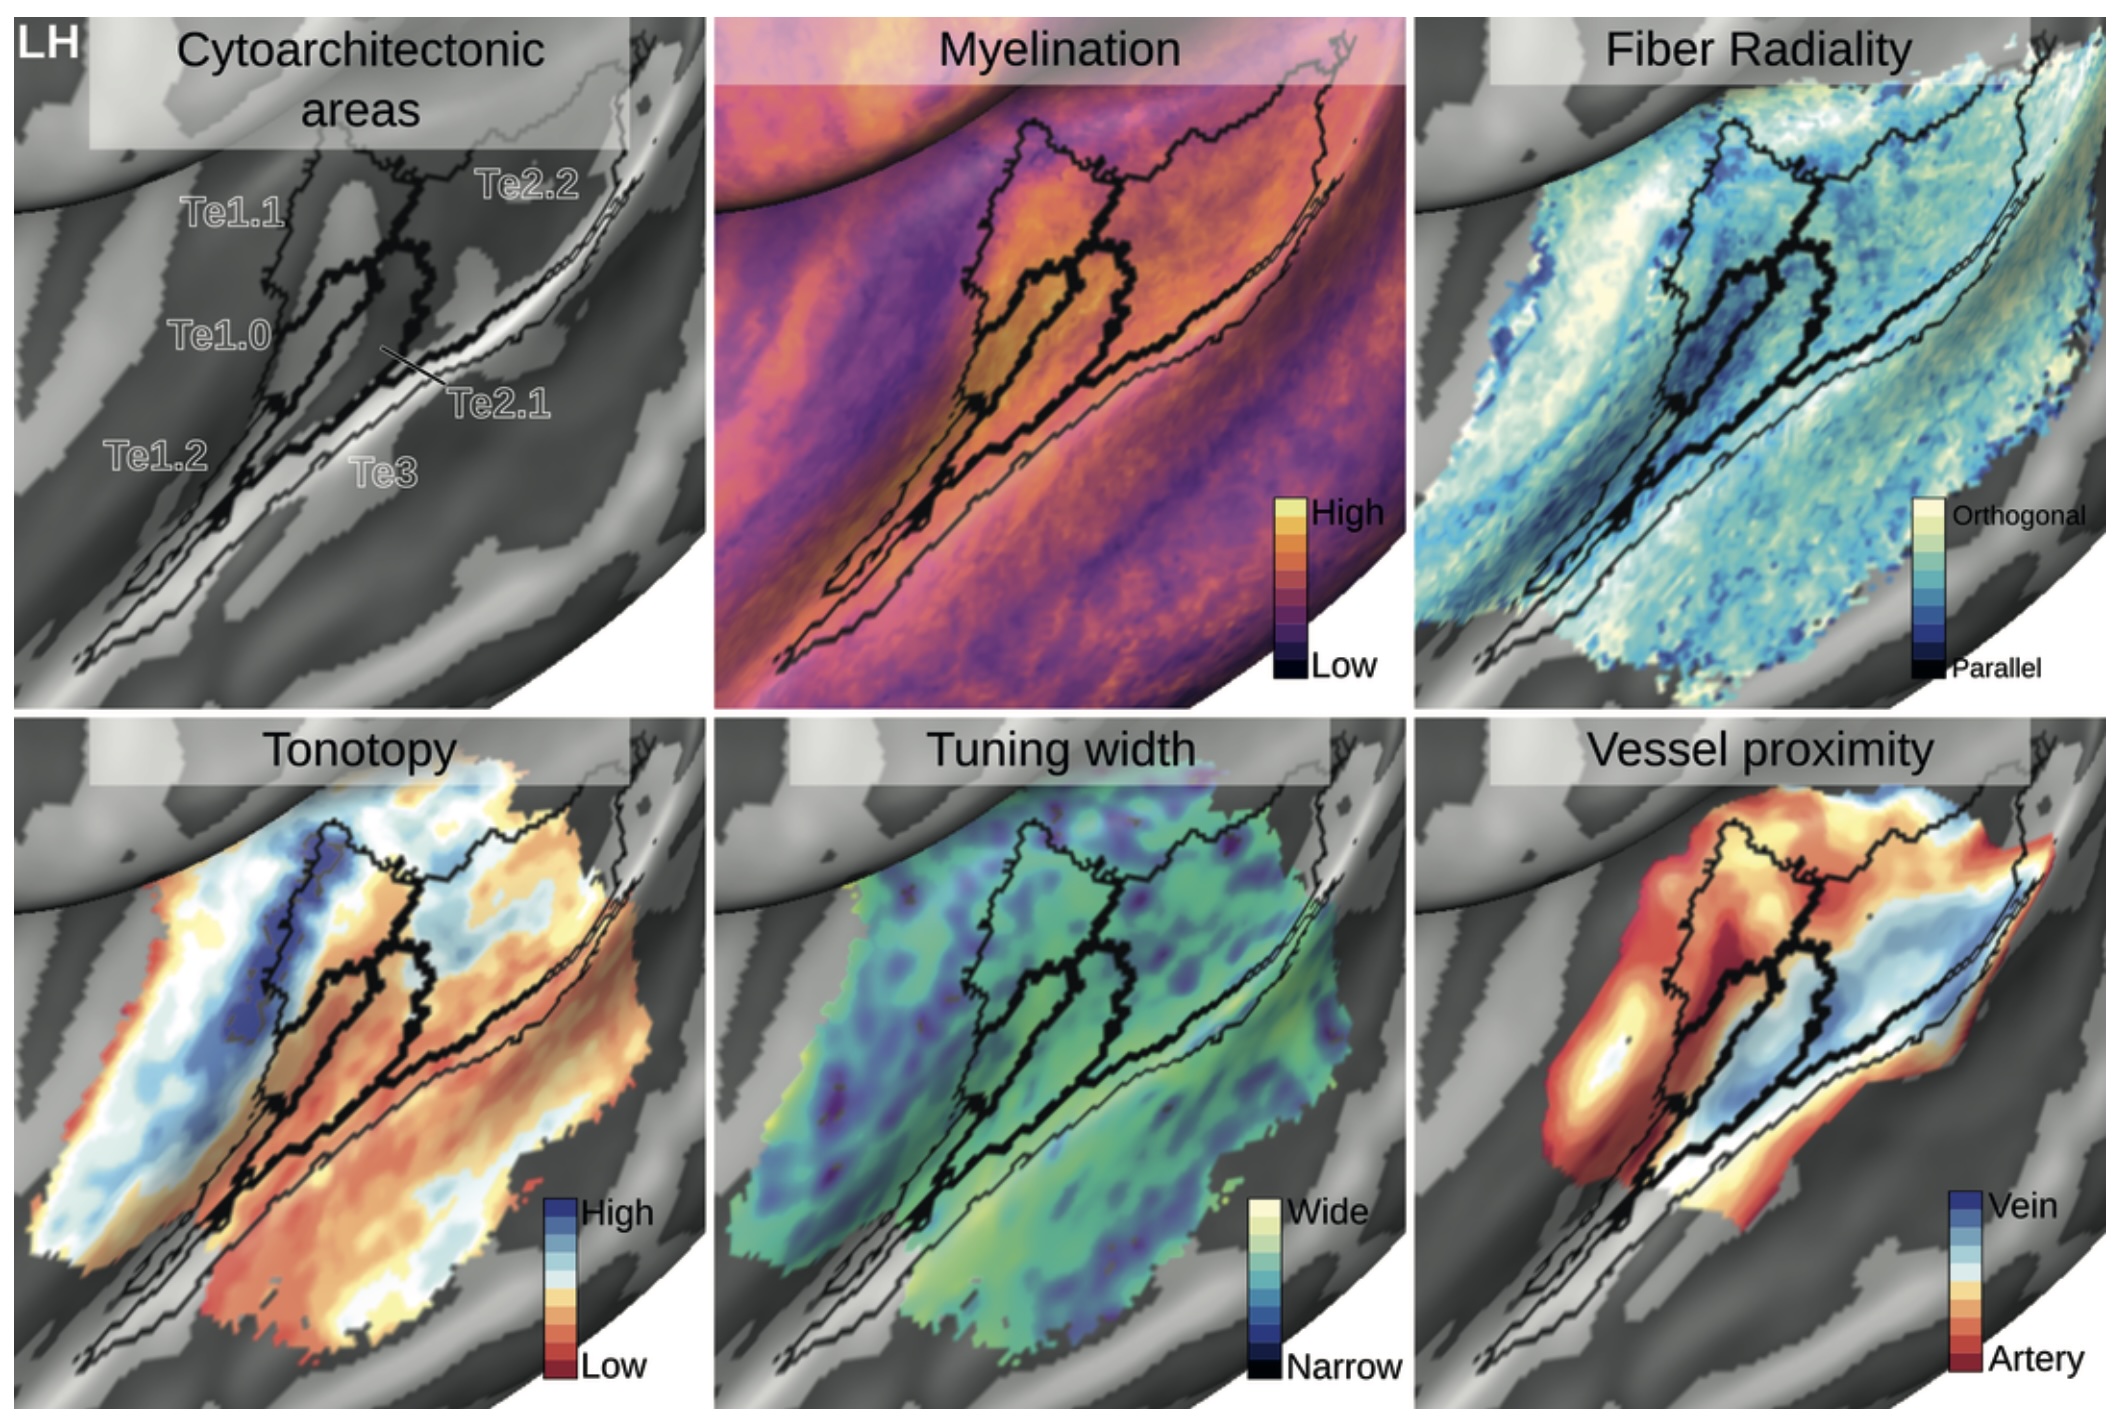
Gulban et al., 2020 // FIG 5.16 // A mini-atlas made of 10 brains showing vessel proximity maps (bottom right) together with other MRI measurements at the human auditory cortex. The black borders are determined using cytoarchitectonic imaging methods.
doi.org/10.26481/dis.20201006og
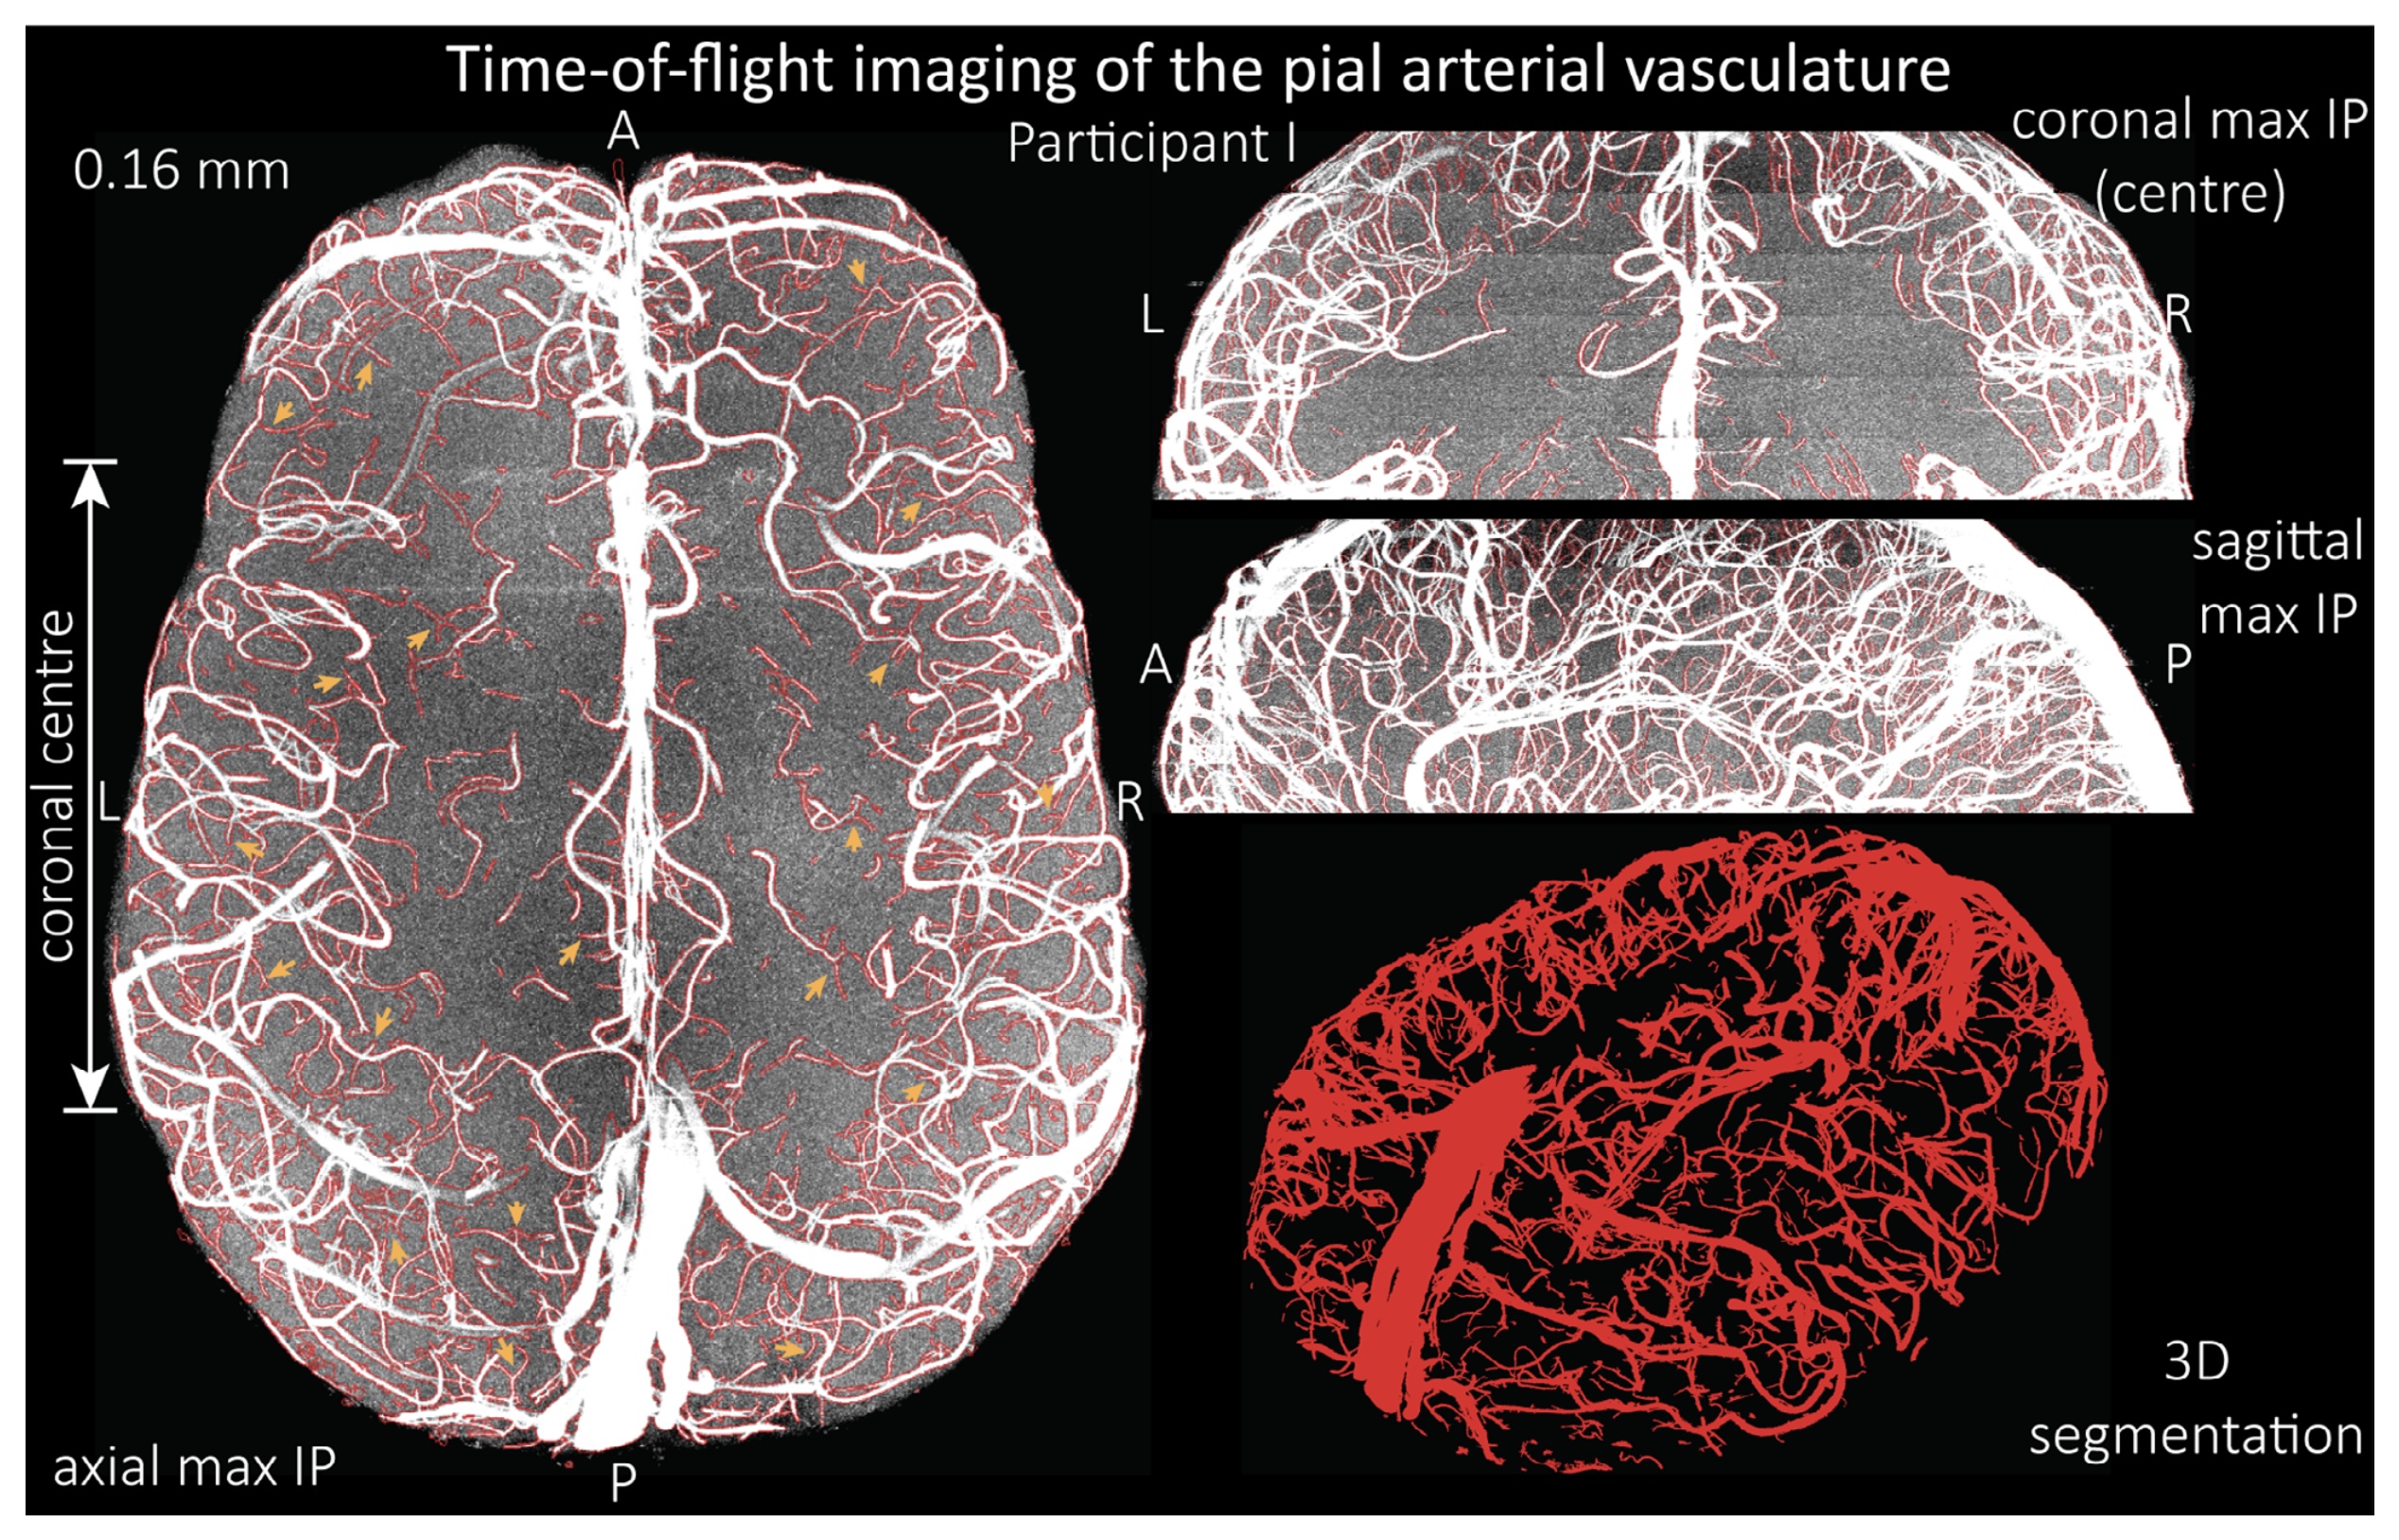
Bollmann et al., 2020 // FIG 6 // Human meso-arteries imaged using time-of-flight technique at 0.16 mm isotropic resolution. Note that most of the bright features are arteries but the saggital sinus is also visible with the same brightness. In vivo MRI.
doi.org/10.7554/eLife.71186
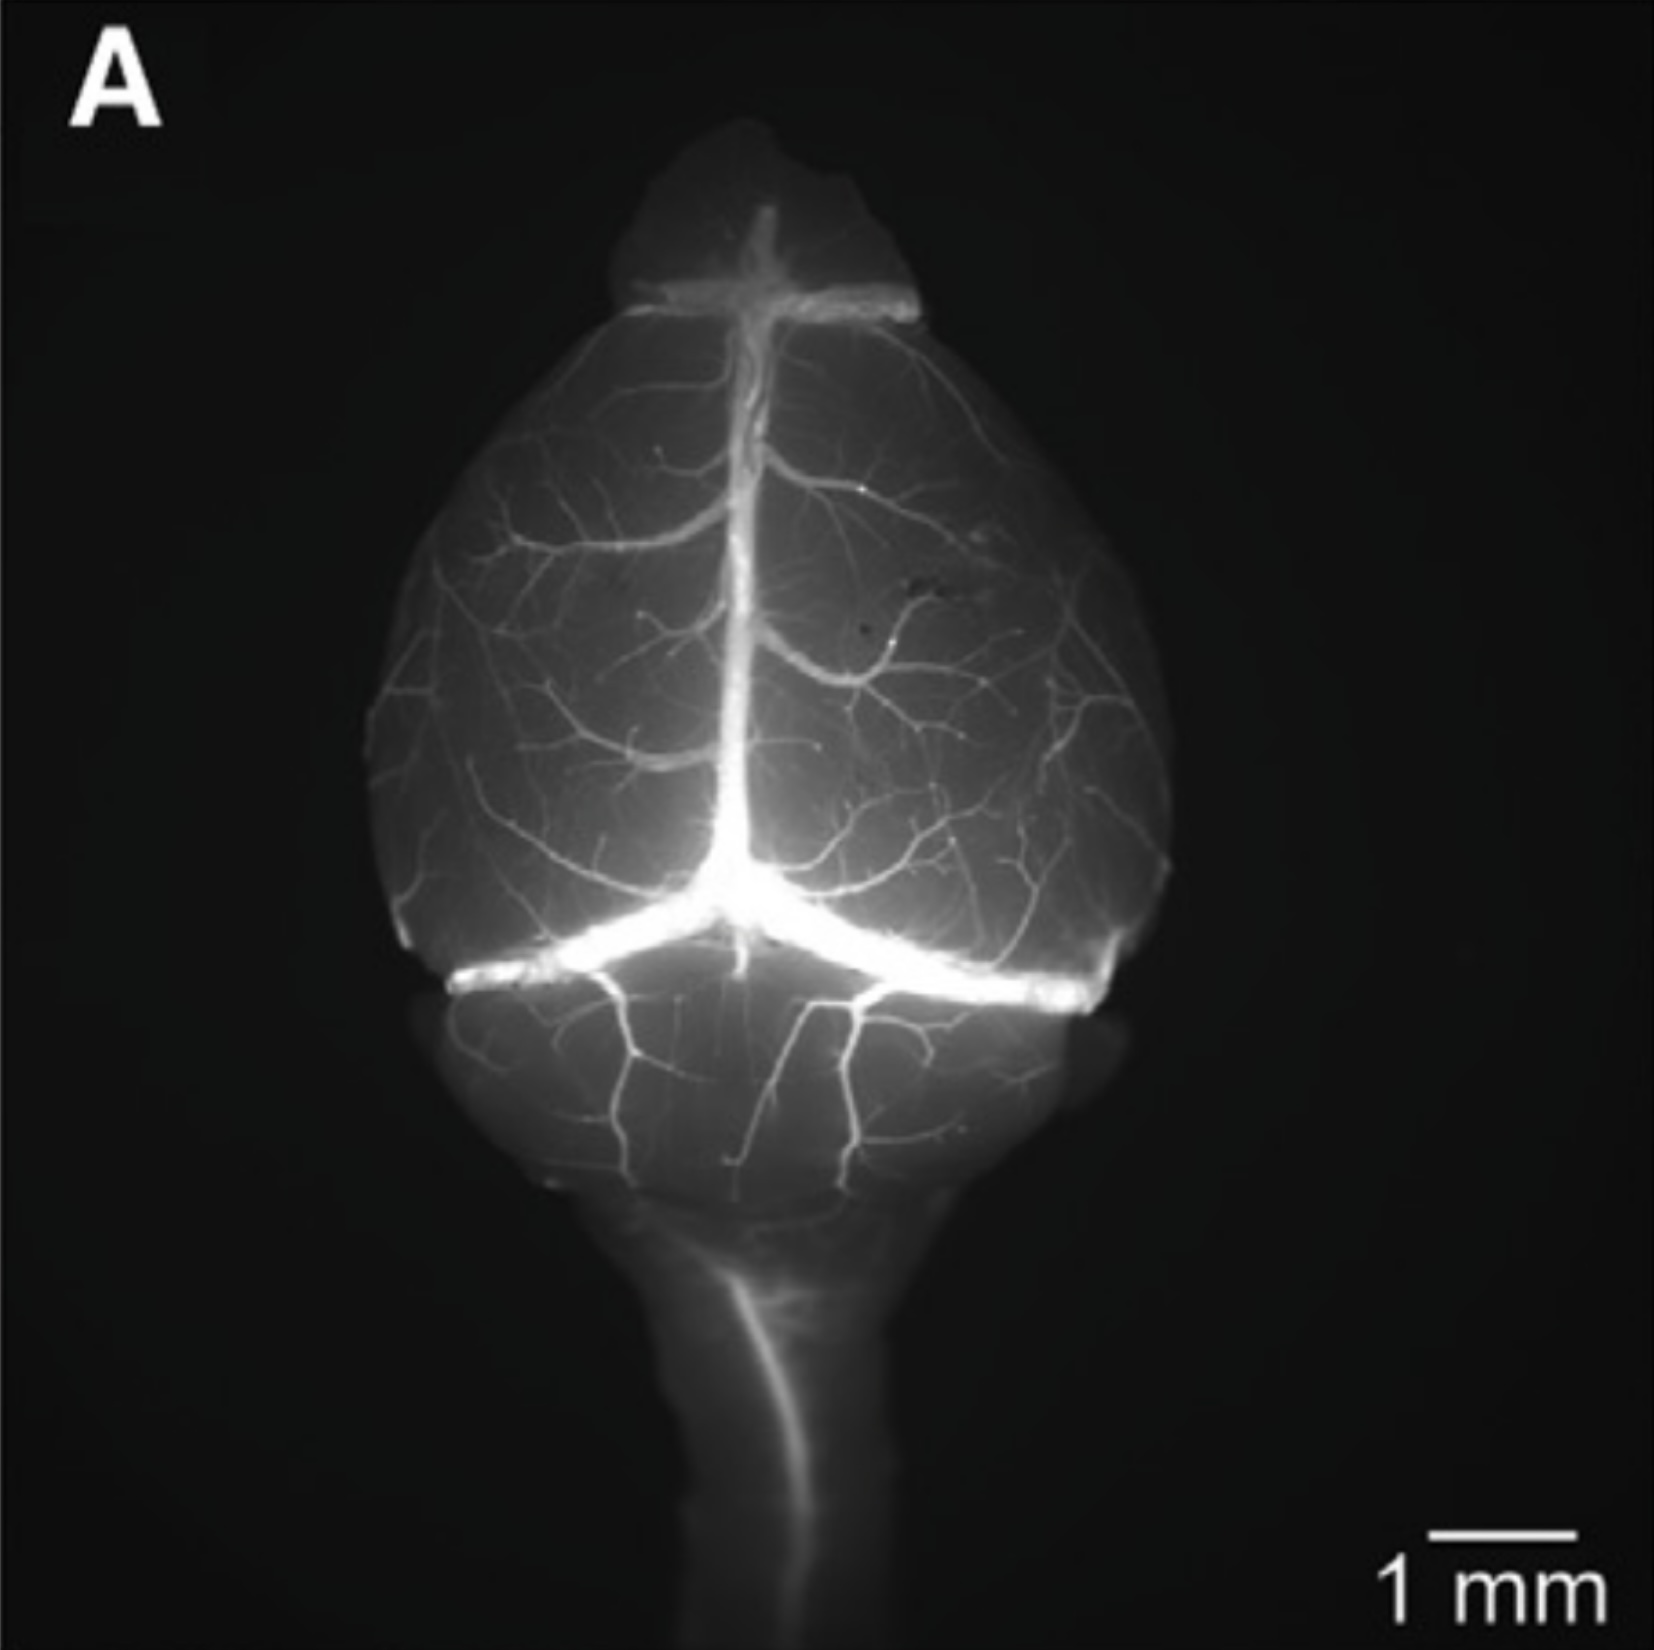
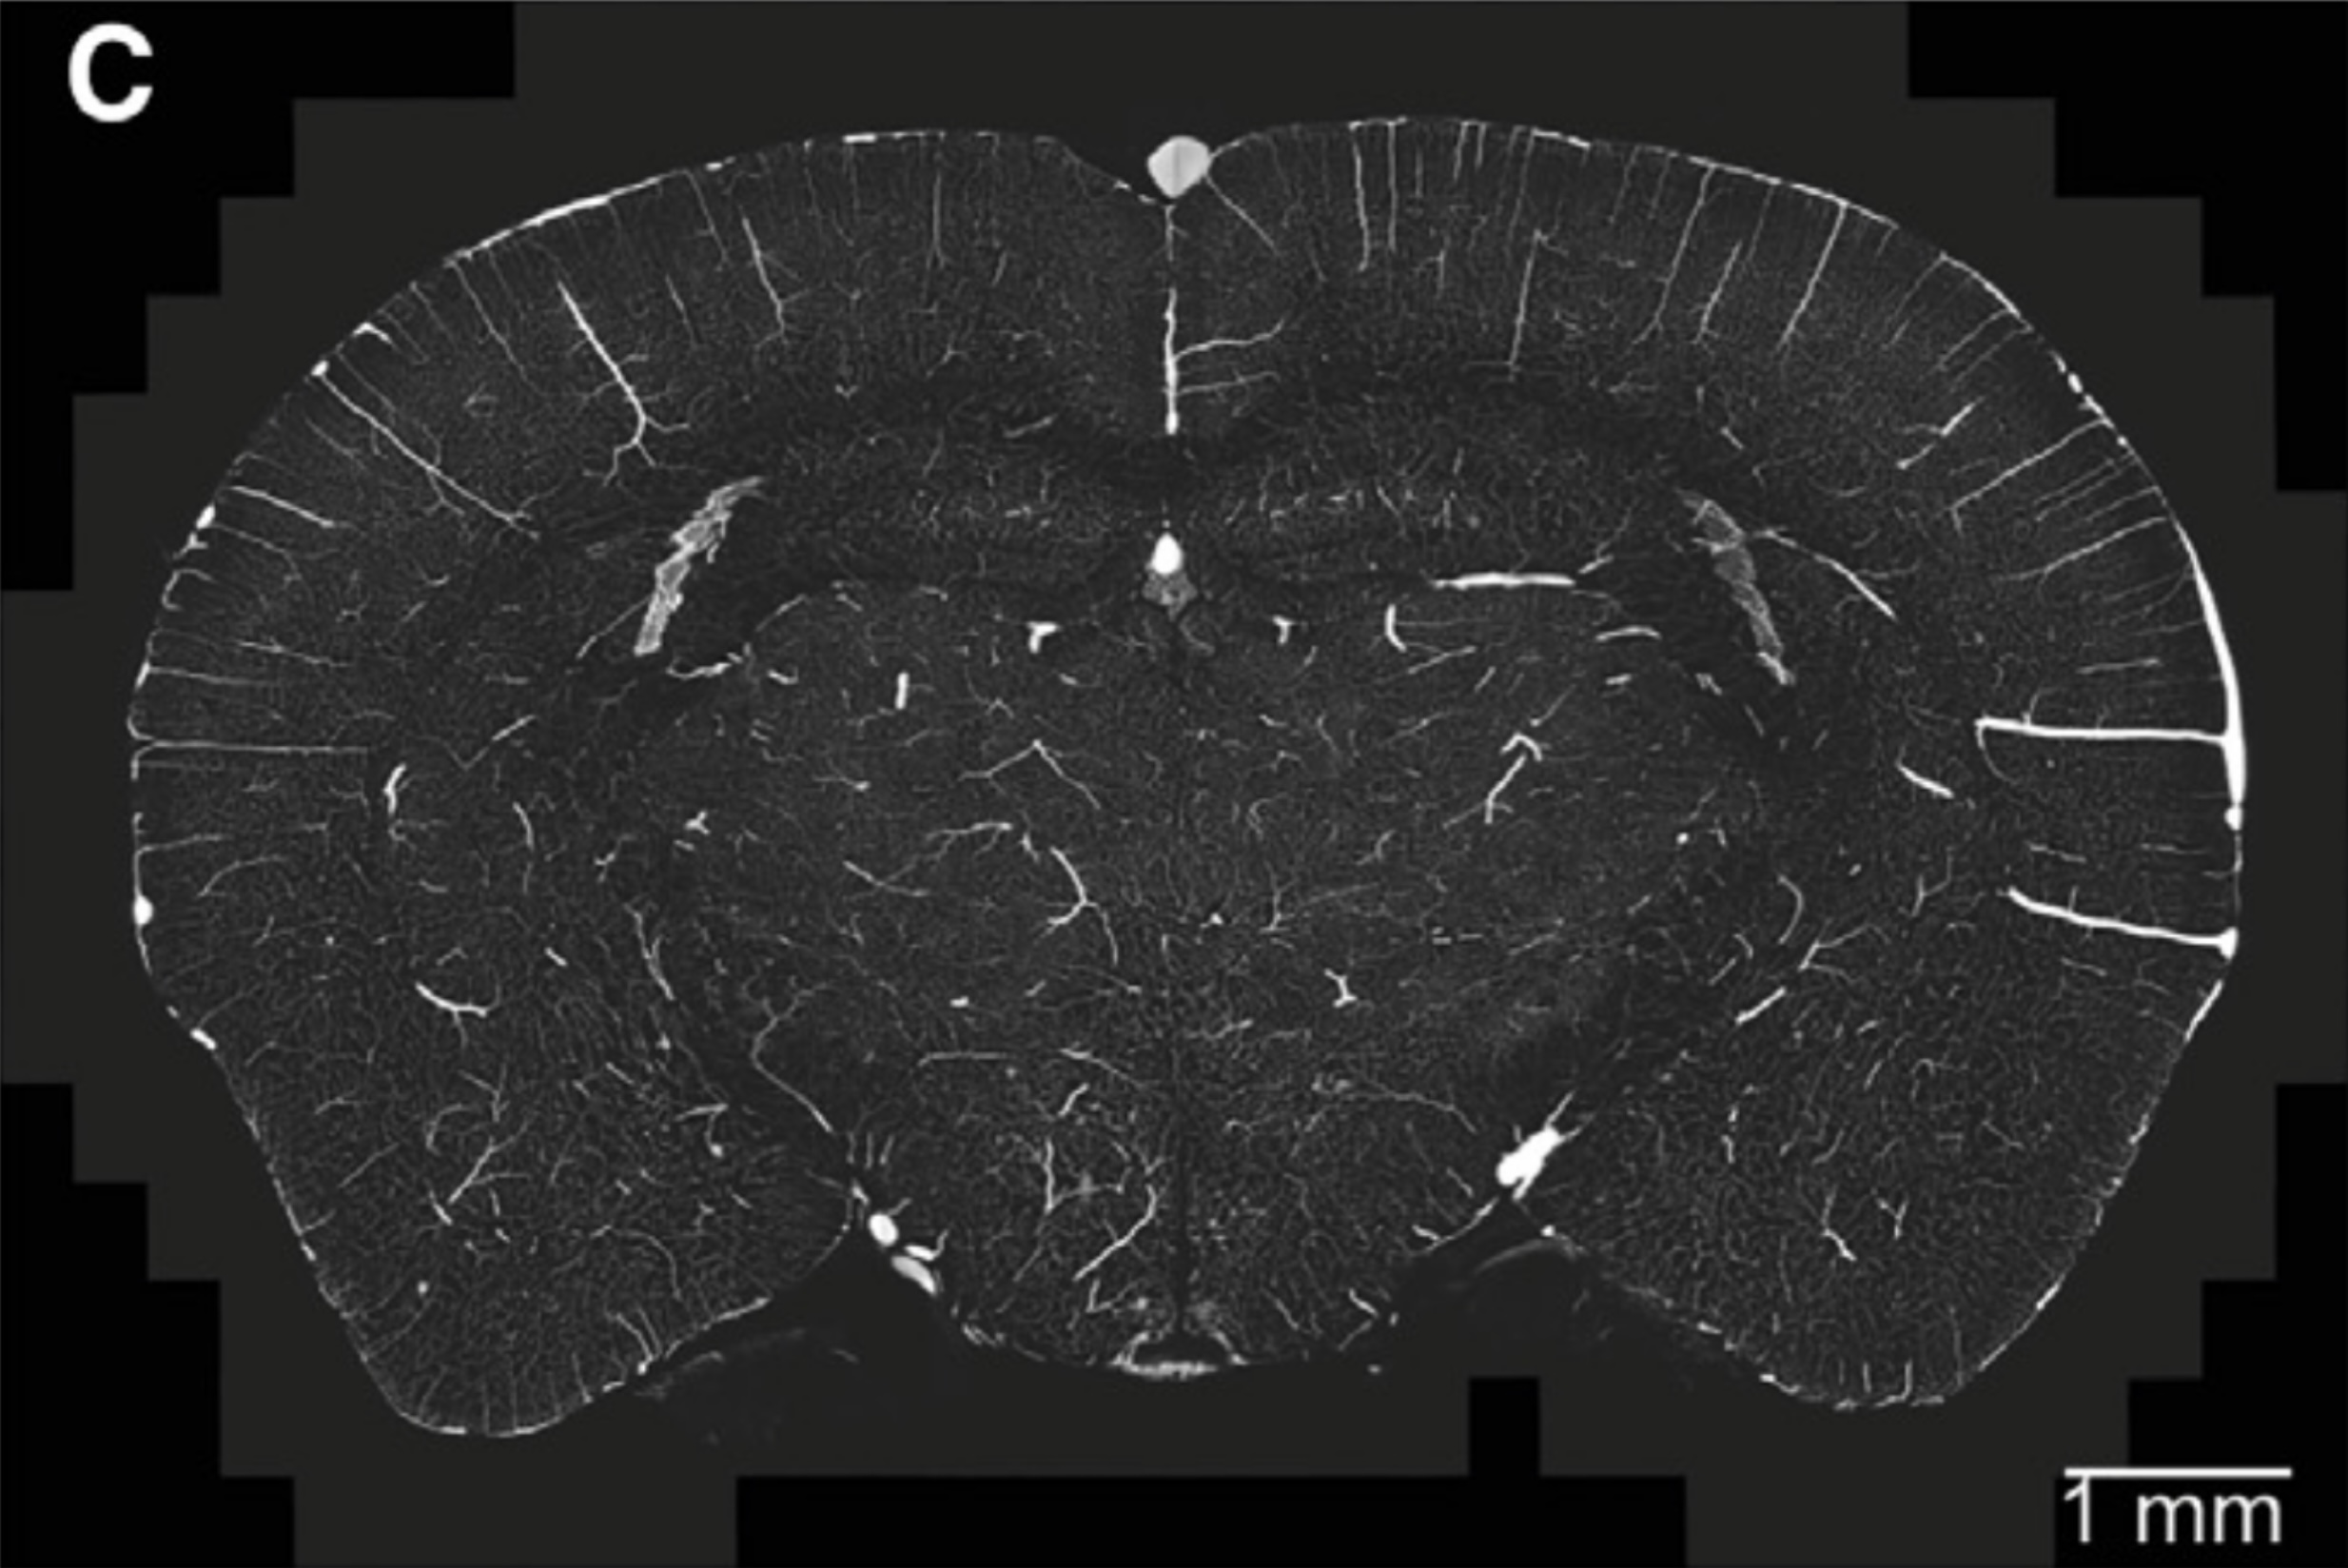
Kirst et al., 2020 // FIG 1 // Mice meso-vessels. Scale bar is 1 mm. Deep immunolabeling light sheet microscopy.
doi.org/10.1016/j.cell.2020.01.028
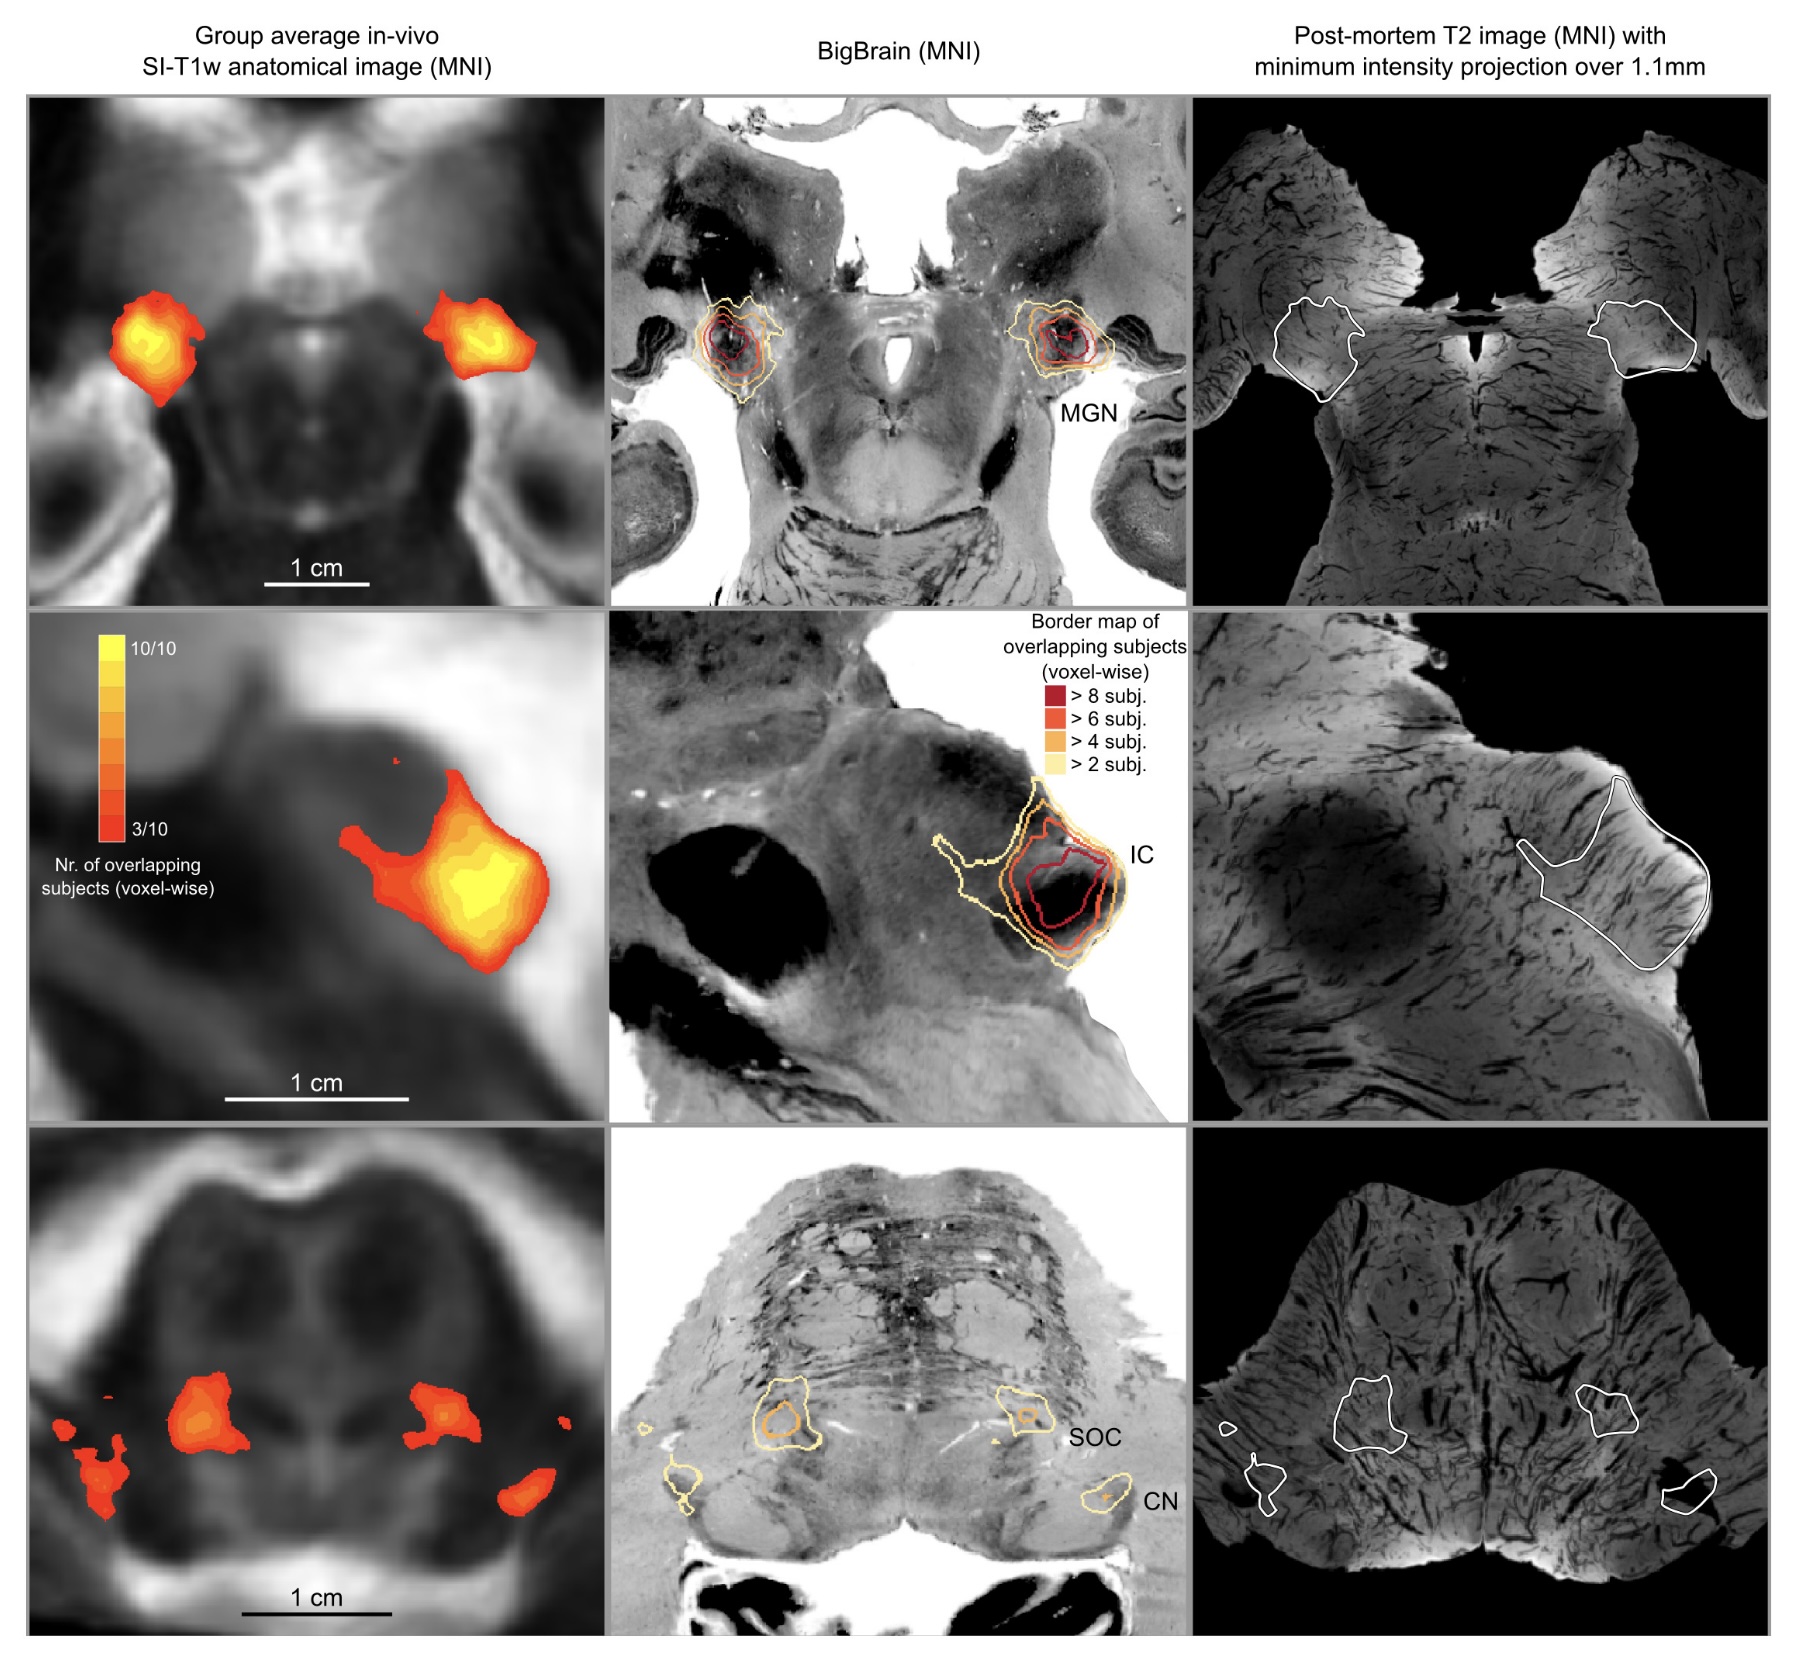
Sitek & Gulban et al., 2019 // FIG 9 // Human brainstem meso-vessels are directly visible (right column) using 50 μm isotropic post mortem MRI.
doi.org/10.7554/eLife.48932
Kay et al., 2019 // FIG 7 // Strong fMRI signal changes follow the veins. In vivo MRI.
doi.org/10.1016/j.neuroimage.2019.02.006
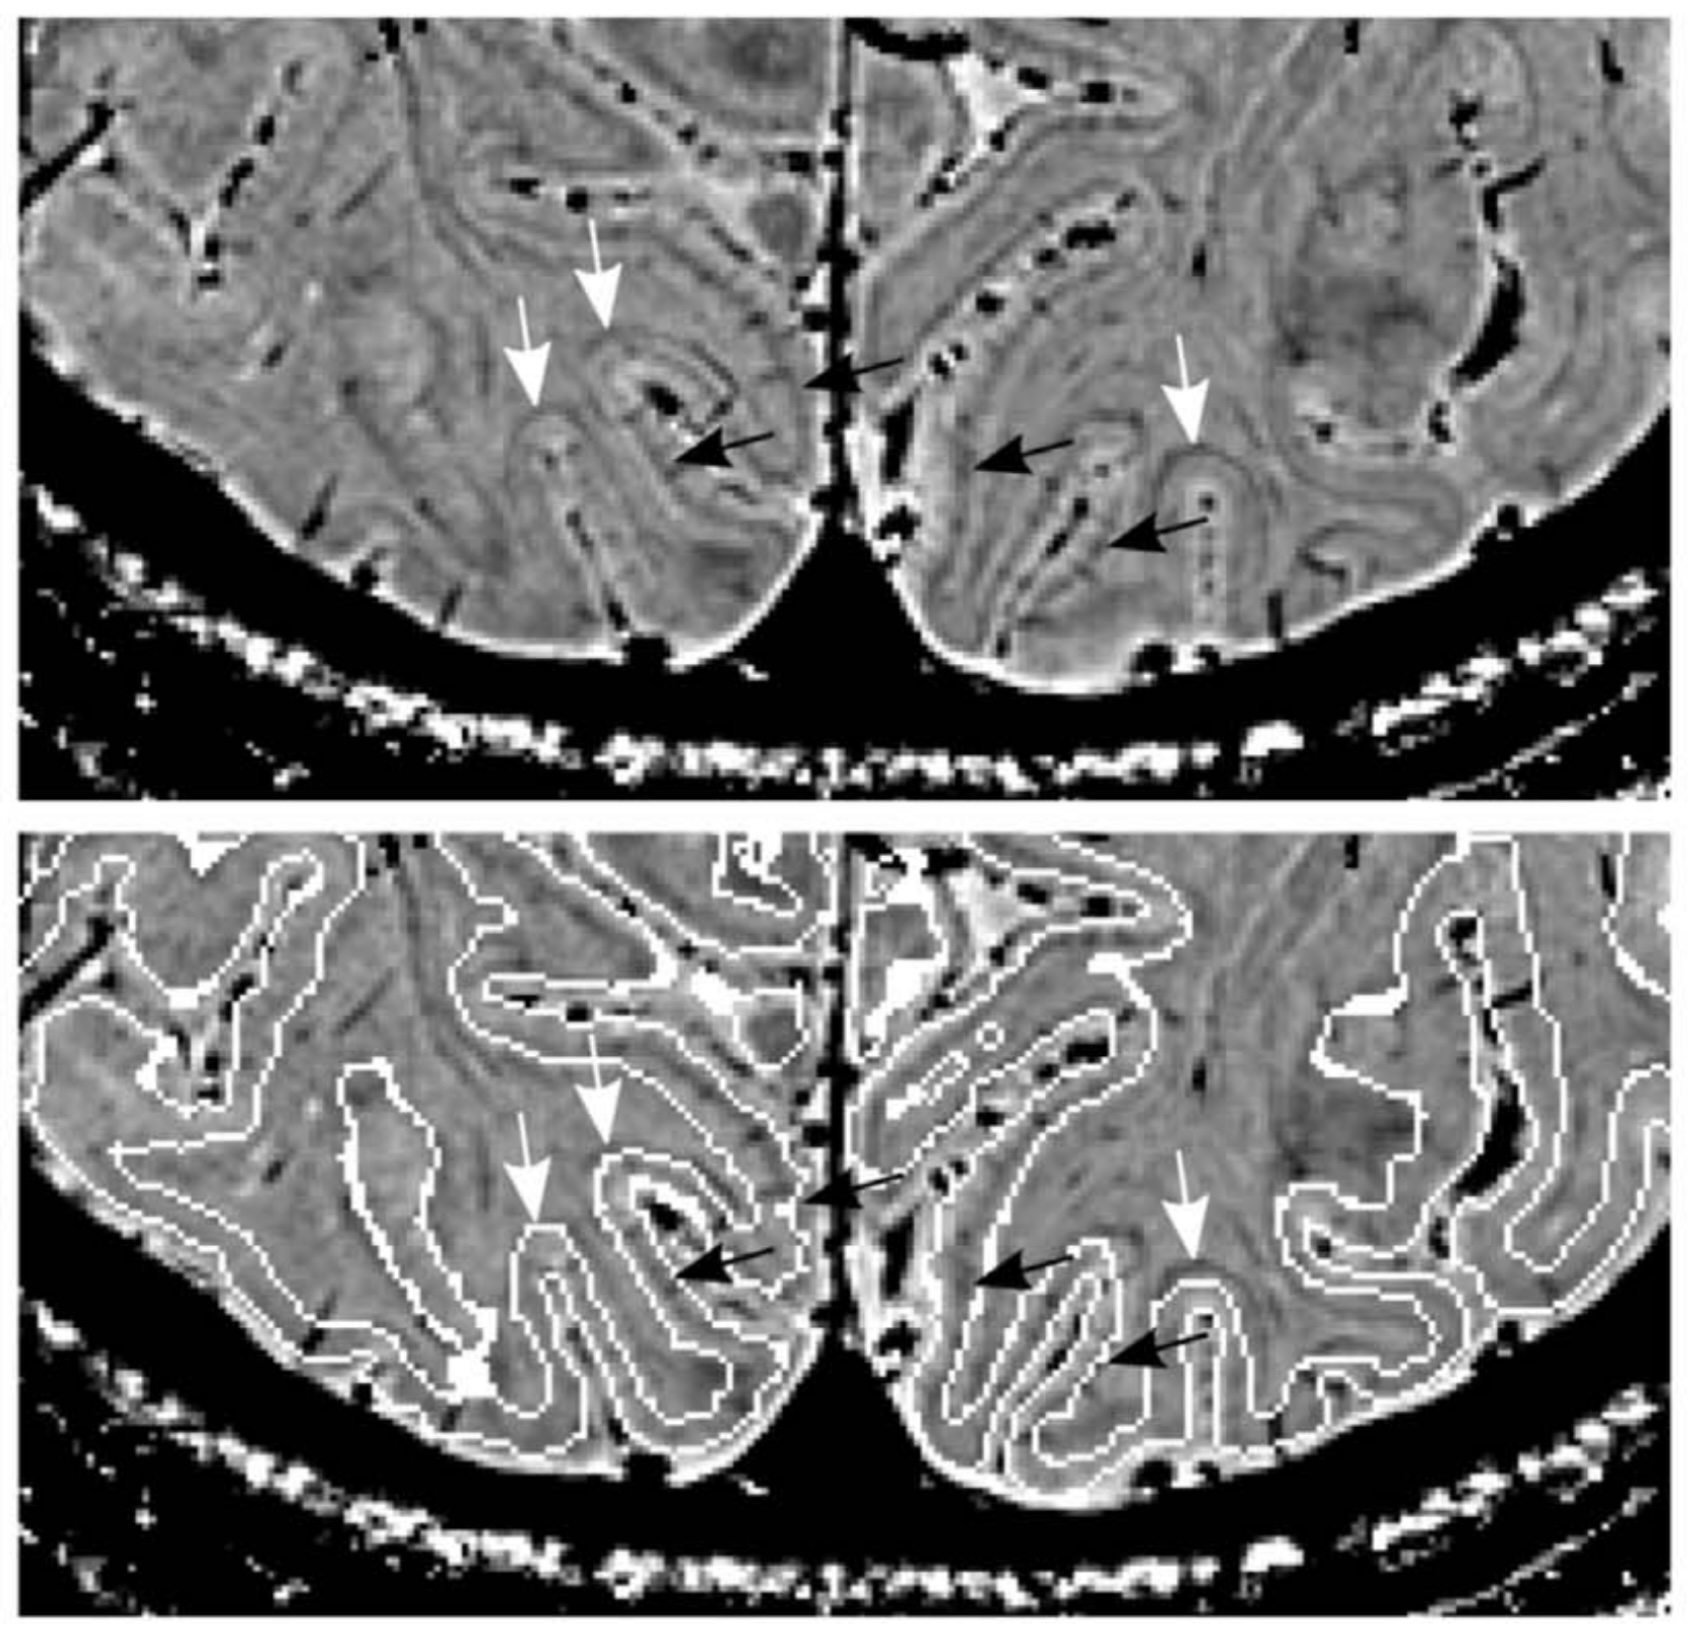
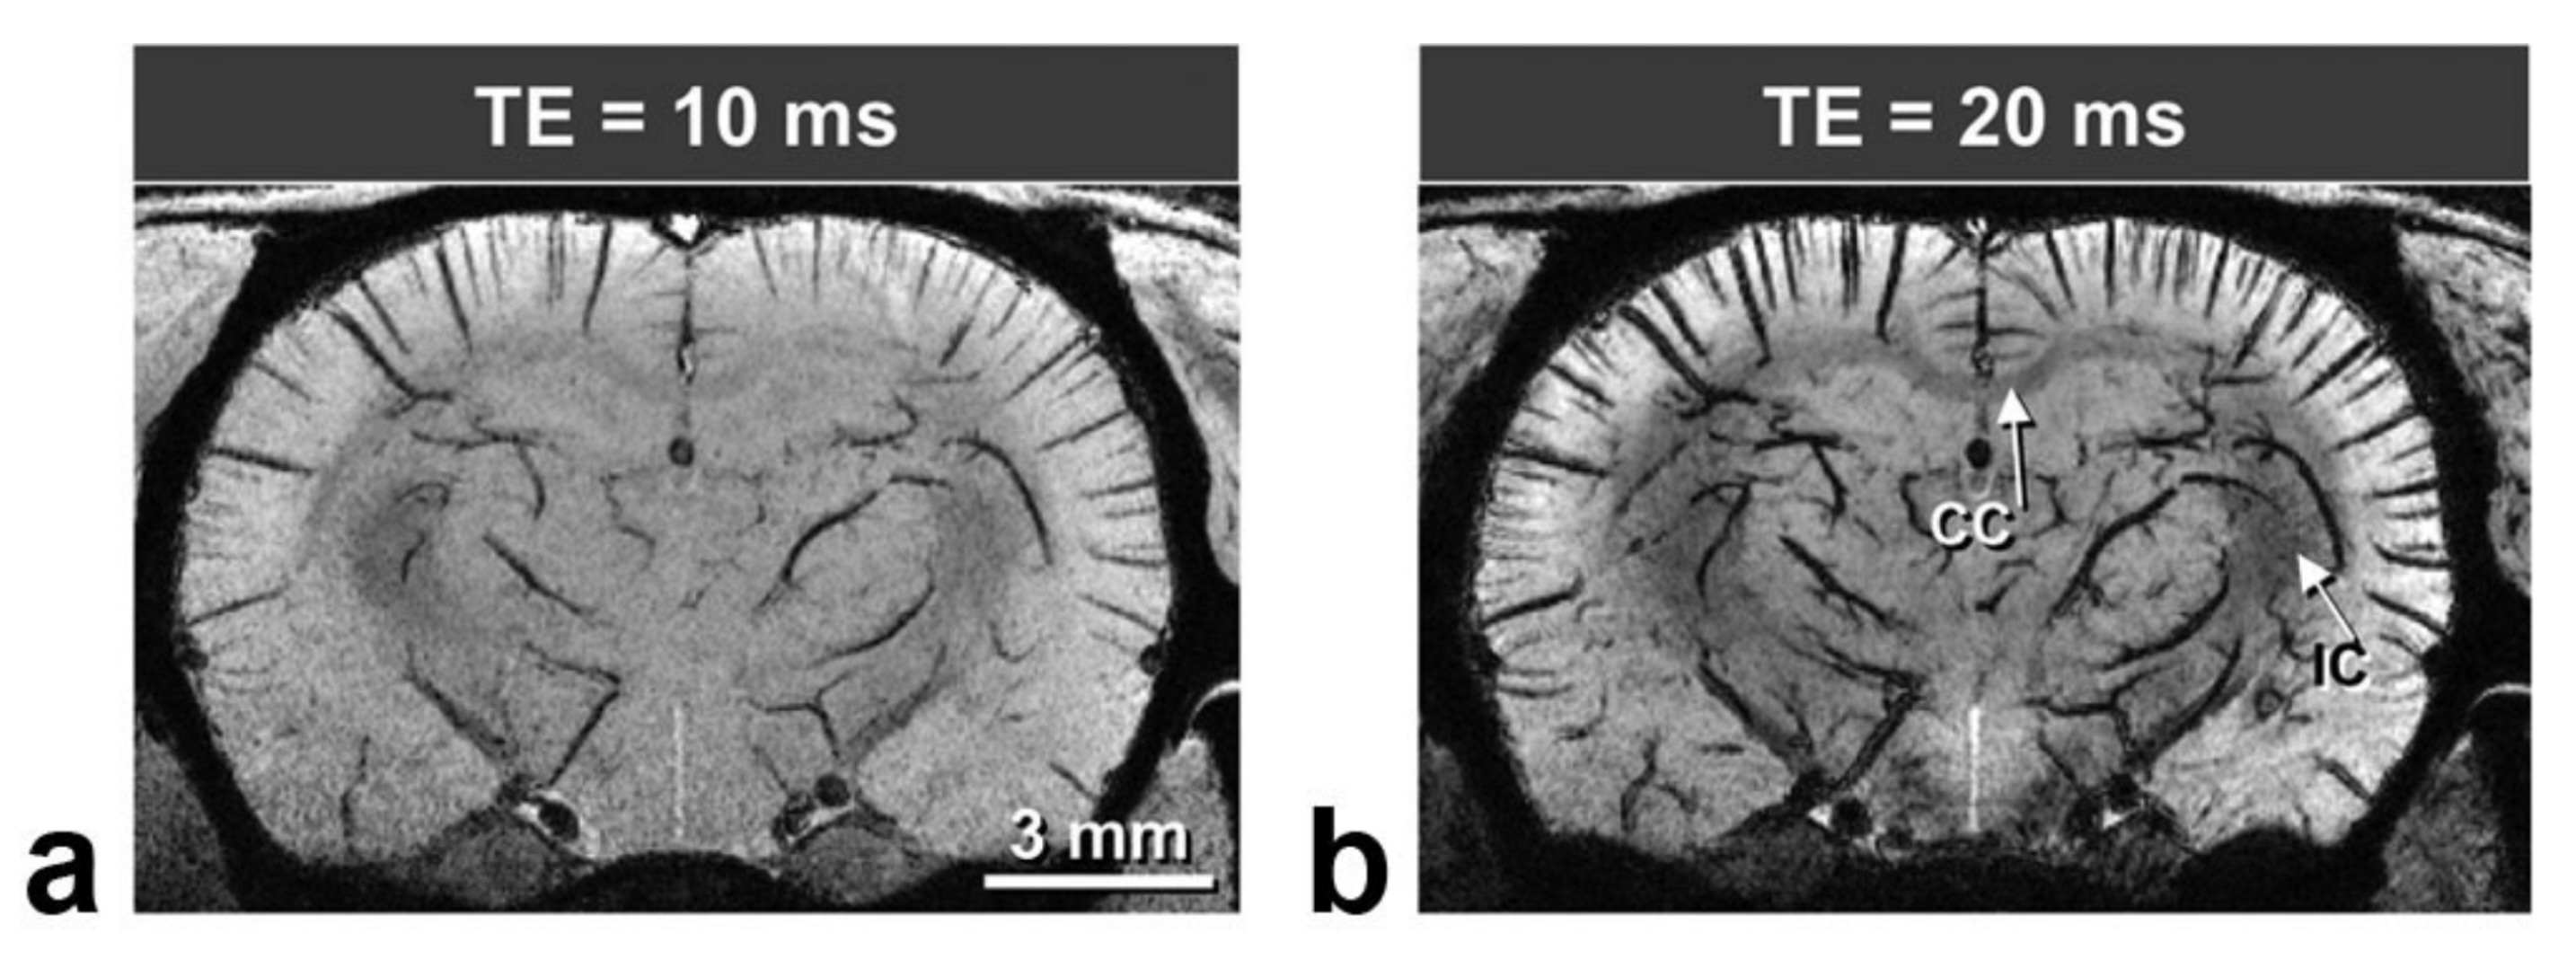
Kemper et al., 2019 // FIG 3 // Meso-veins are visible as "dark sticks" within the cortical gray matter (white borders). Dark arrows indicate the stria of Gennari, white arrows indicate superficial white matter contrast. In vivo human MRI, 0.35 × 0.35 × 0.35 mm3 voxels.
doi.org/10.1016/j.neuroimage.2017.03.058
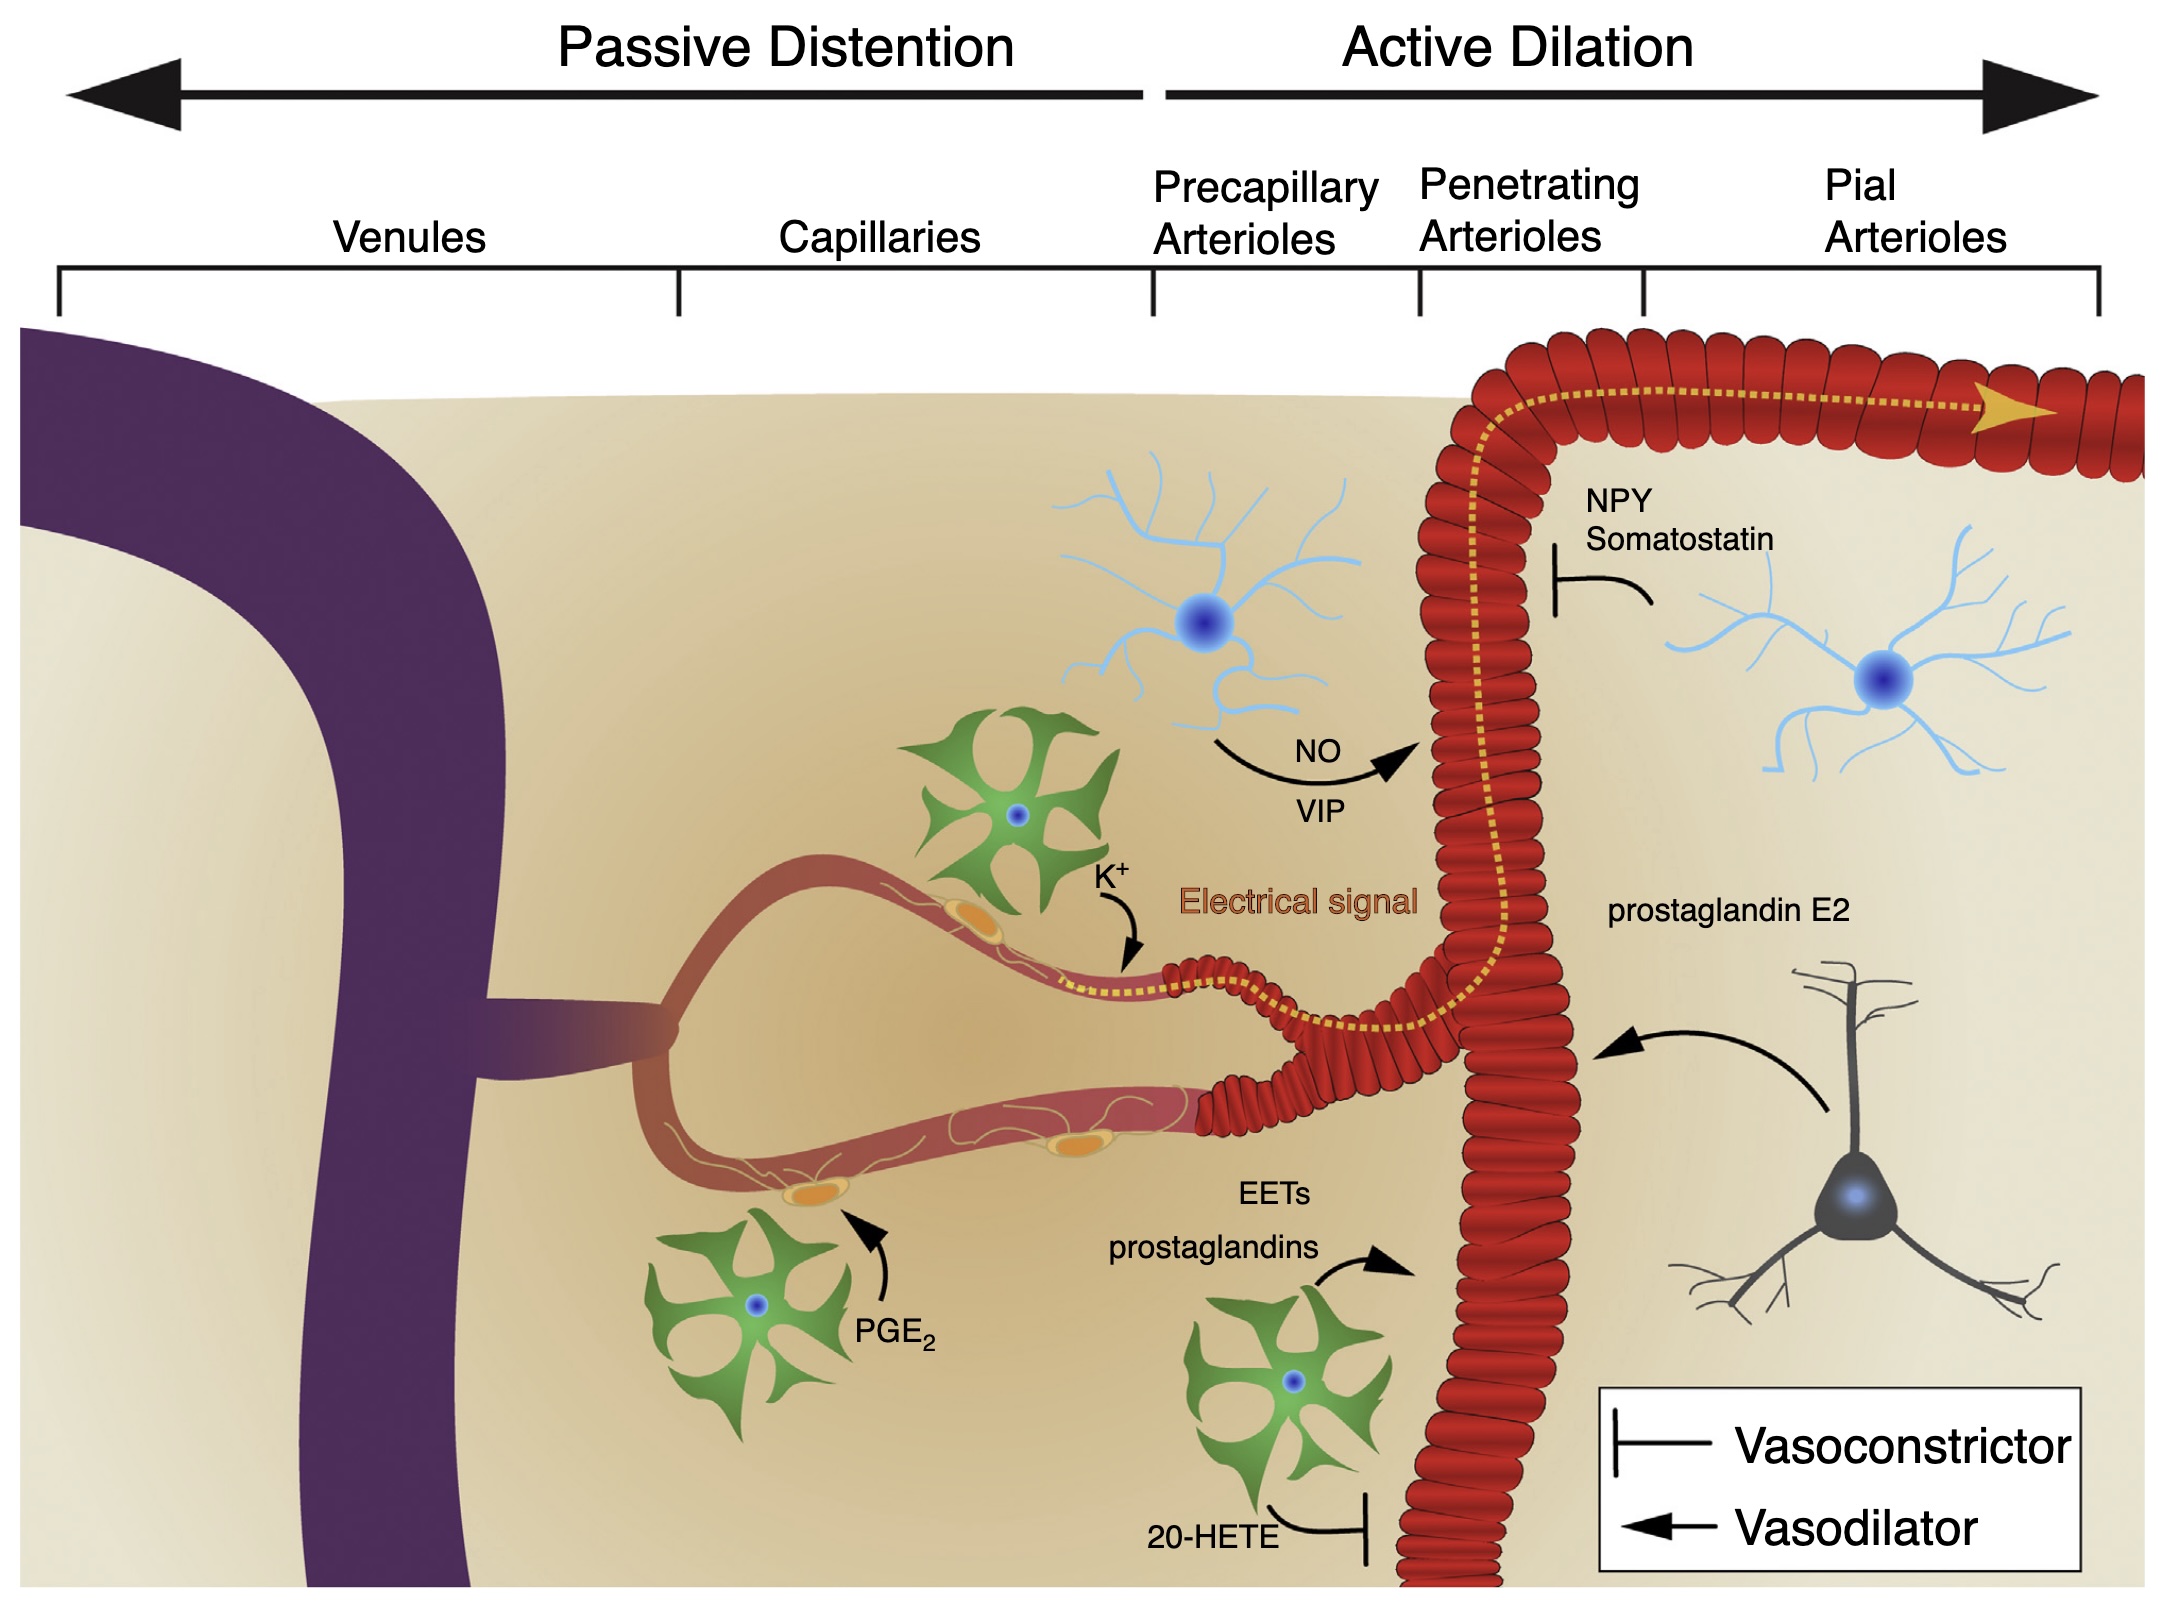
Drew, 2019 // FIG 1 // Schematic showing vasodilatory and vasoconstrictory signaling pathways used by neurons and astrocytes. Interneurons are blue, and pyramidal neurons are grey. The diameter increase happens first in the penetrating arterioles and precapillary arterioles, and propagates to other vascular regions either electrically (pial arterioles) or passively (veins and capillaries). The conducted hyperpolarization initiates in the capillary bed.
doi.org/10.1073/pnas.1100428108
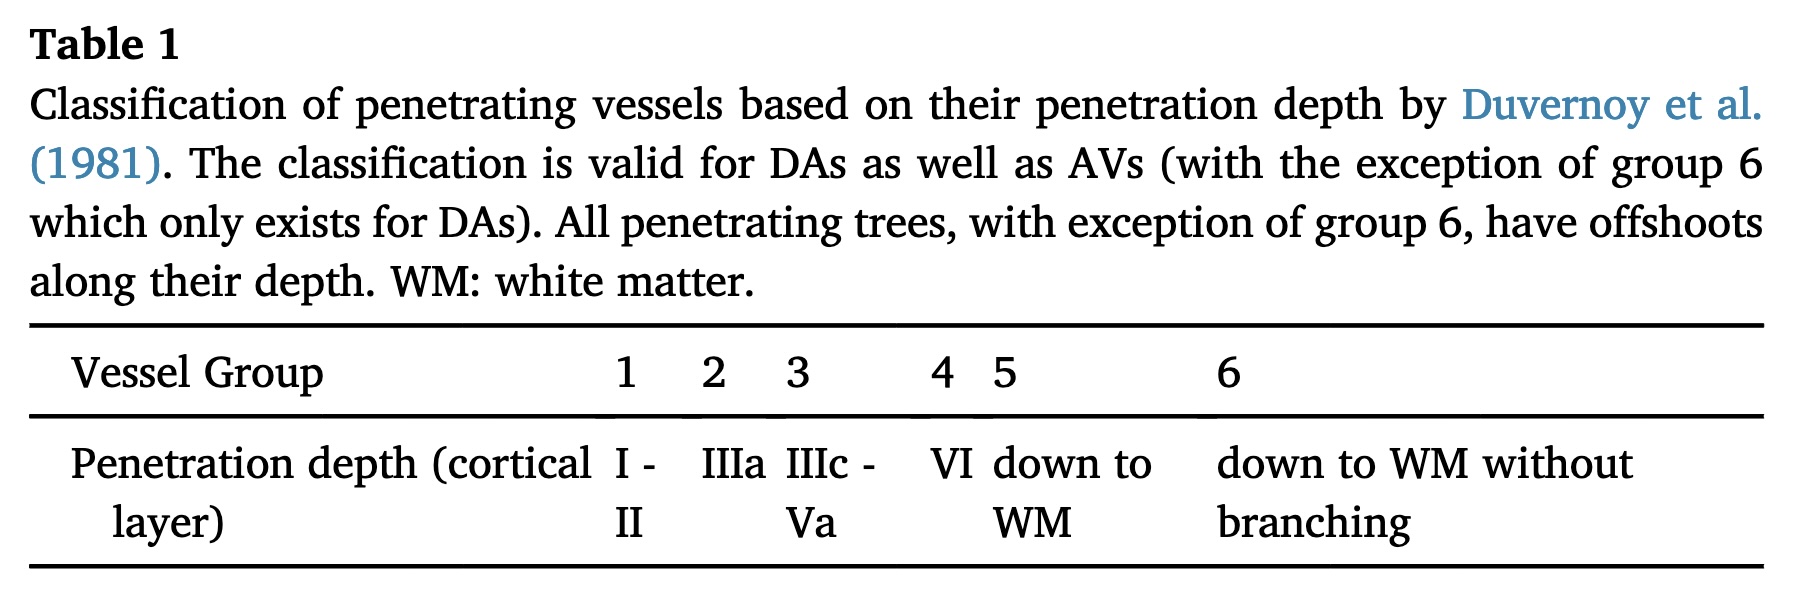
Schmid et al., 2019 // TABLE 1 // Classification of descending arteries (DA) and ascending veins (AV).
doi.org/10.1016/j.neuroimage.2017.06.046
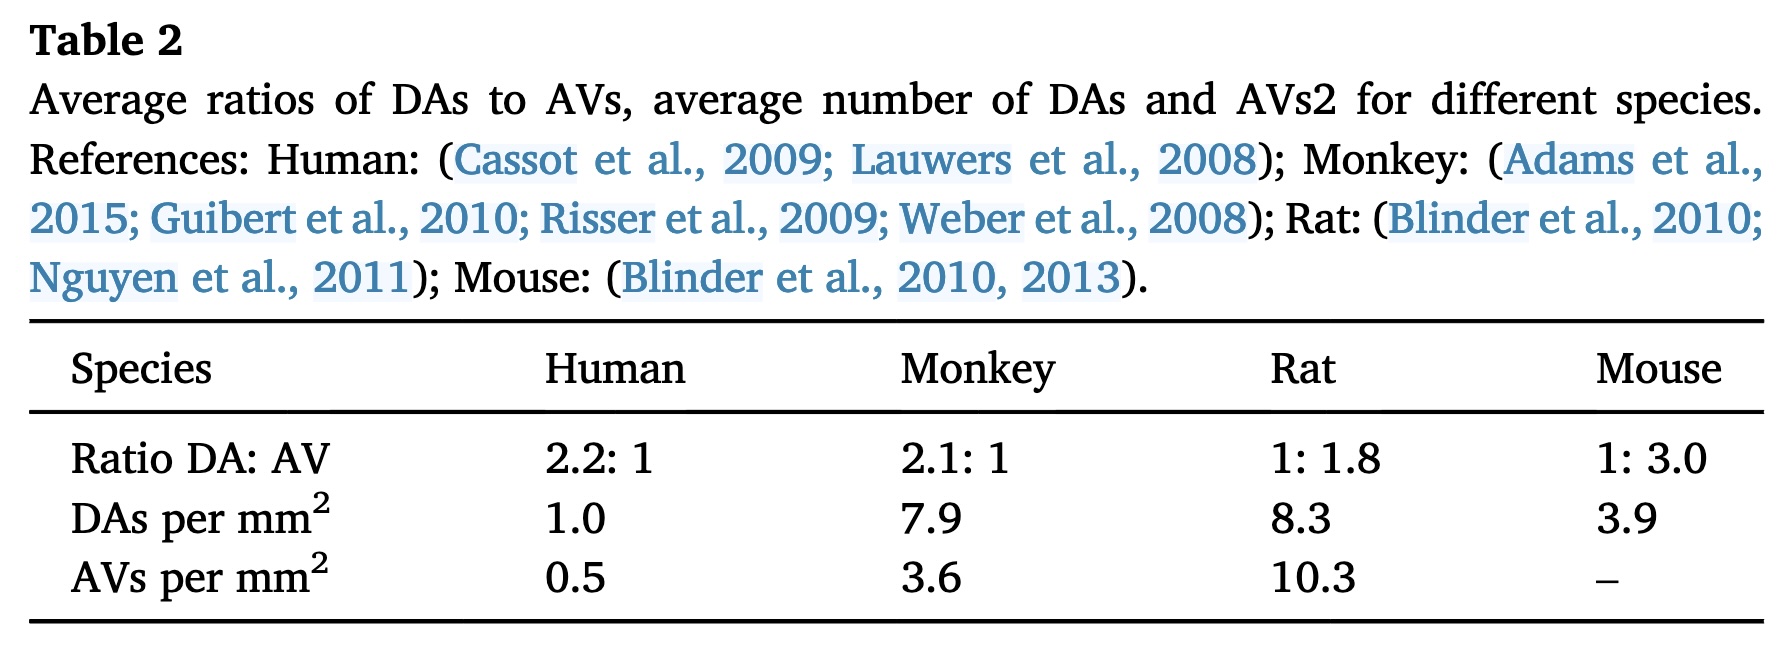
Schmid et al., 2019 // TABLE 1 // Descending arteries (DA) and ascending veins (AV) measurements across different species.
doi.org/10.1016/j.neuroimage.2017.06.046
He et al., 2018 // FIG 3 // Meso-vessels of a rat. In vivo MRI with 50 × 50 × 500 μm3 voxels.
doi.org/10.1016/j.neuron.2018.01.025
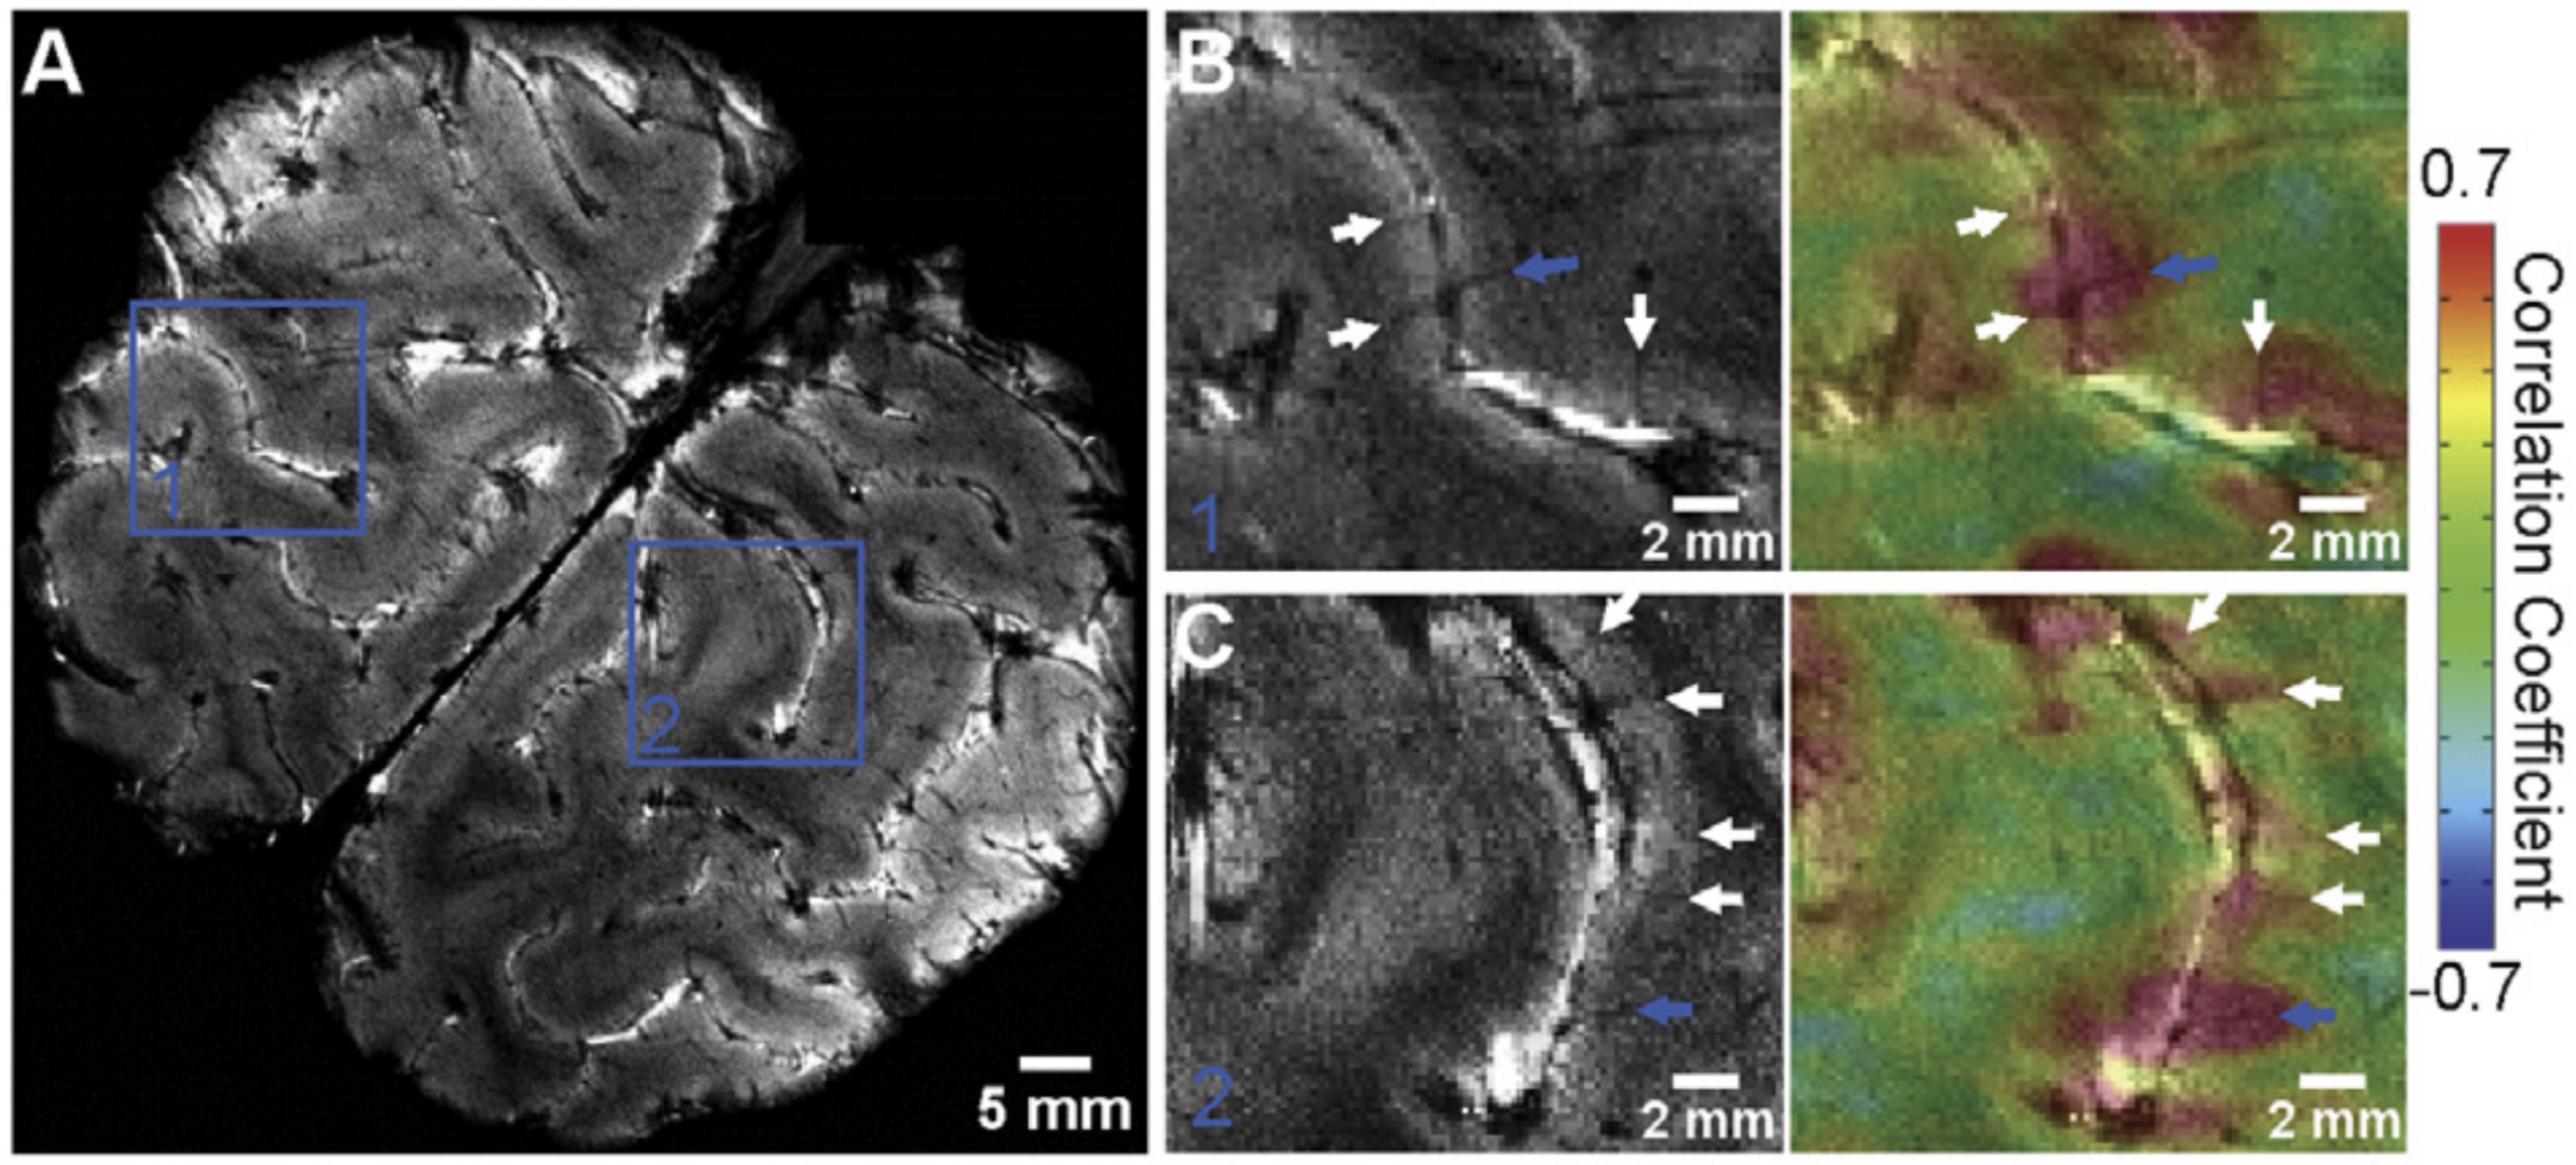
He et al., 2018 // FIG 8 // Meso-arteries and veins visible in a human occipital cortex where fMRI activity of the veins seems to be correlated. In vivo MRI with 190 × 190 × 1000 μm3 voxels.
doi.org/10.1016/j.neuron.2018.01.025
Mattern et al., 2018 // FIG 10 // Human meso-vessels are visible in QSM venogram using maximum intensity projection over 45 slices. In vivo MRI, 0.33 × 0.33 × 0.33 mm3 voxels.
https://doi.org/10.1002/mrm.27509
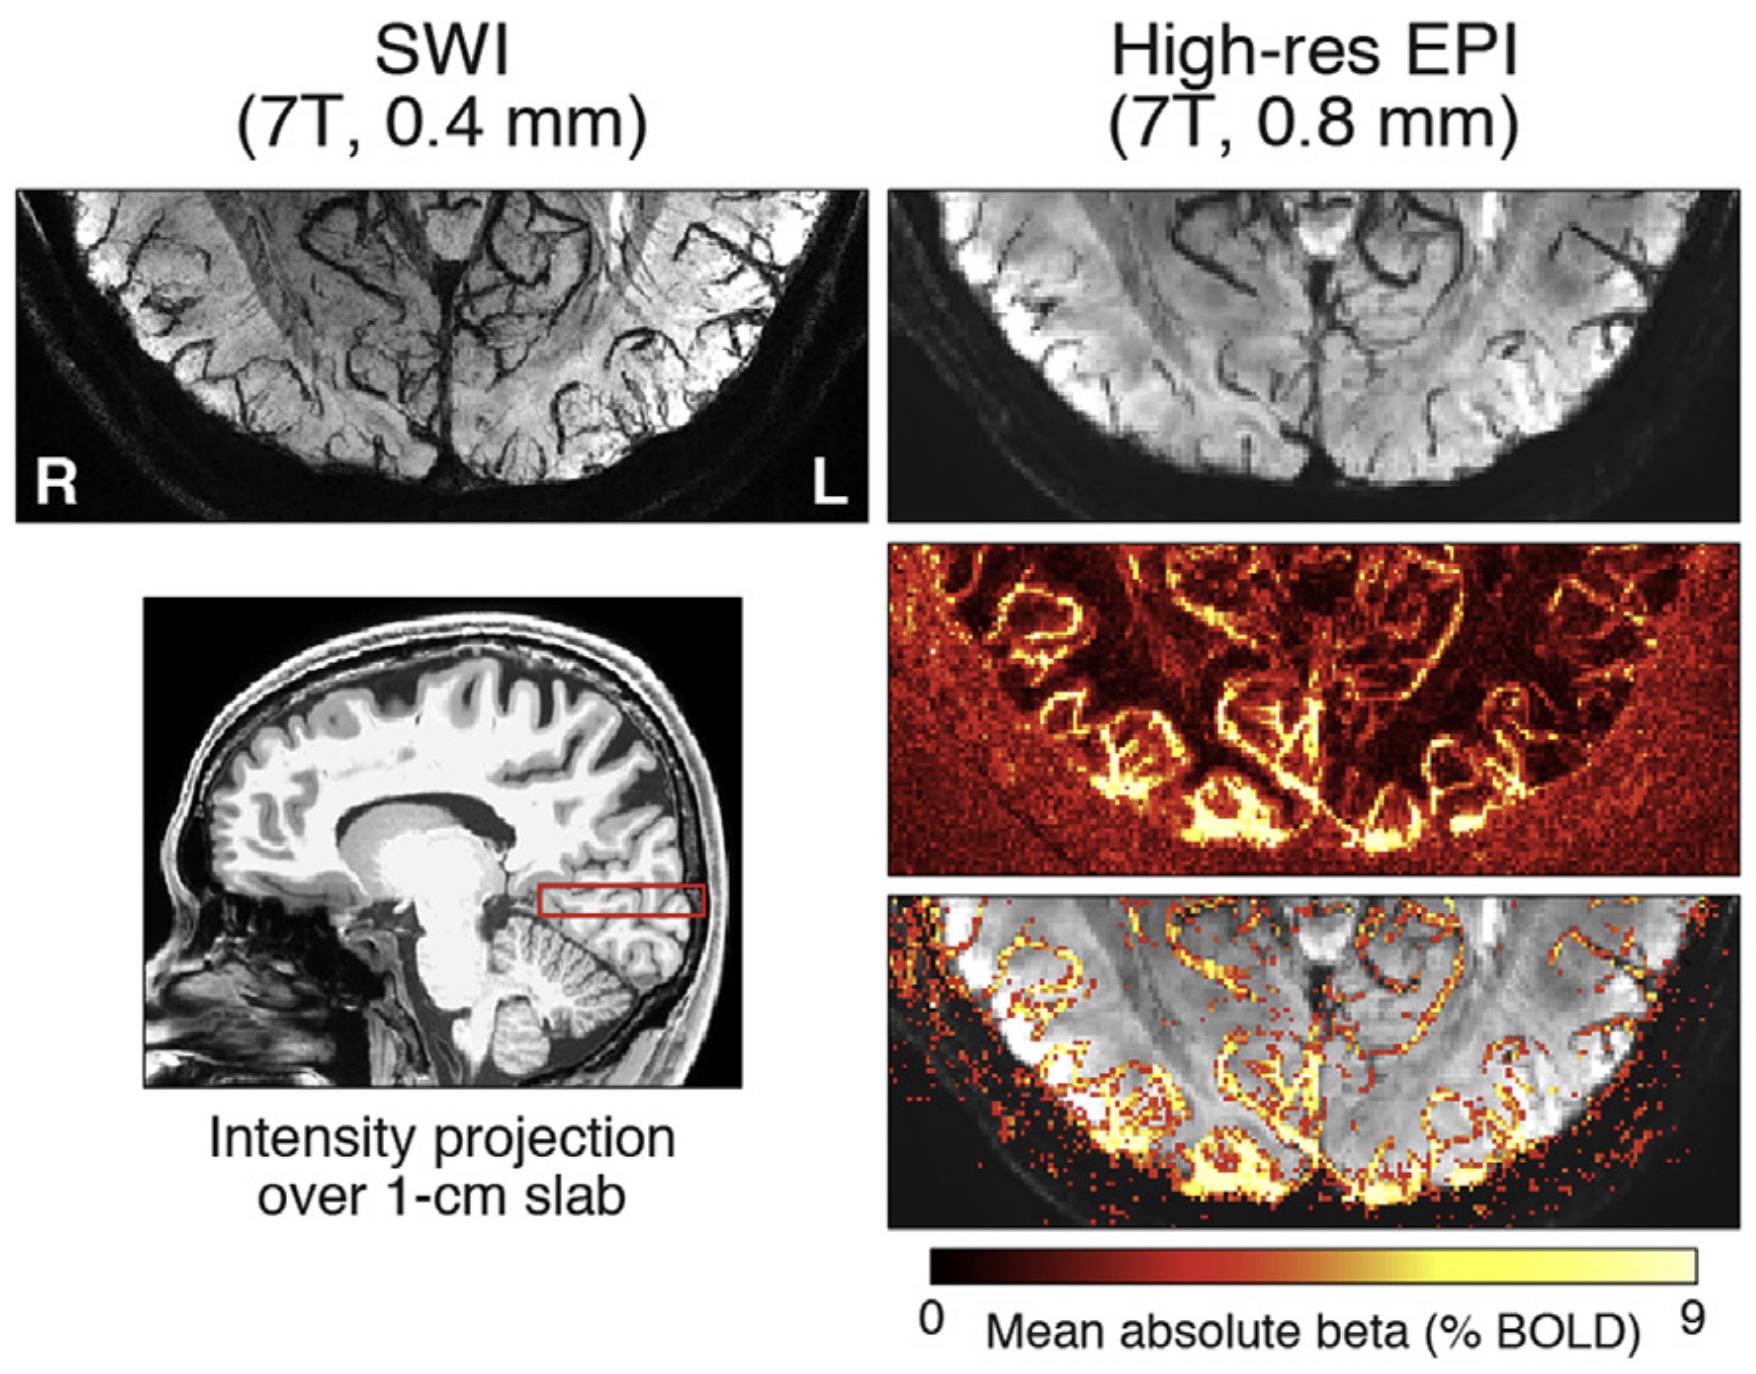
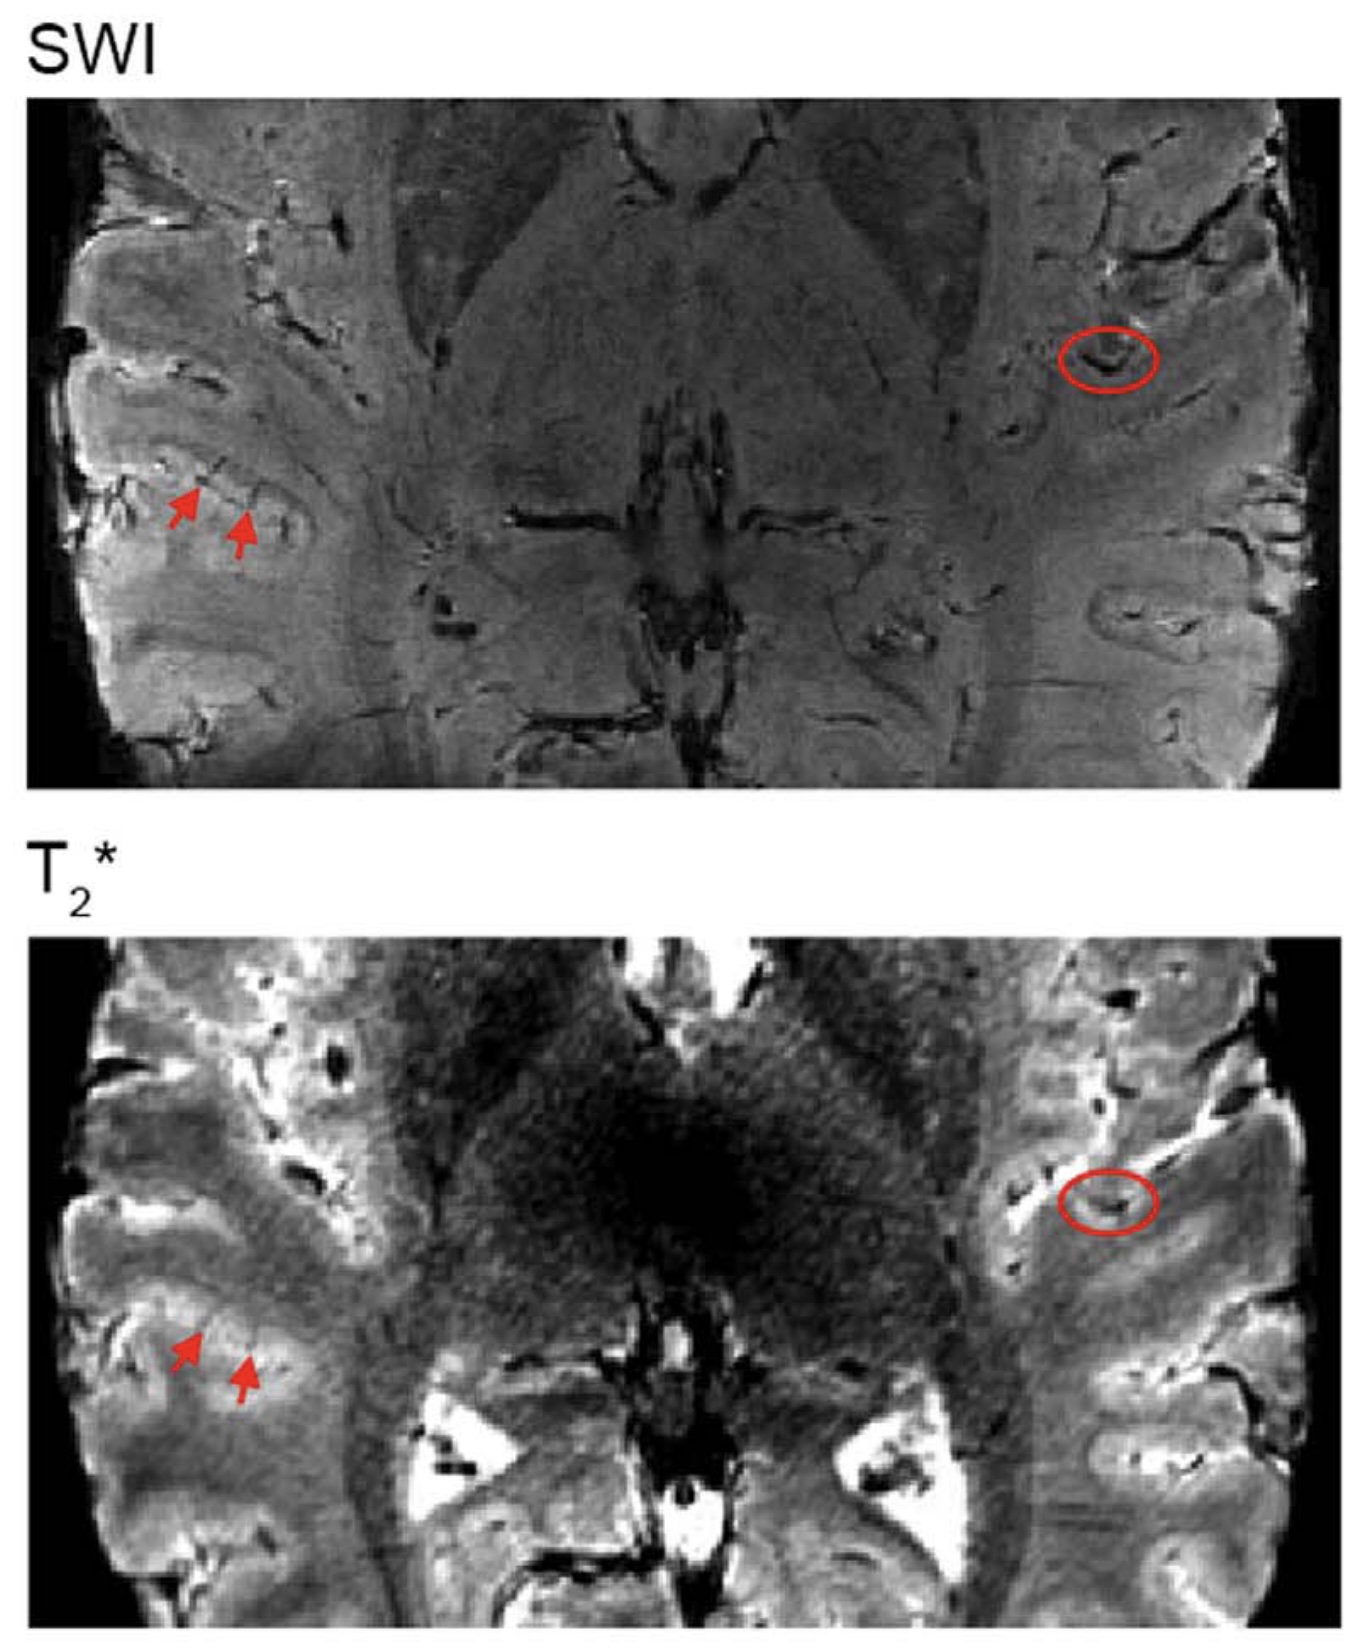
Moerel et al., 2018 // FIG 3 // Intracortical meso-veins (arrows) and pial veins (circle) are visible in SWI and T2* weighted images. In vivo human MRI, 0.4 × 0.4 × 0.4 mm3 voxels for SWI, 0.6 × 0.6 × 0.6 mm3 voxels for T2*-weighted images.
doi.org/10.1016/j.neuroimage.2017.03.063
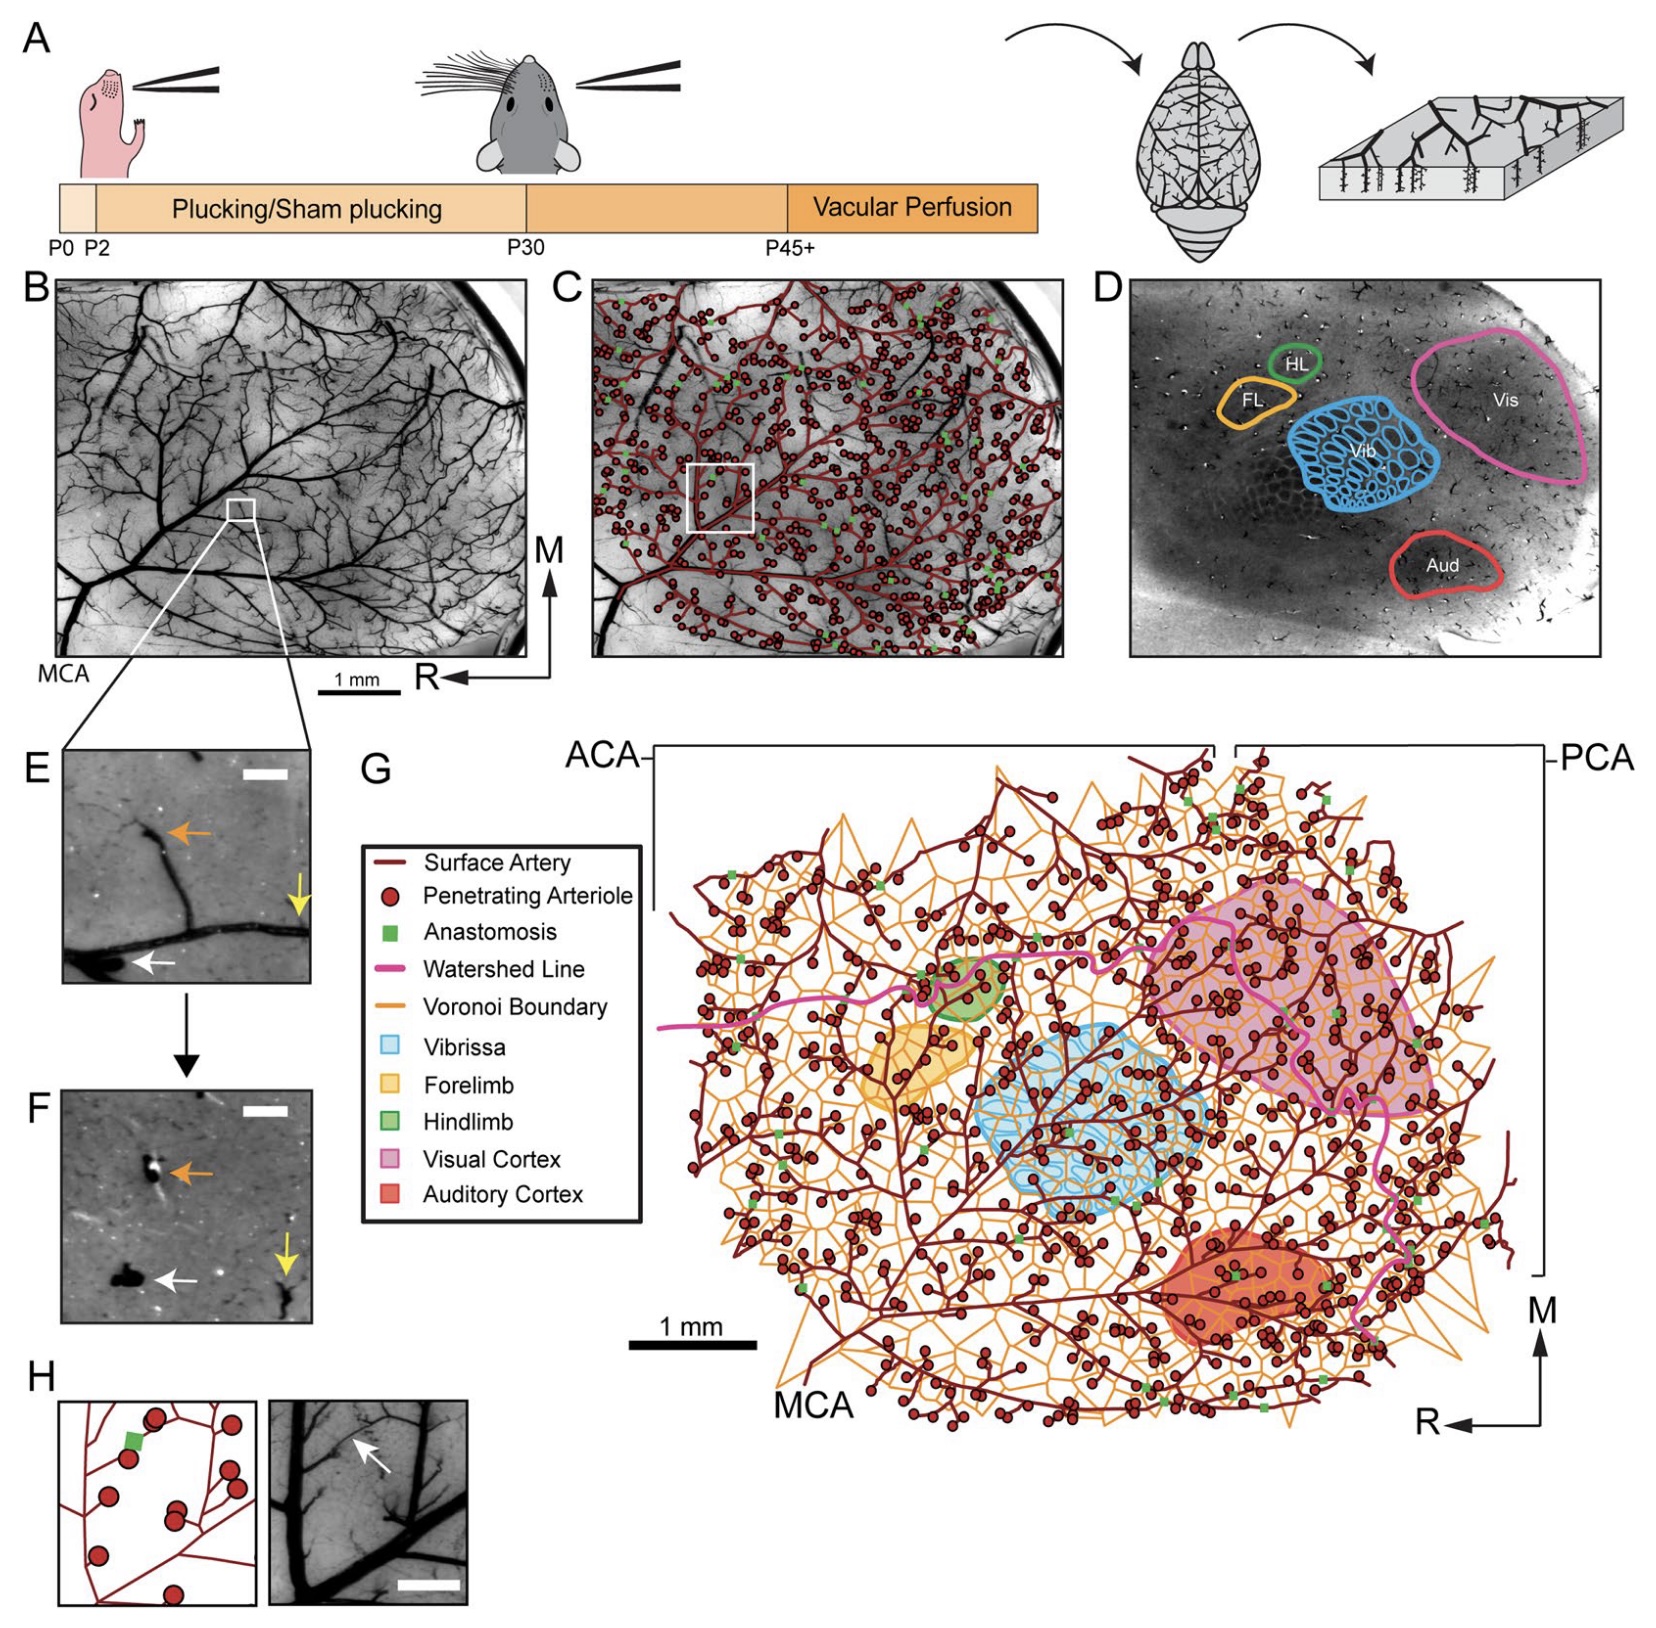
Adams et al., 2018 // FIG 1 // Mice pial arterial network reconstruction. The white scale bars are 0.25 mm.
doi.org/10.1038/s41598-018-27910-3
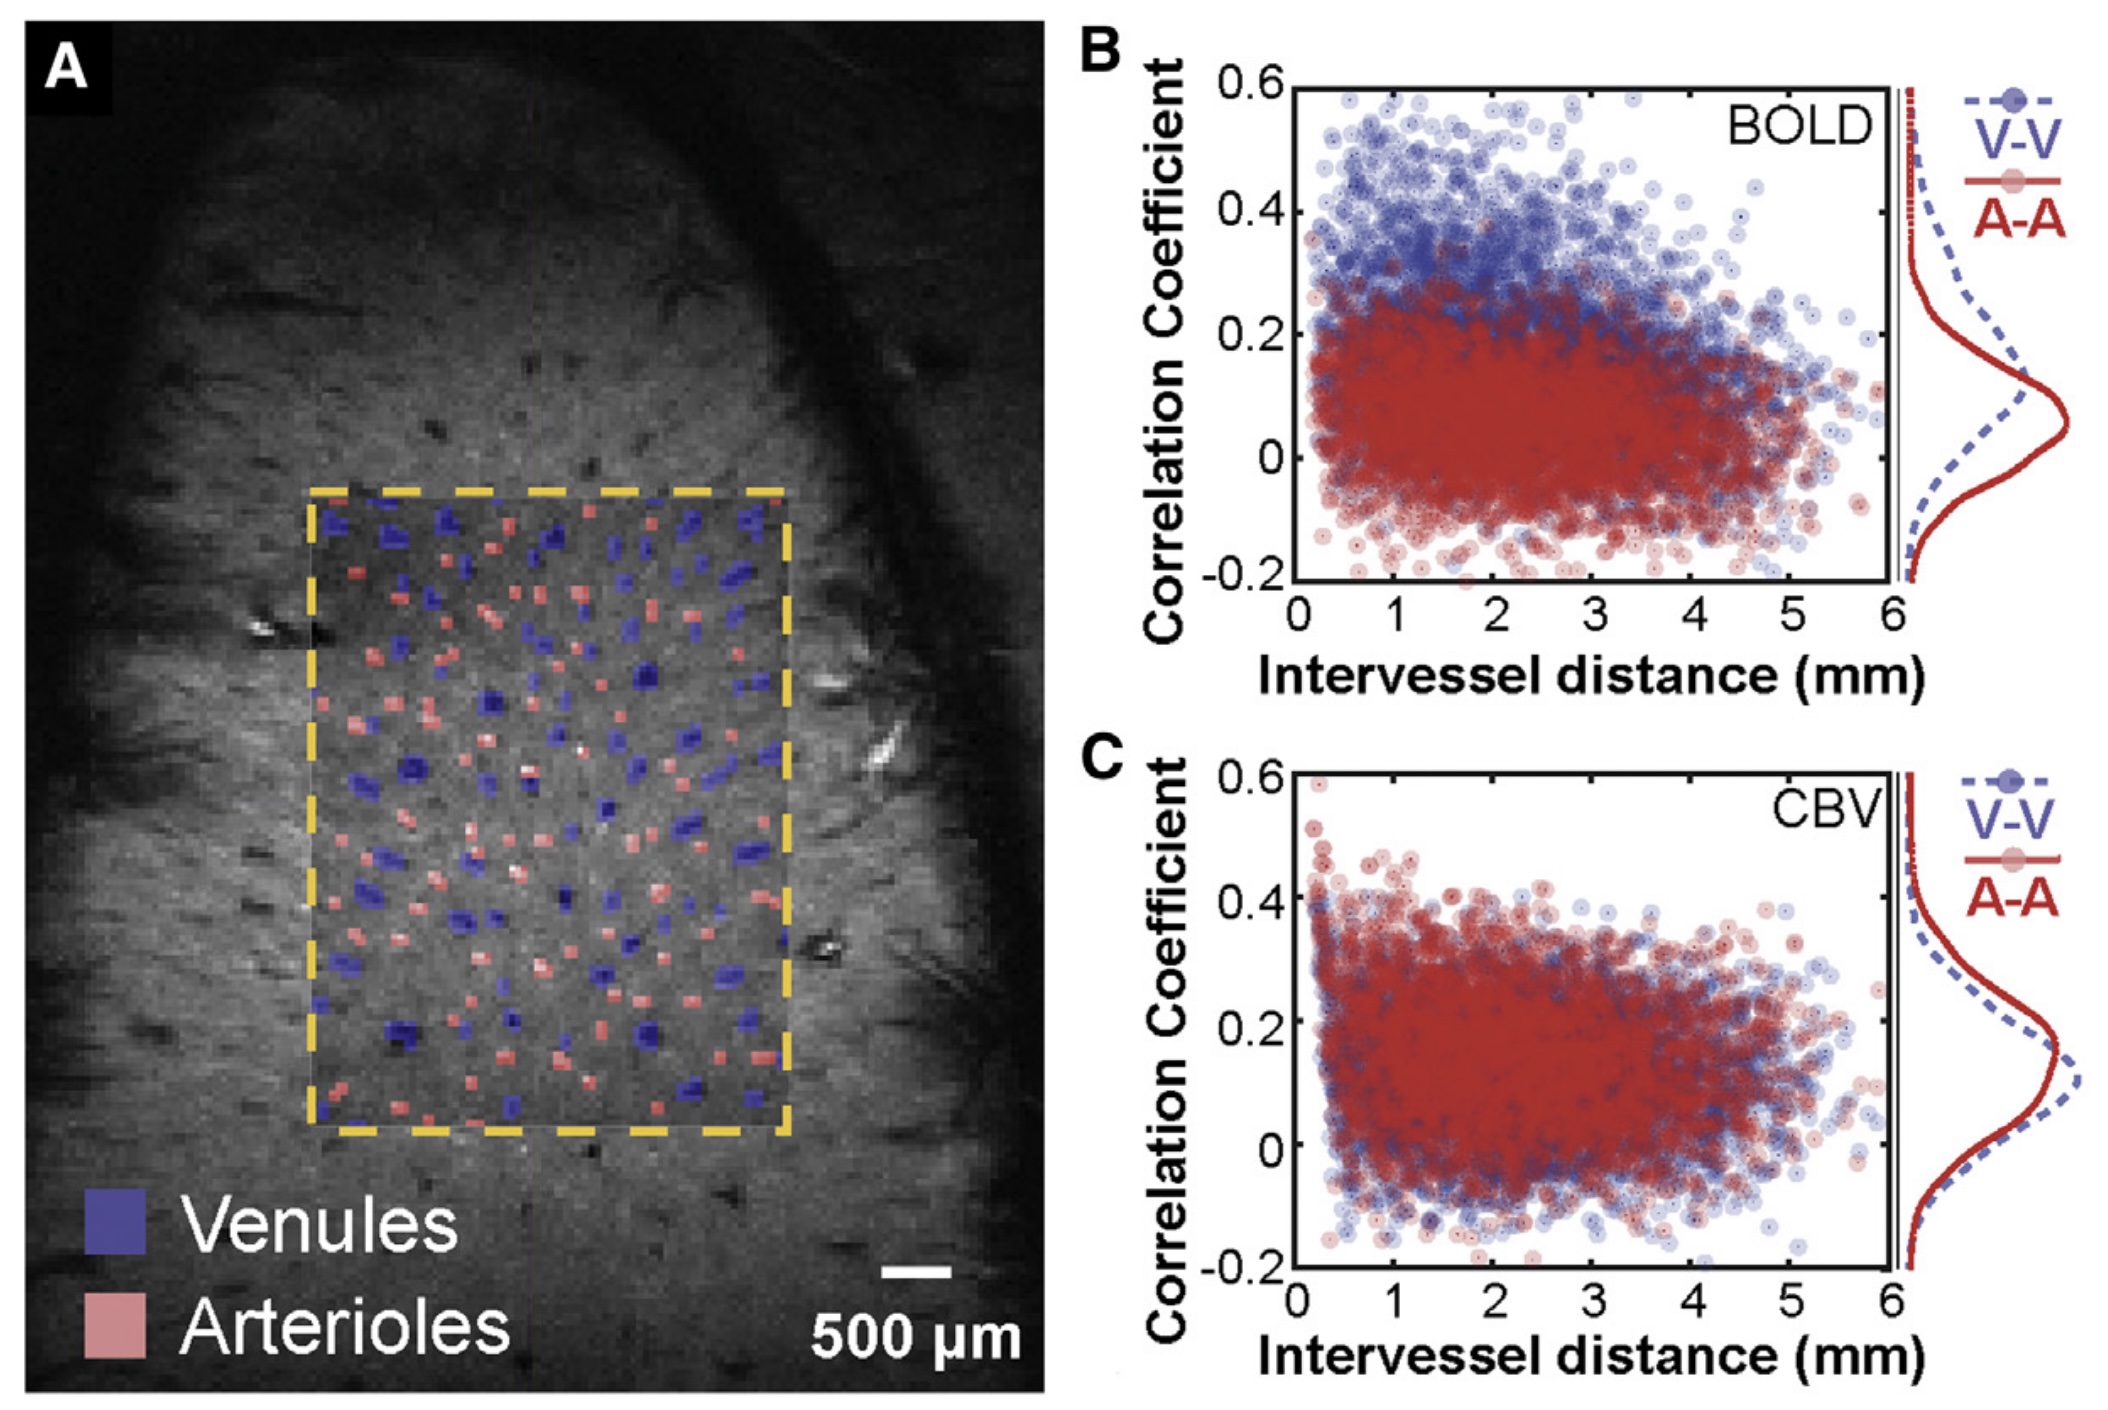
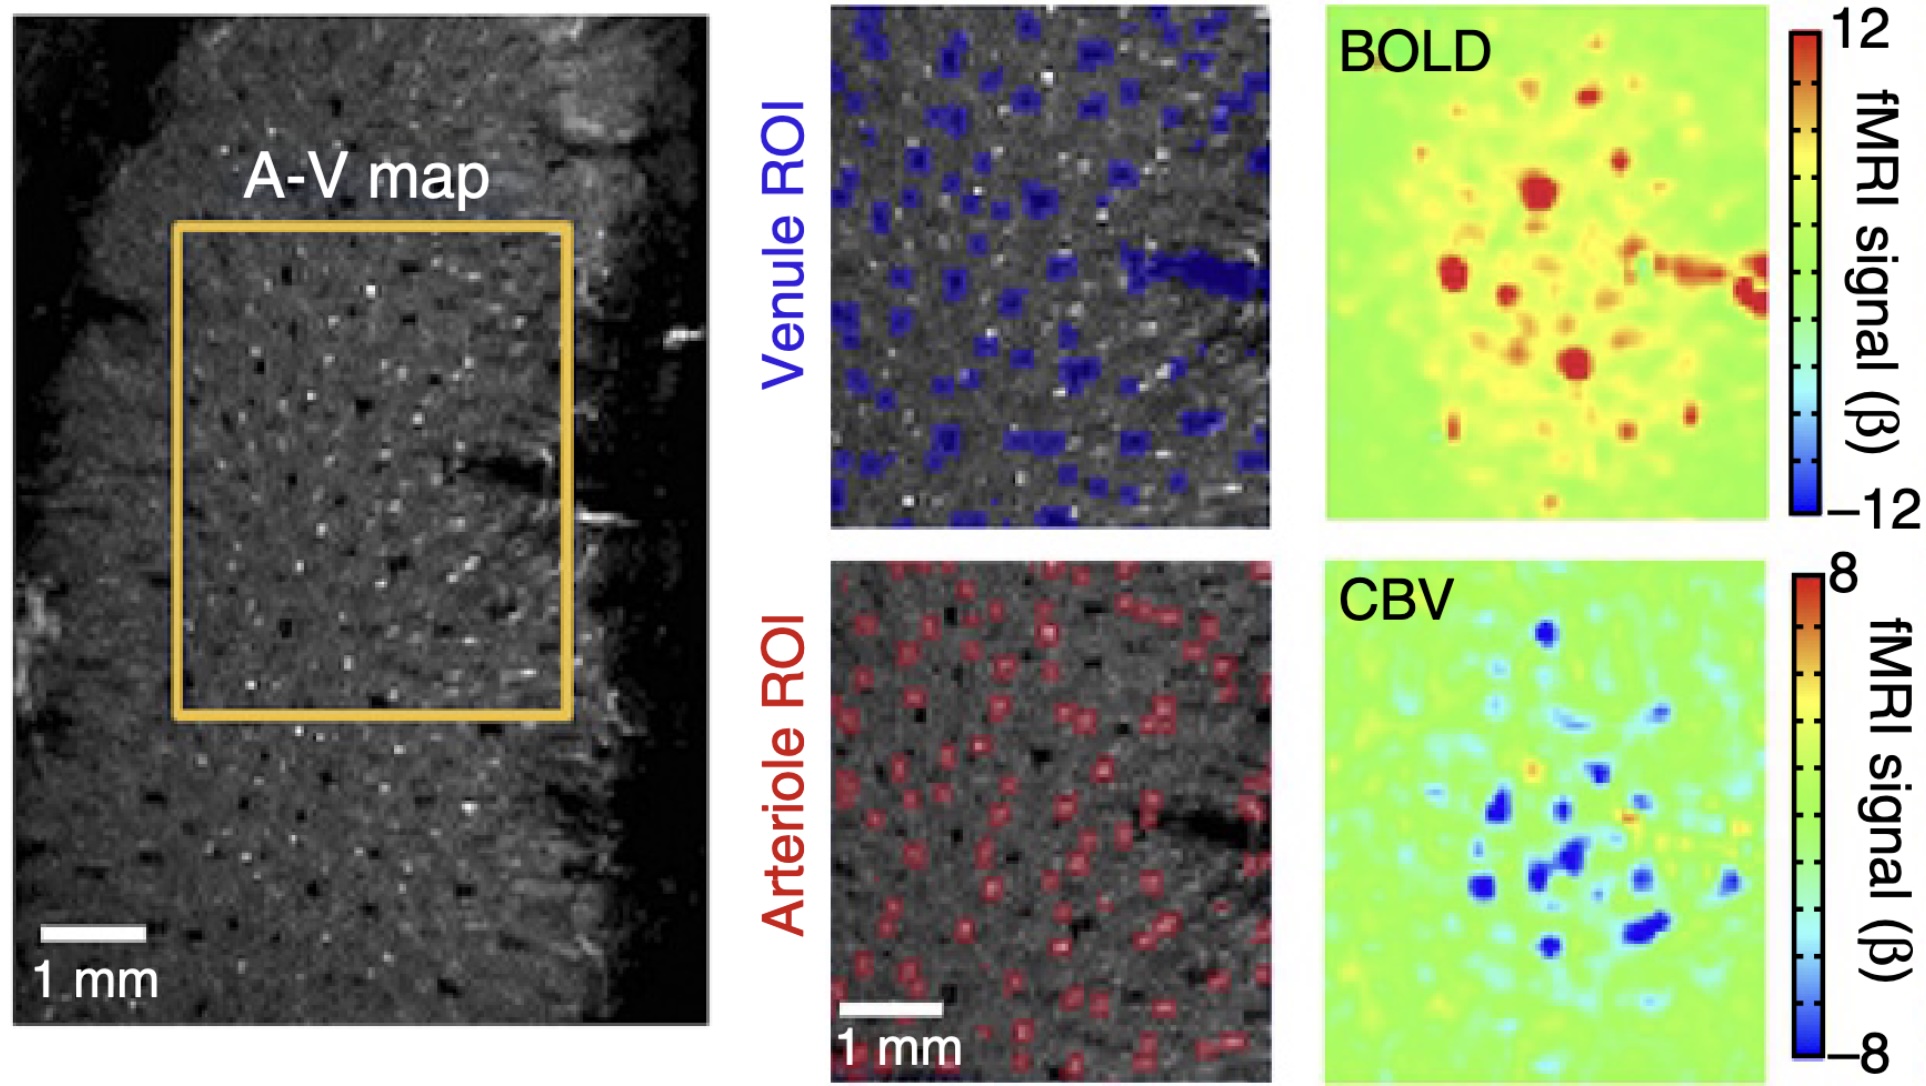
Yu et al., 2016 // FIG 1 // Single vessel fMRI showing BOLD fluctuations around meso-veins and CBV fluctuations around meso-arteries in rats. In vivo MRI with 50 × 50 × 500 μm3 for anatomical and 150 × 150 × 500 μm3 voxels for functional imaging.
doi.org/10.1038/nmeth.3765
Federau, Gallichan, 2016 // FIG 2 // See the bottow row for labeled vessels. This is the first openly accessible dataset where meso-veins can be seen for an entire human brain when downloaded. In vivo MRI, 350 × 350 × 350 μm3 voxels.
doi.org/10.1038/nmeth.3765
Adams et al., 2015 // FIG 3 // Intracortical meso-vessels in layer 3 togetherwith the pial vessels in macaque visual cortex. Post mortem imaging.
doi.org/10.1093/cercor/bhu221
Adams et al., 2015 // FIG 4 // One central vein is surrounded by six arteries. Mean distance from arteries to the vein is 280 μm. Post mortem imaging.
doi.org/10.1093/cercor/bhu221
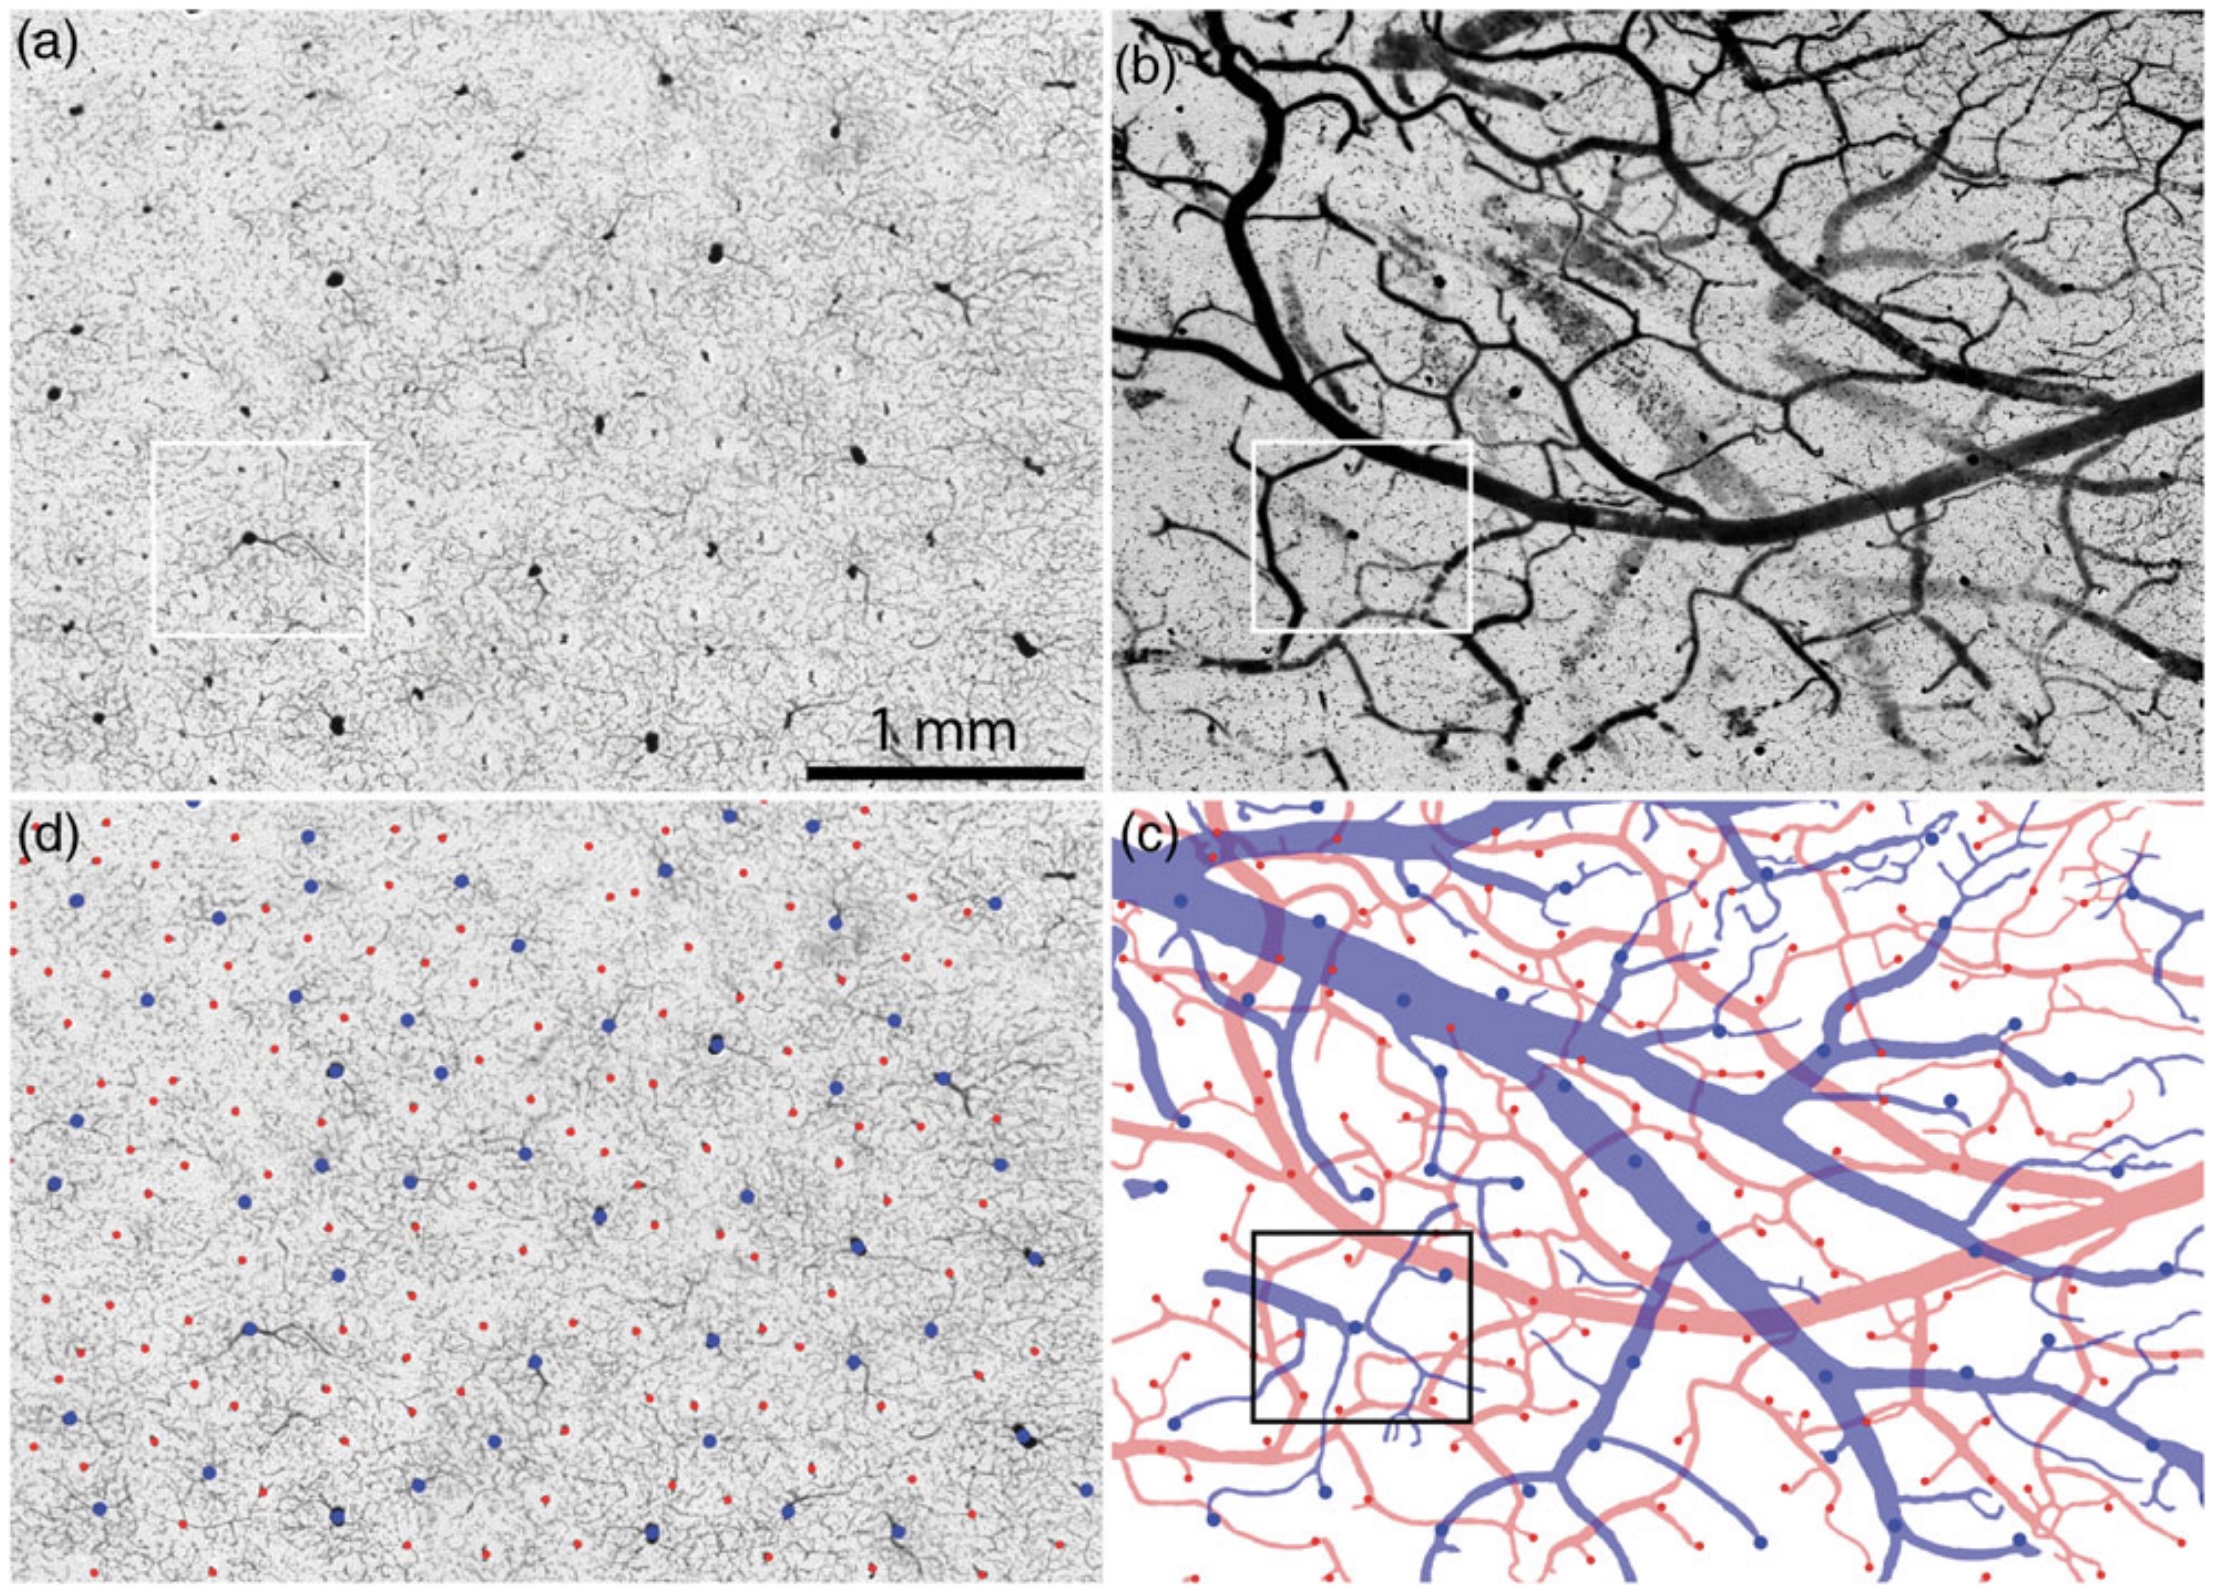
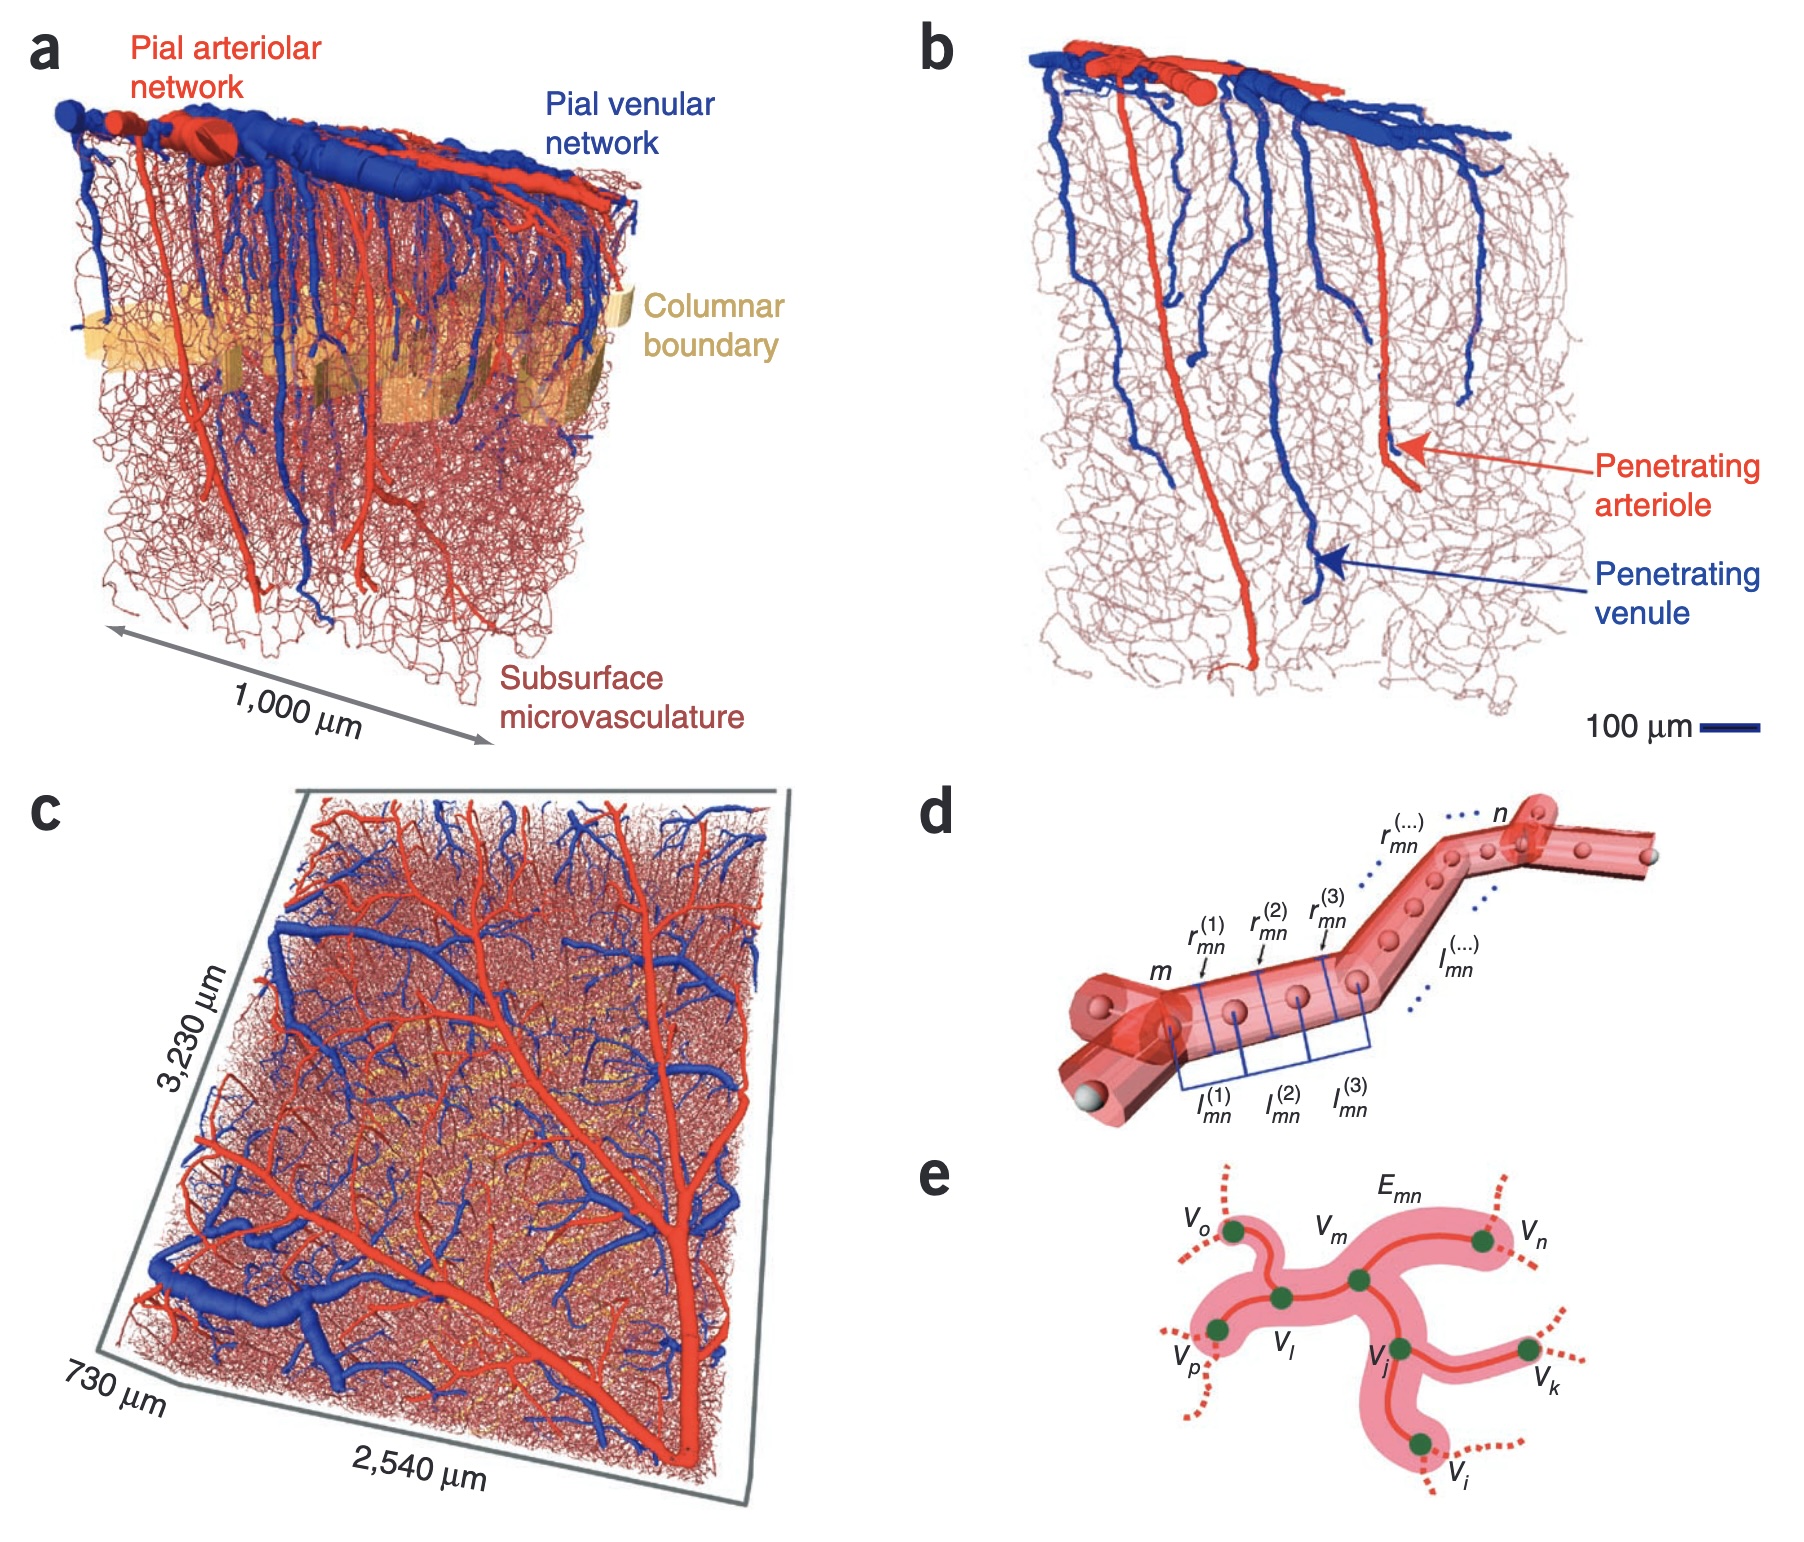
Blinder et al., 2013 // FIG 1 // Mice cortical angiome. Two-photon imaging.
doi.org/10.1038/nn.3426
Hillman, 2014 // FIG 2 // Schematic cut through of the mammalian cortex.
doi.org/10.1038/nn.3426
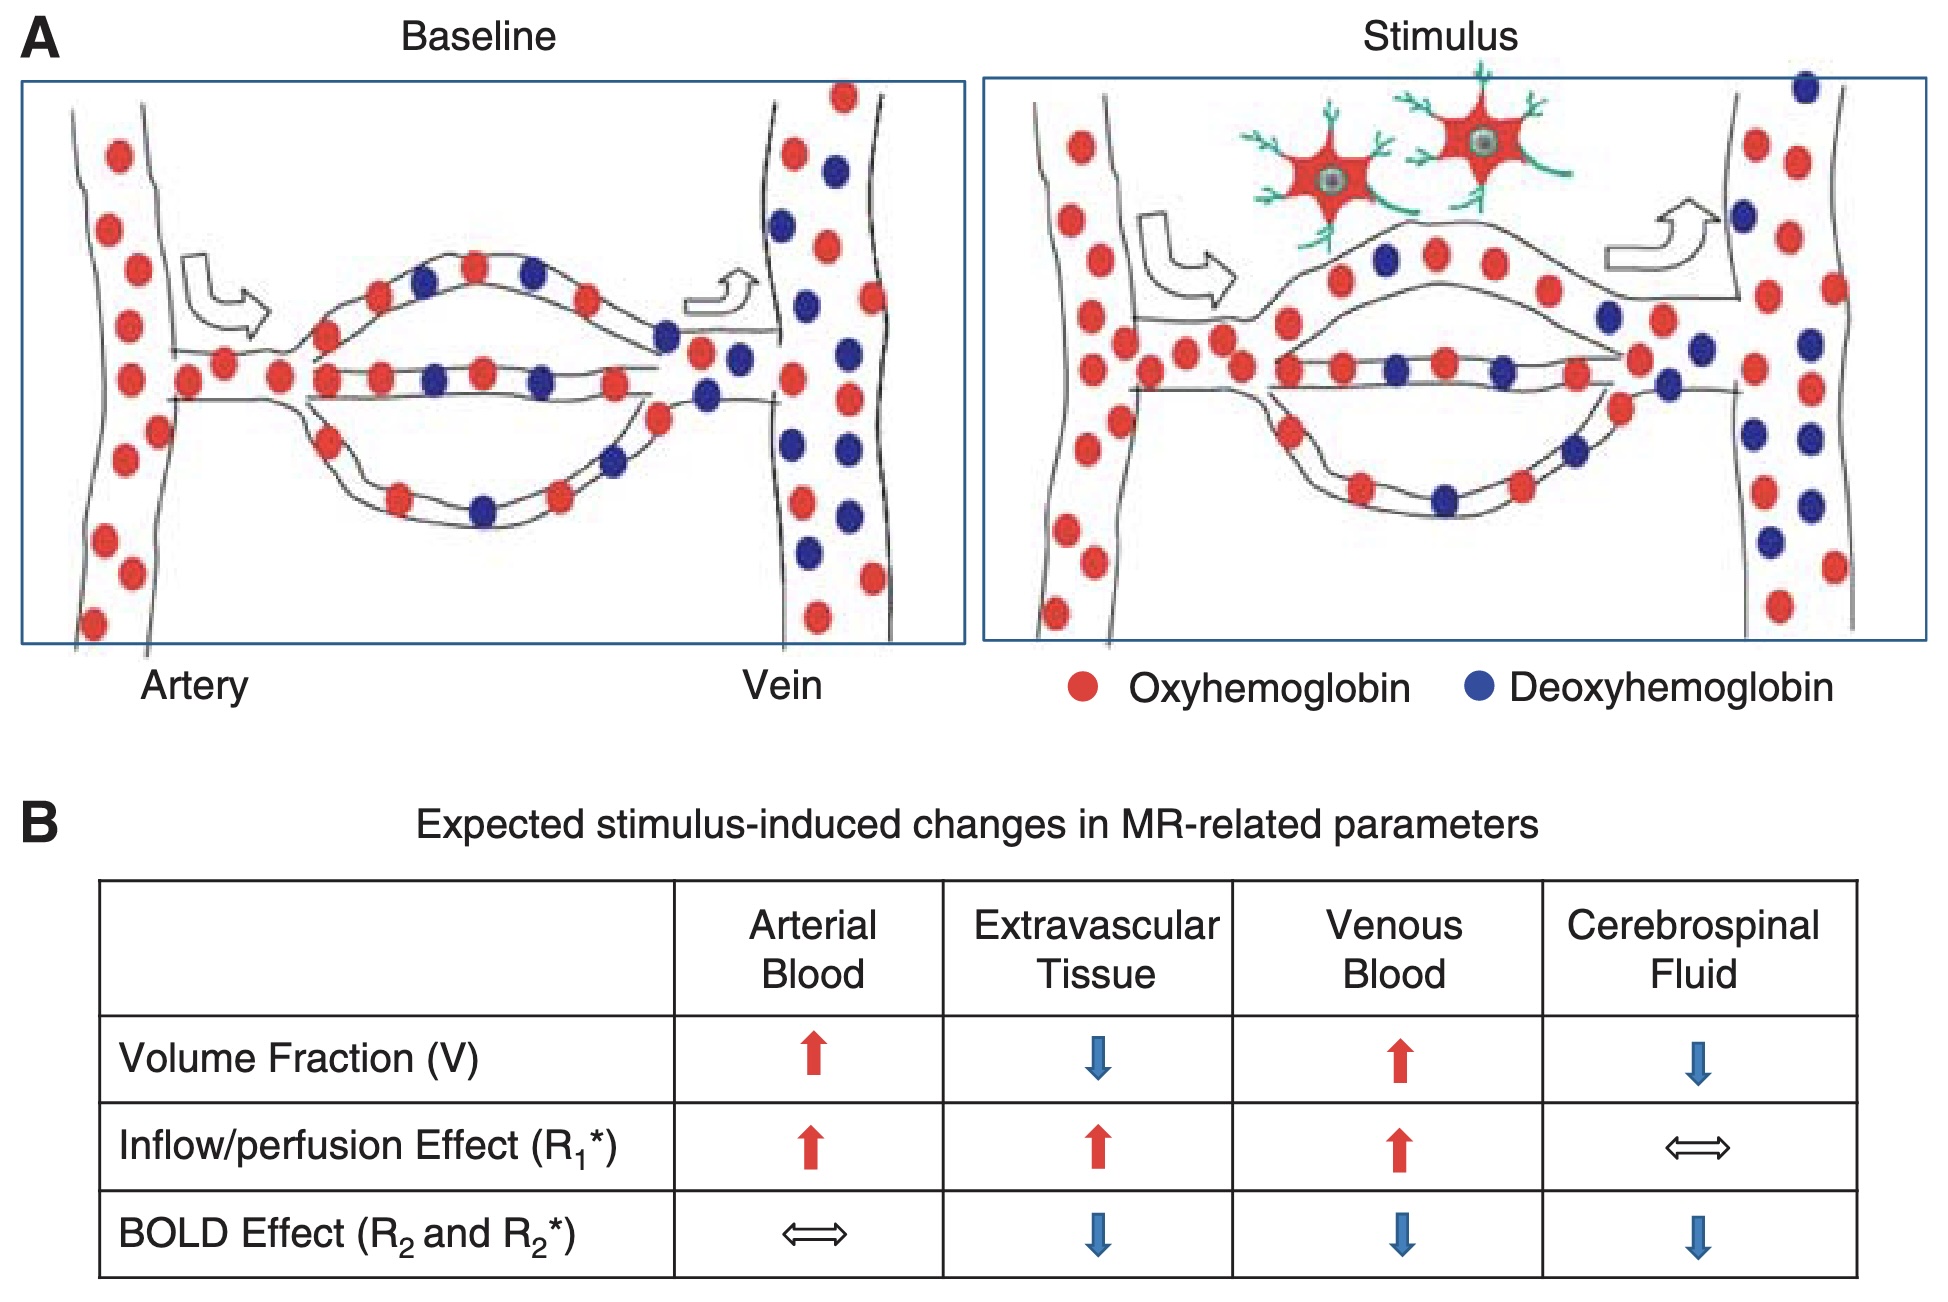
Kim and Ogawa, 2012 // FIG 3 // Vascular responses to neural activity and expected changes to MR-related parameters.
doi.org/10.1038/jcbfm.2012.23
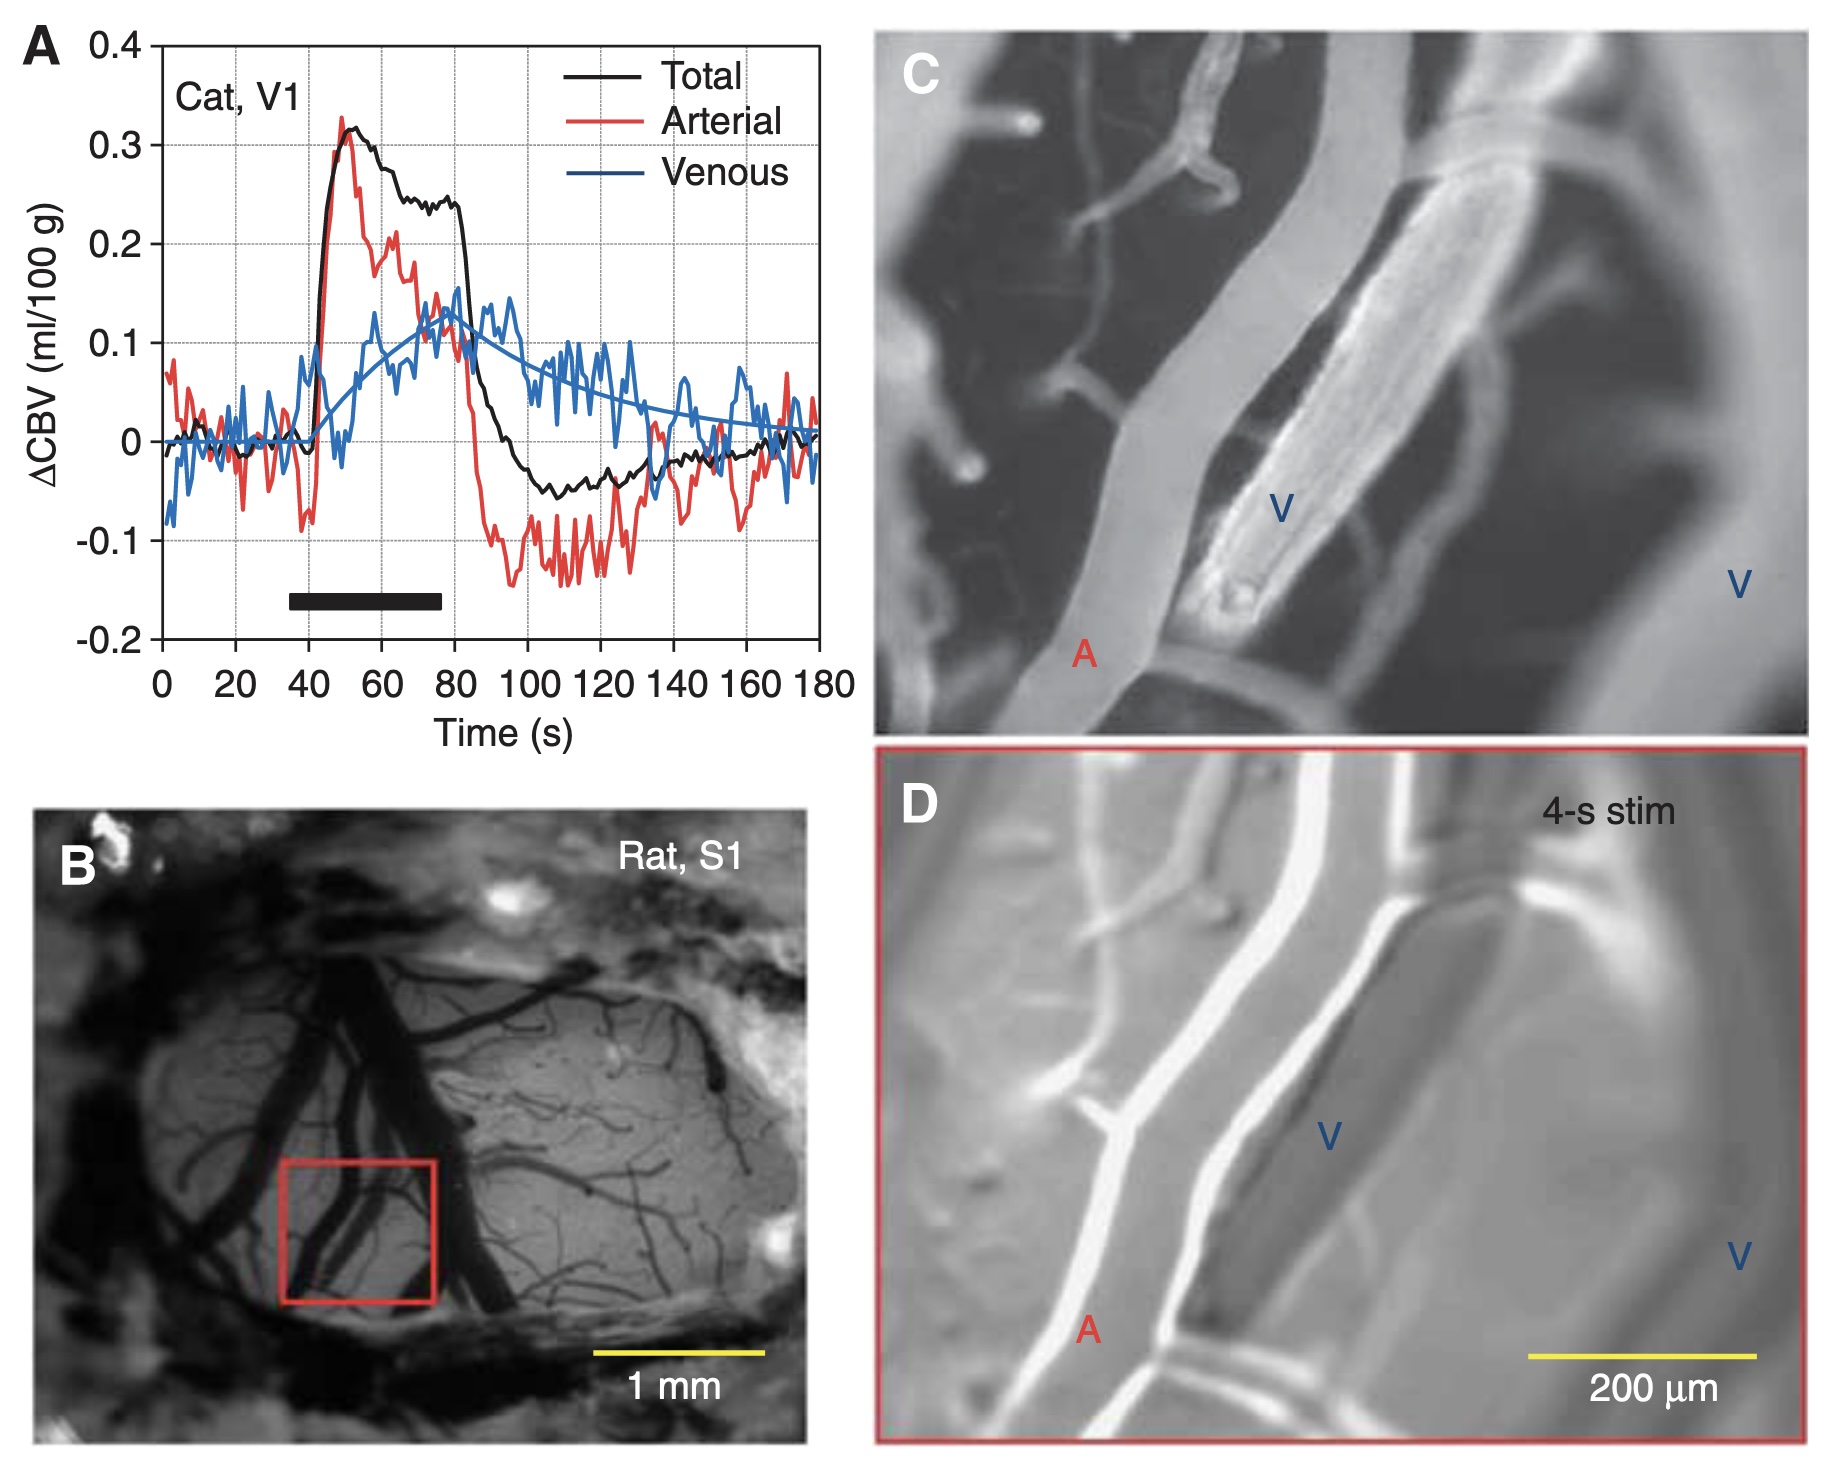
Kim and Ogawa, 2012 // FIG 6 // Compartment-specific CBV changes during sensory stimulus. Panel D shows that the arteries dilate, but the venins do not dilate with a 4 second stimulation.
doi.org/10.1038/jcbfm.2012.23
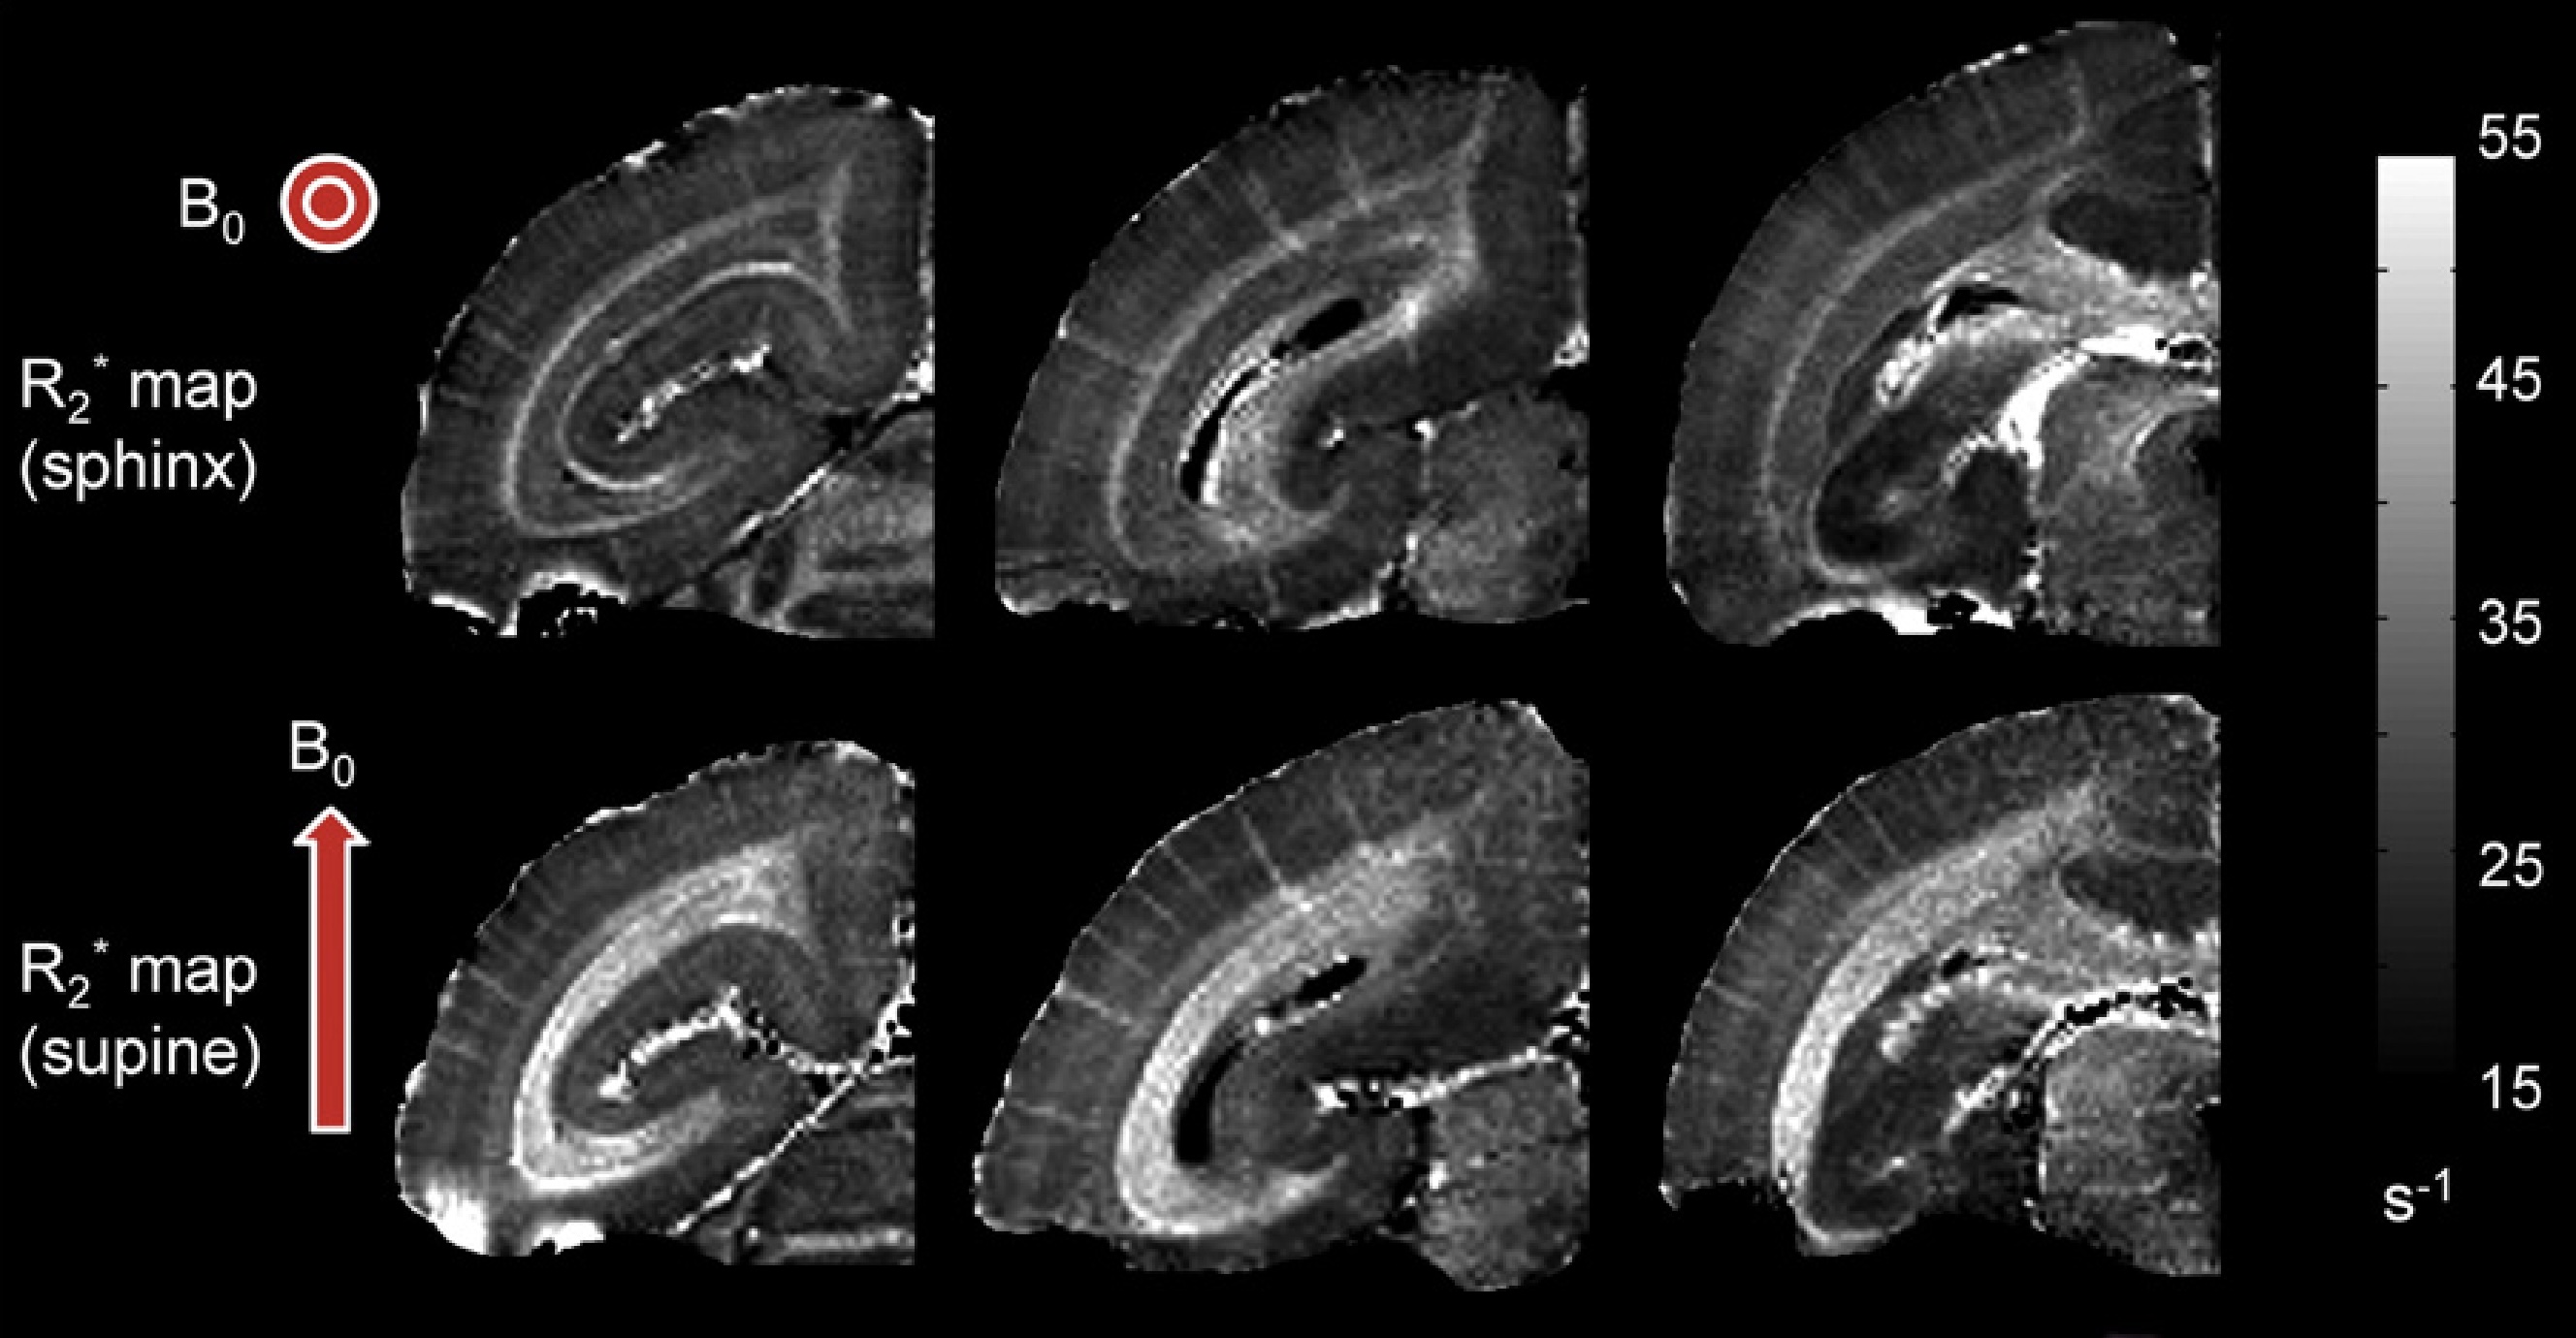
Sati et al., 2012 // FIG 5 // Marmoset intracortical meso-veins are visible even when their orientation relative to the main magnetic field (B0) is changed by 90°.
doi.org/10.1016/j.neuroimage.2011.08.064
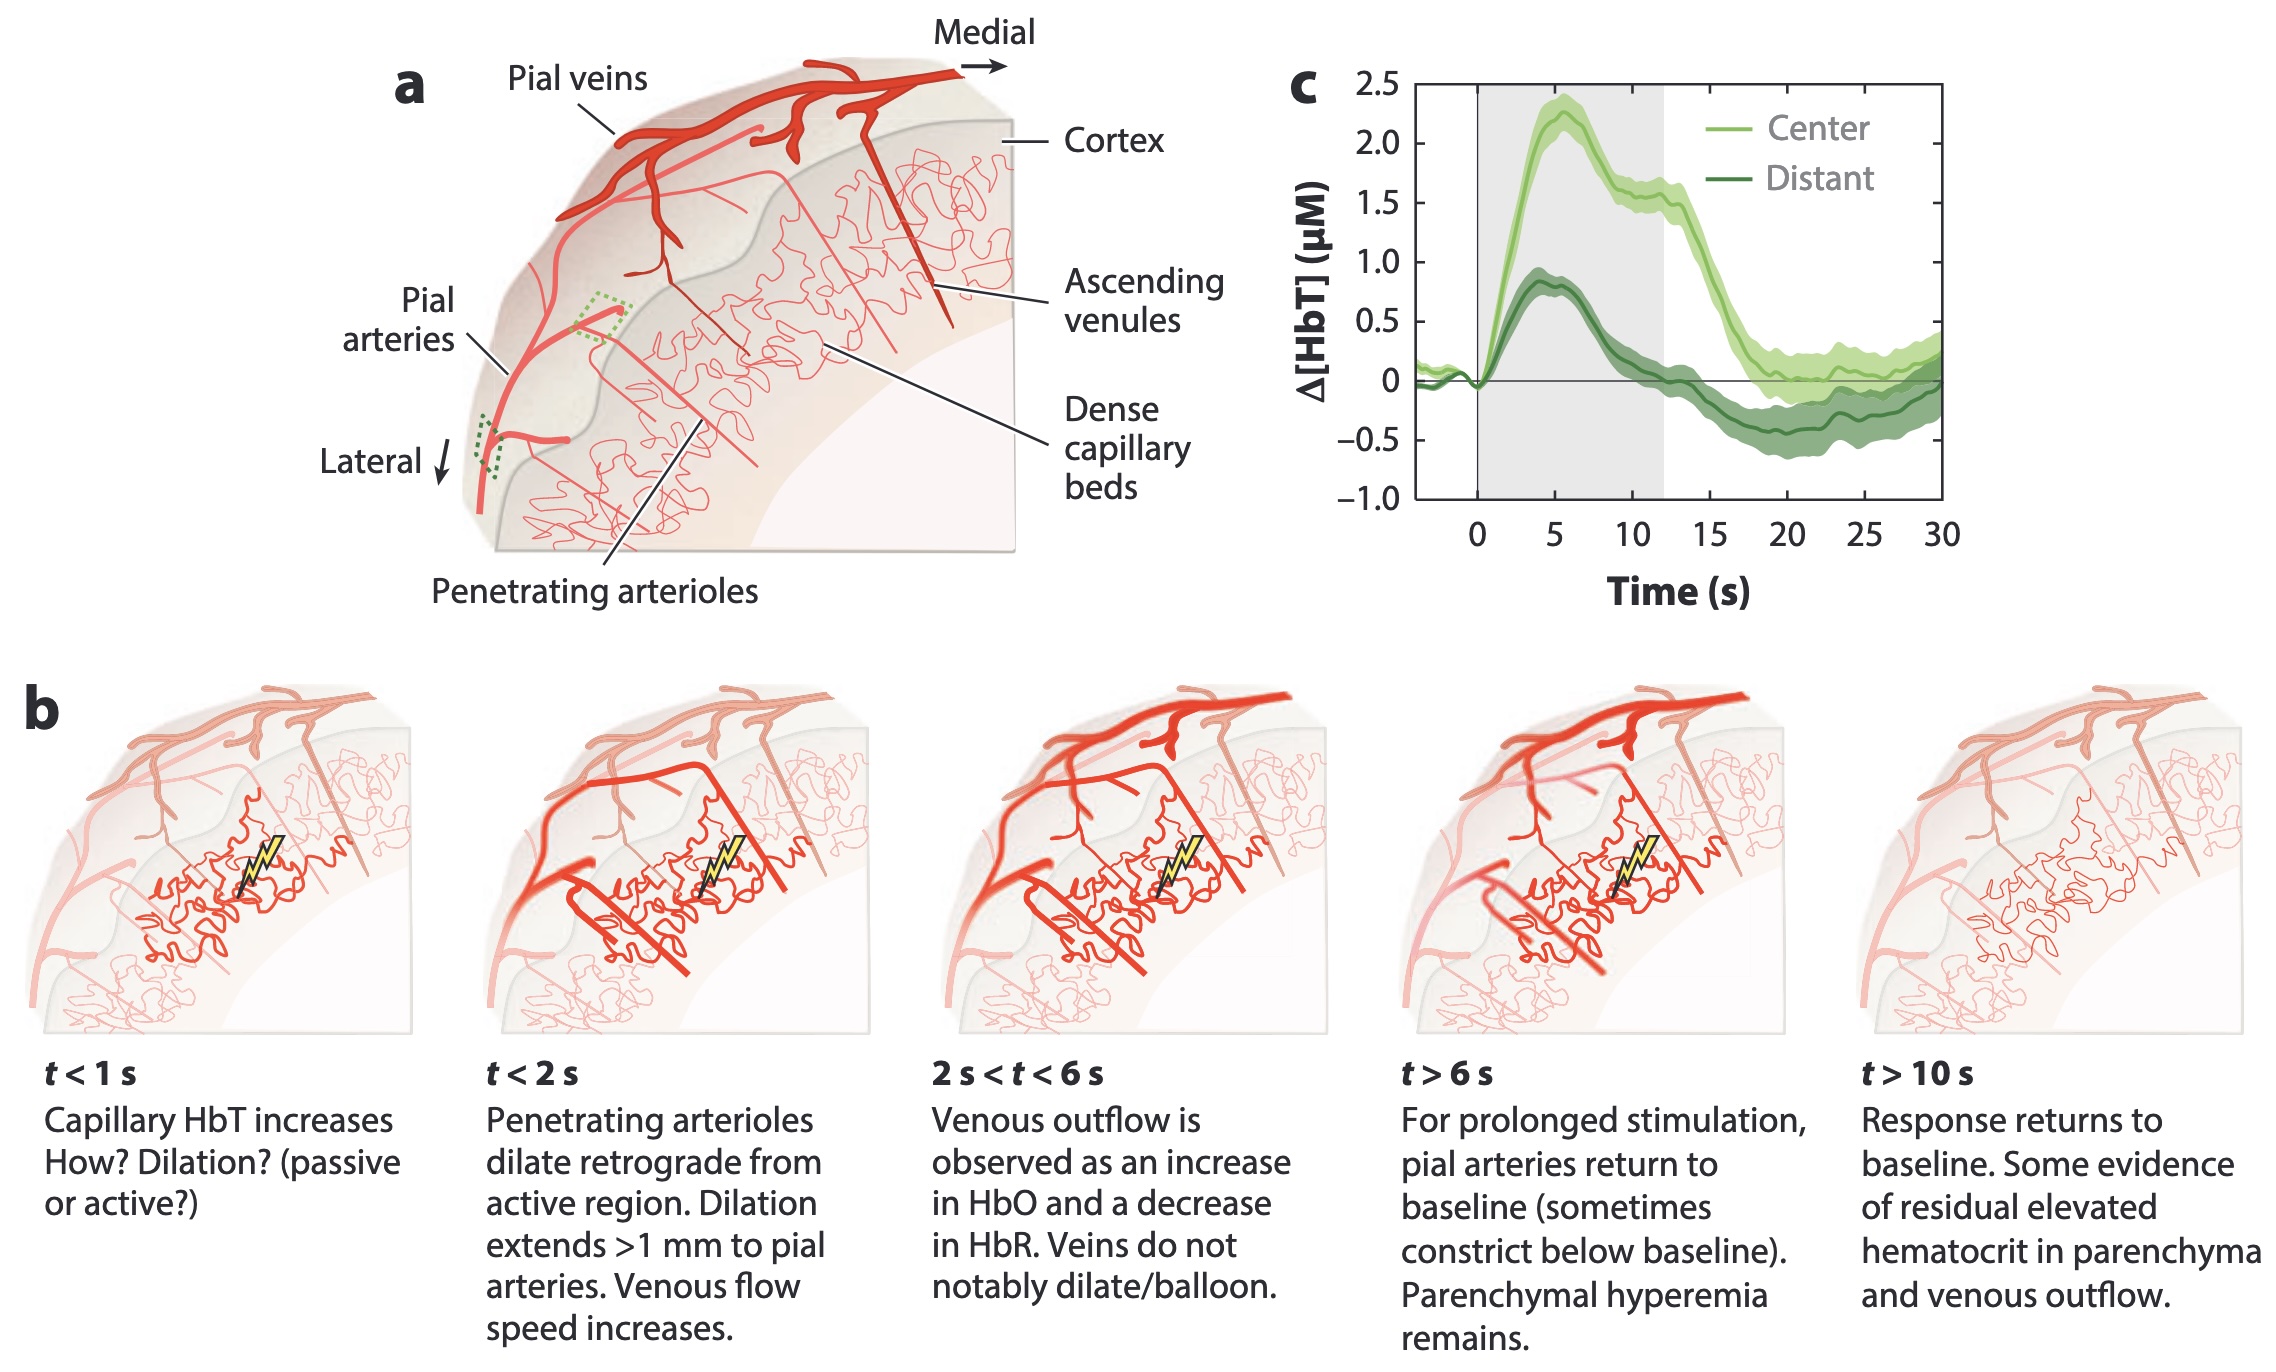
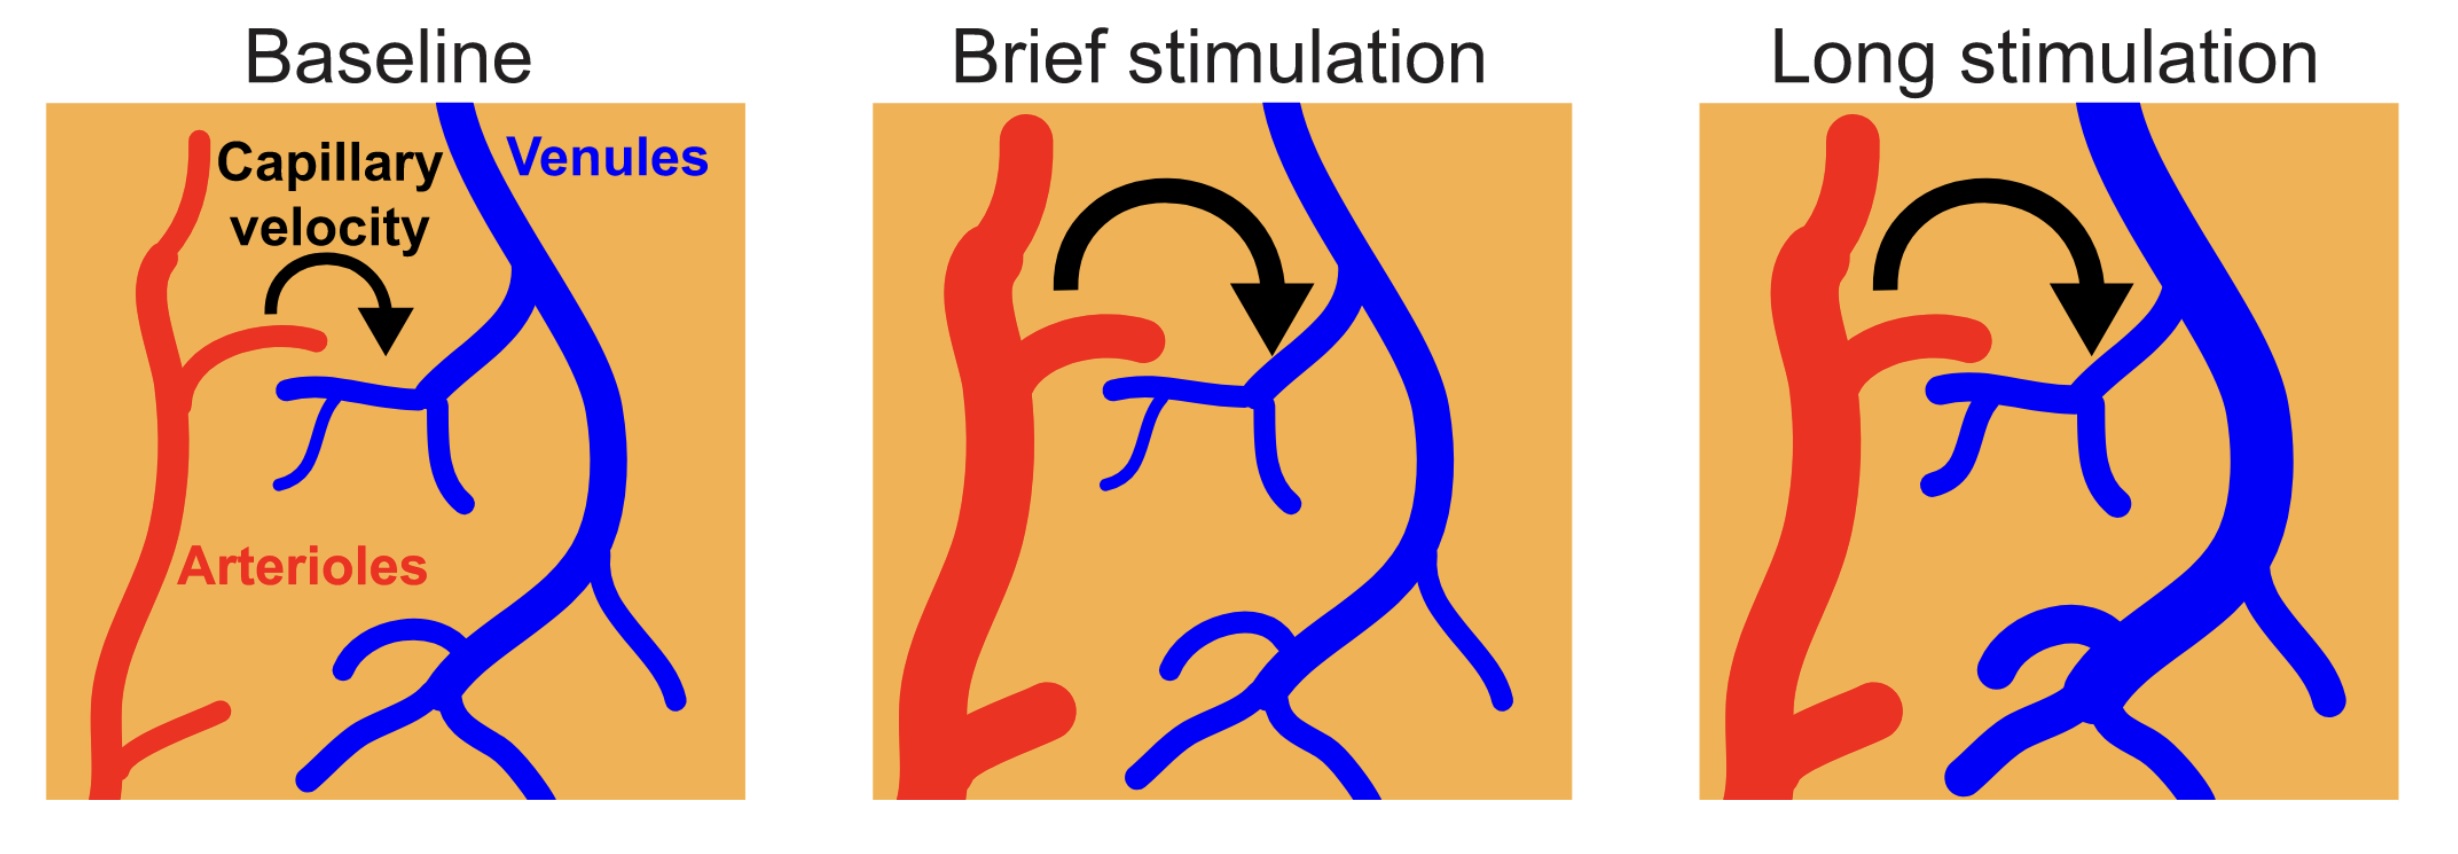
Drew et al., 2011 // FIG 5 // Schematic summary of stimulus-induced changes in the cerebral vasculature. Brief stimulation leads only to arteriole distension, whereas a prolonged period of stimulation leads to an initial increase in arterial distension followed by a rise in capillary flow and finally venous distention.
doi.org/10.1016/j.conb.2019.06.004
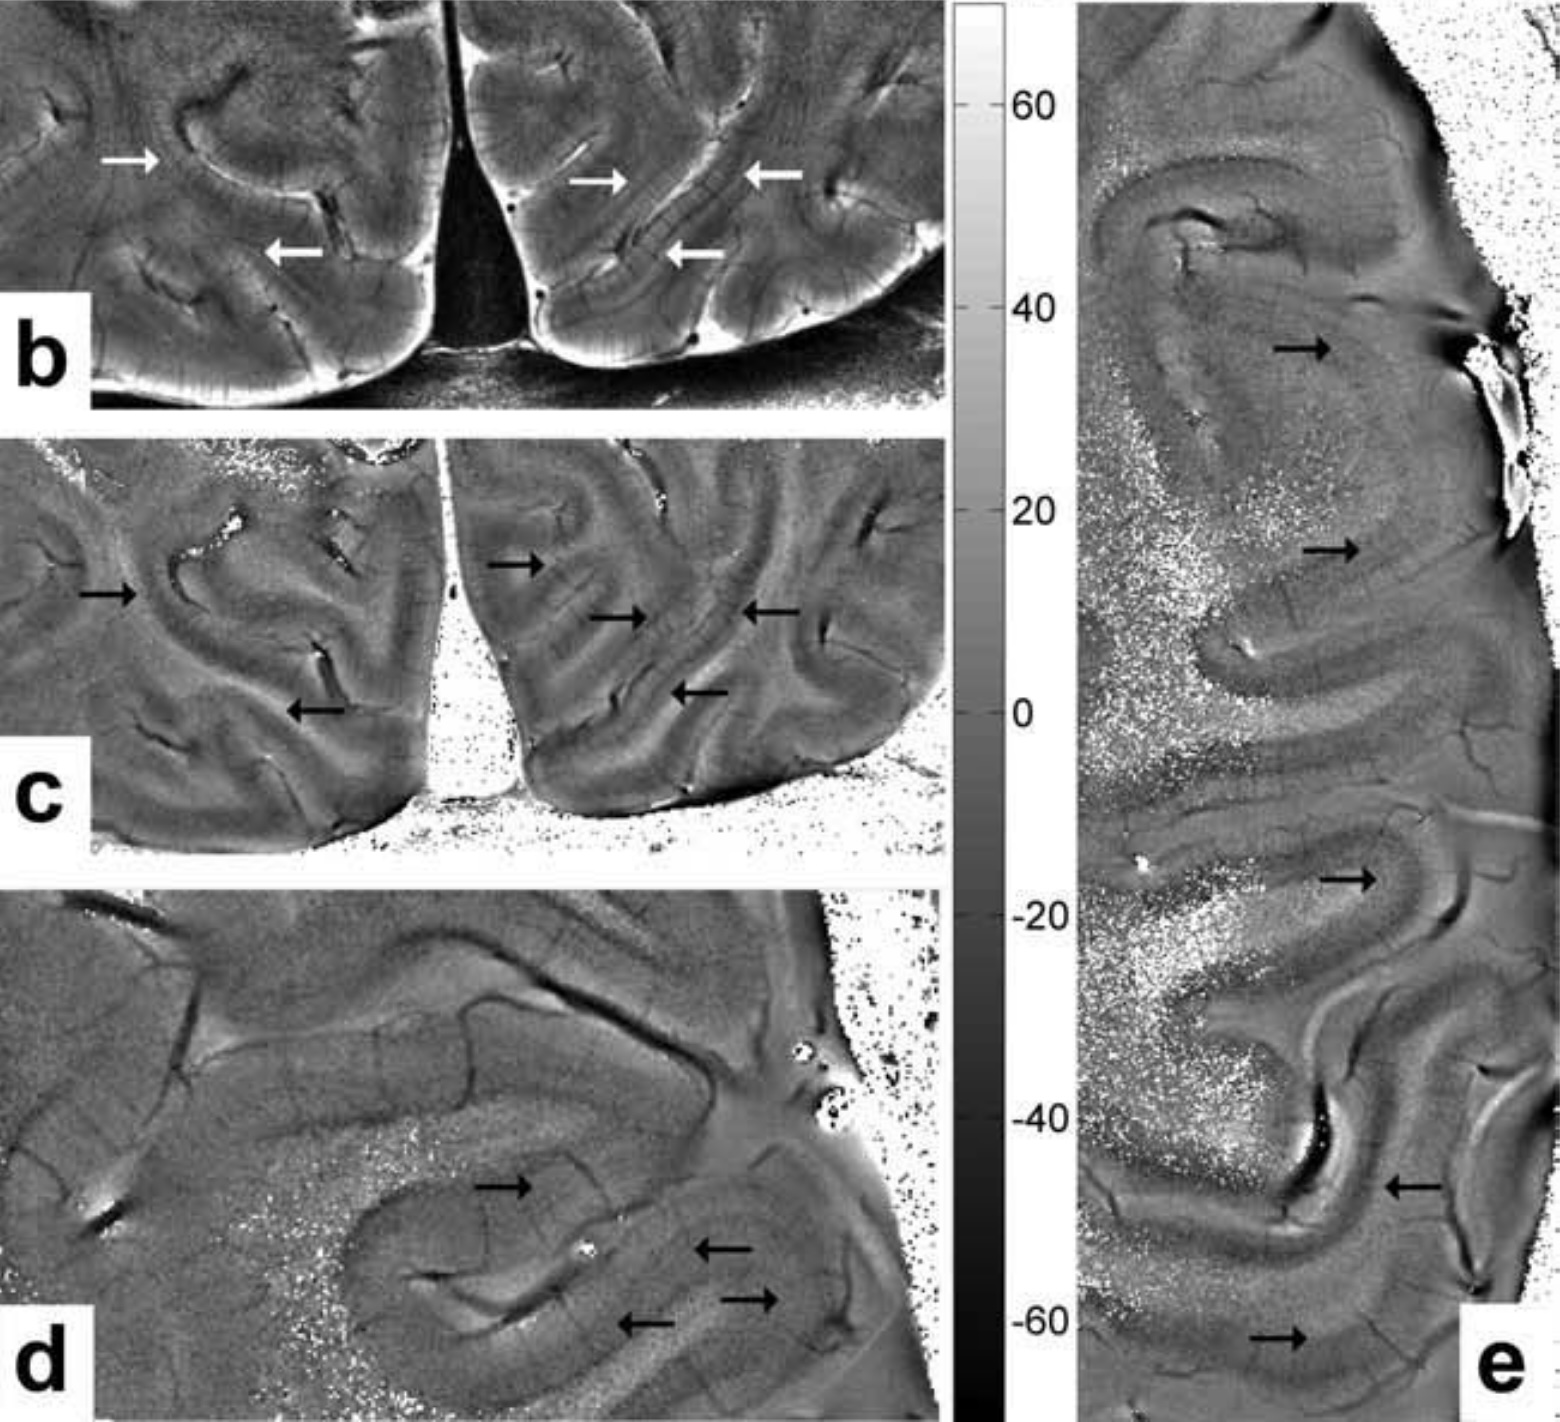
Budde et al., 2011 // FIG 2 // Intracortical meso-vessels visible in magnitude (b) and phase (c-e) images. Arrows indicate intracortical stripes. In vivo MRI, 0.13 × 0.13 × 1.5 mm3 voxels.
doi.org/10.1002/mrm.22632
Zwanenburg et al., 2011 // FIG 1 // Meso-veins are visible as dark dots within white matter and when looked carefully, on the pial surface in 3D EPI magnitude images. In vivo MRI, 0.5 × 0.5 × 0.5 mm3 voxels.
doi.org/10.1016/j.neuroimage.2011.03.046
Nowinski et al., 2011 // FIG 2 // A 3D human cerebrovascular model.
doi.org/10.1016/j.neuroimage.2010.12.079
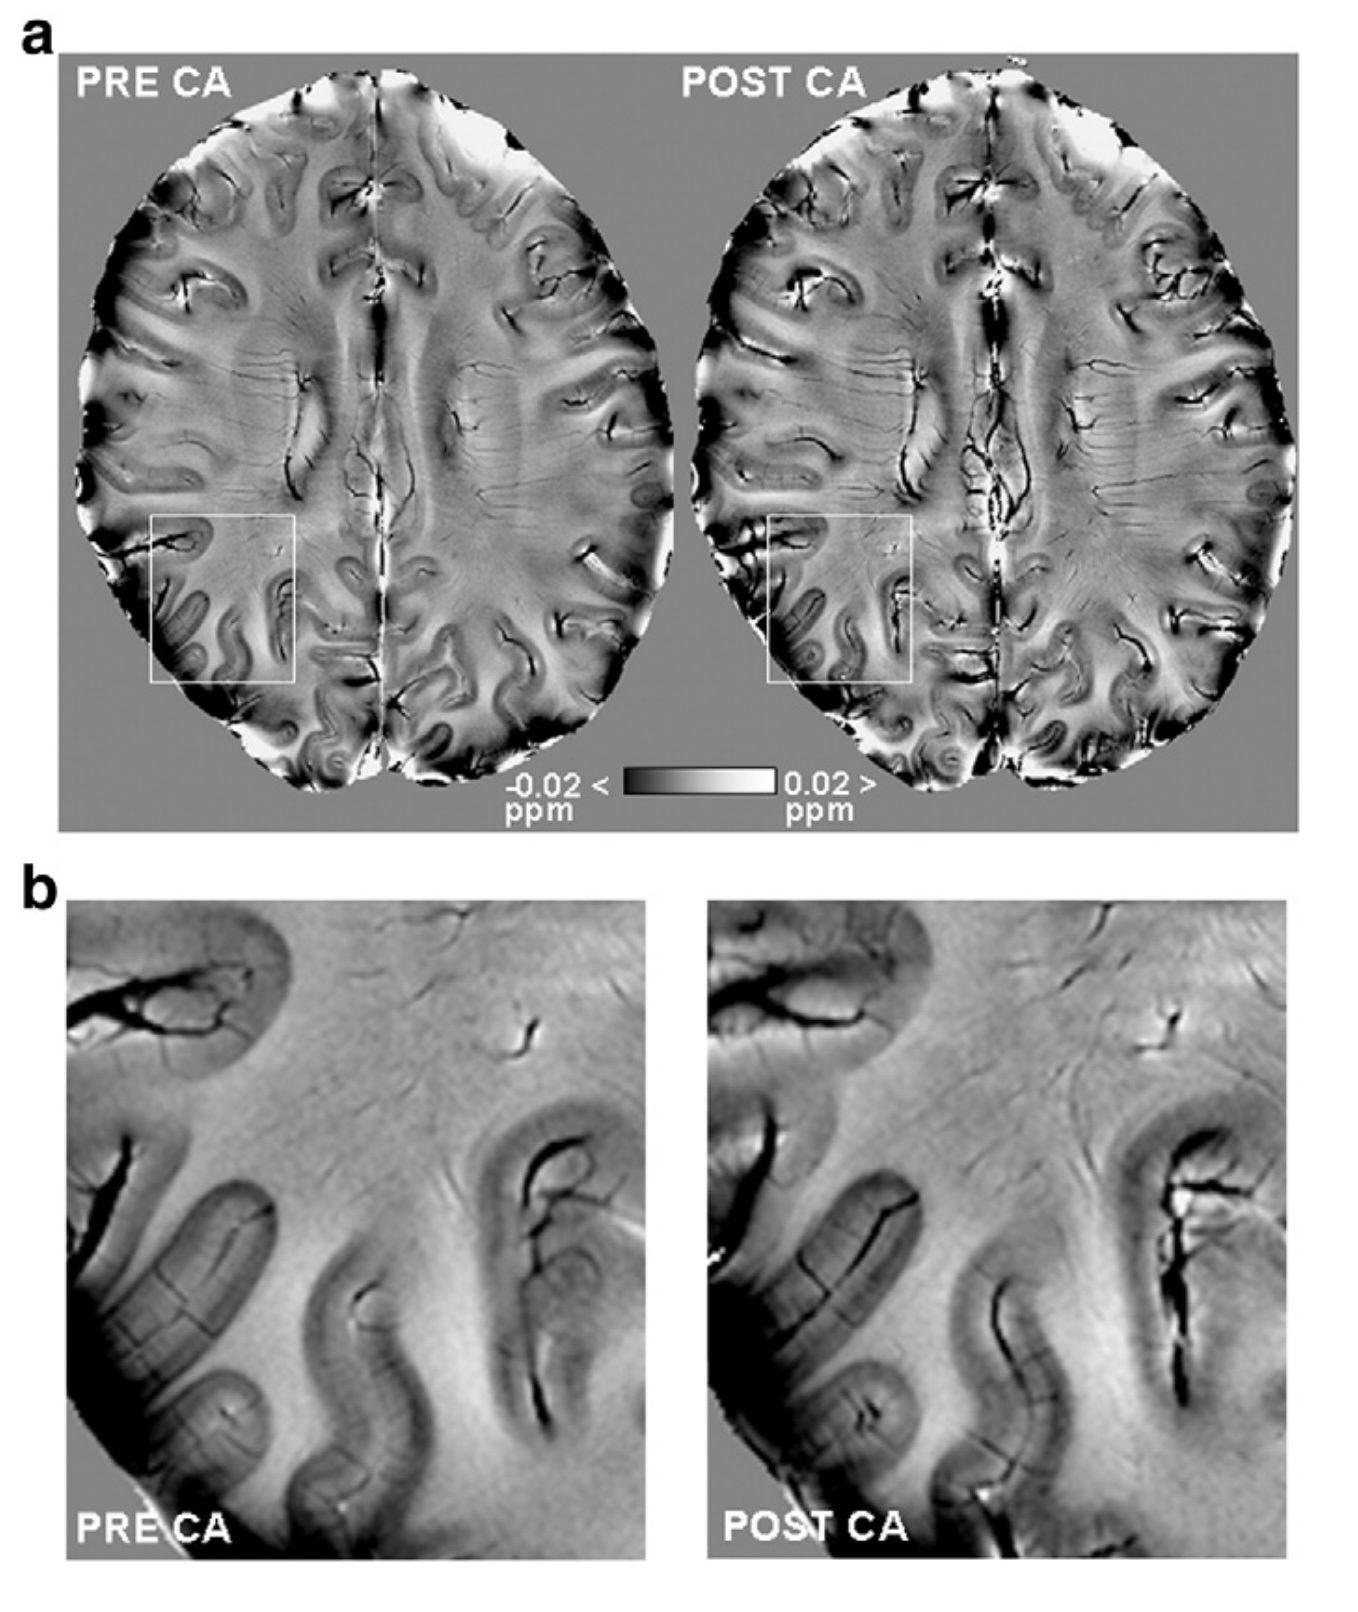
Petridou et al., 2010 // FIG 6 // Intracortical meso-vessels visible in gradient echo phase images. Before and after contrast agent (CA). In vivo MRI, 0.25 × 0.25 × 1.5 mm3 voxels.
doi.org/10.1016/j.neuroimage.2009.12.052
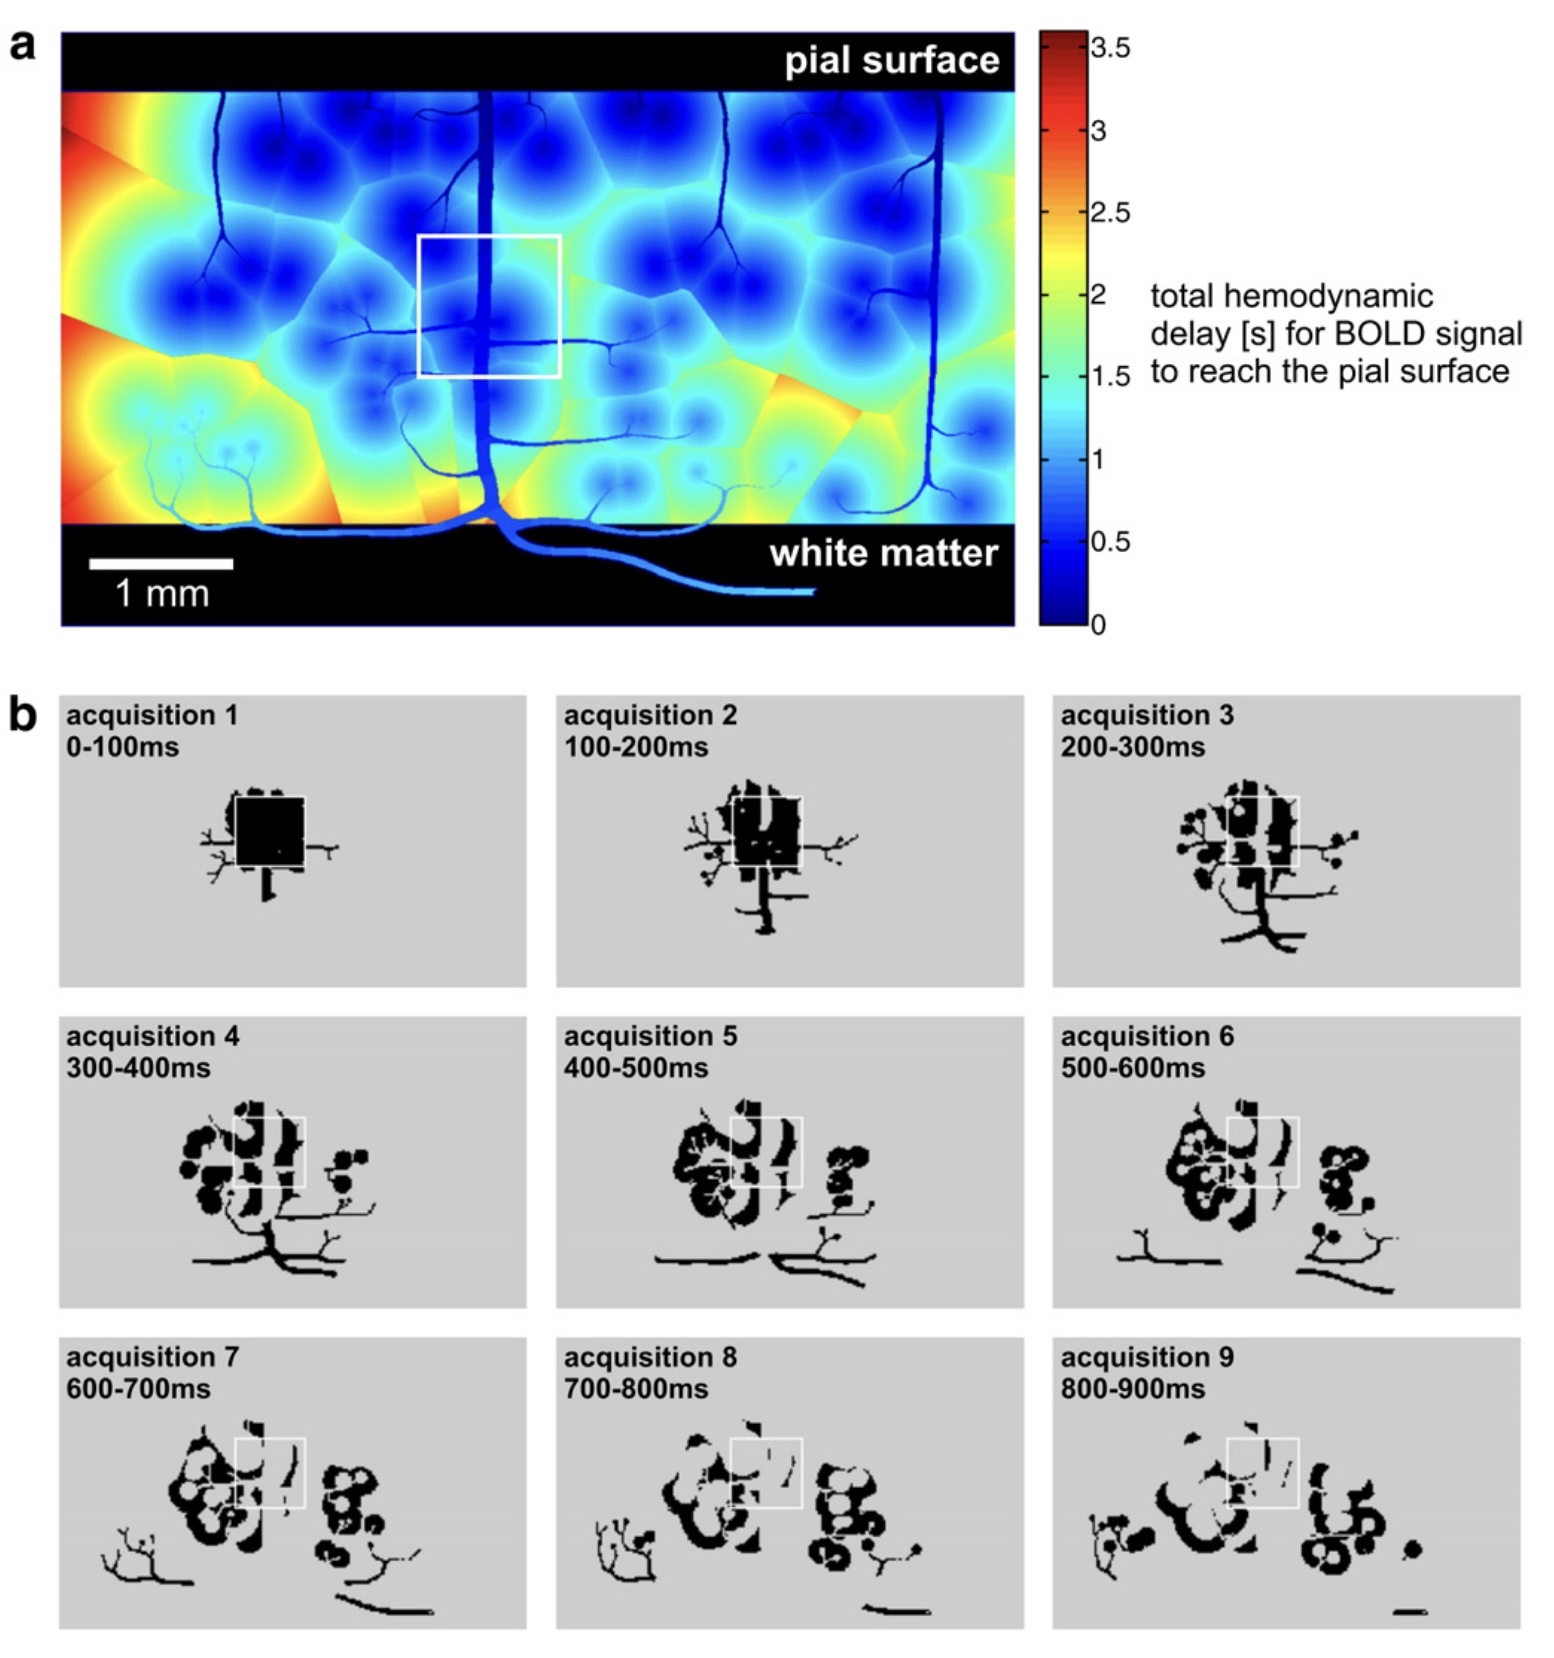
Kriegeskorte et al., 2010 // FIG 6 // A toy simulation of hemodynamic sampling showing stimulus driven response the time delay in meso-veins.
doi.org/10.1016/j.neuroimage.2009.09.059
Tsai et al., 2009 // FIG 1 // Meso-vessels of a NIH Swiss mouse. Both veins and arteries are labeled, but some next to the central sinus are lost lost during the brain extraction.
doi.org/10.1523/JNEUROSCI.3287-09.2009
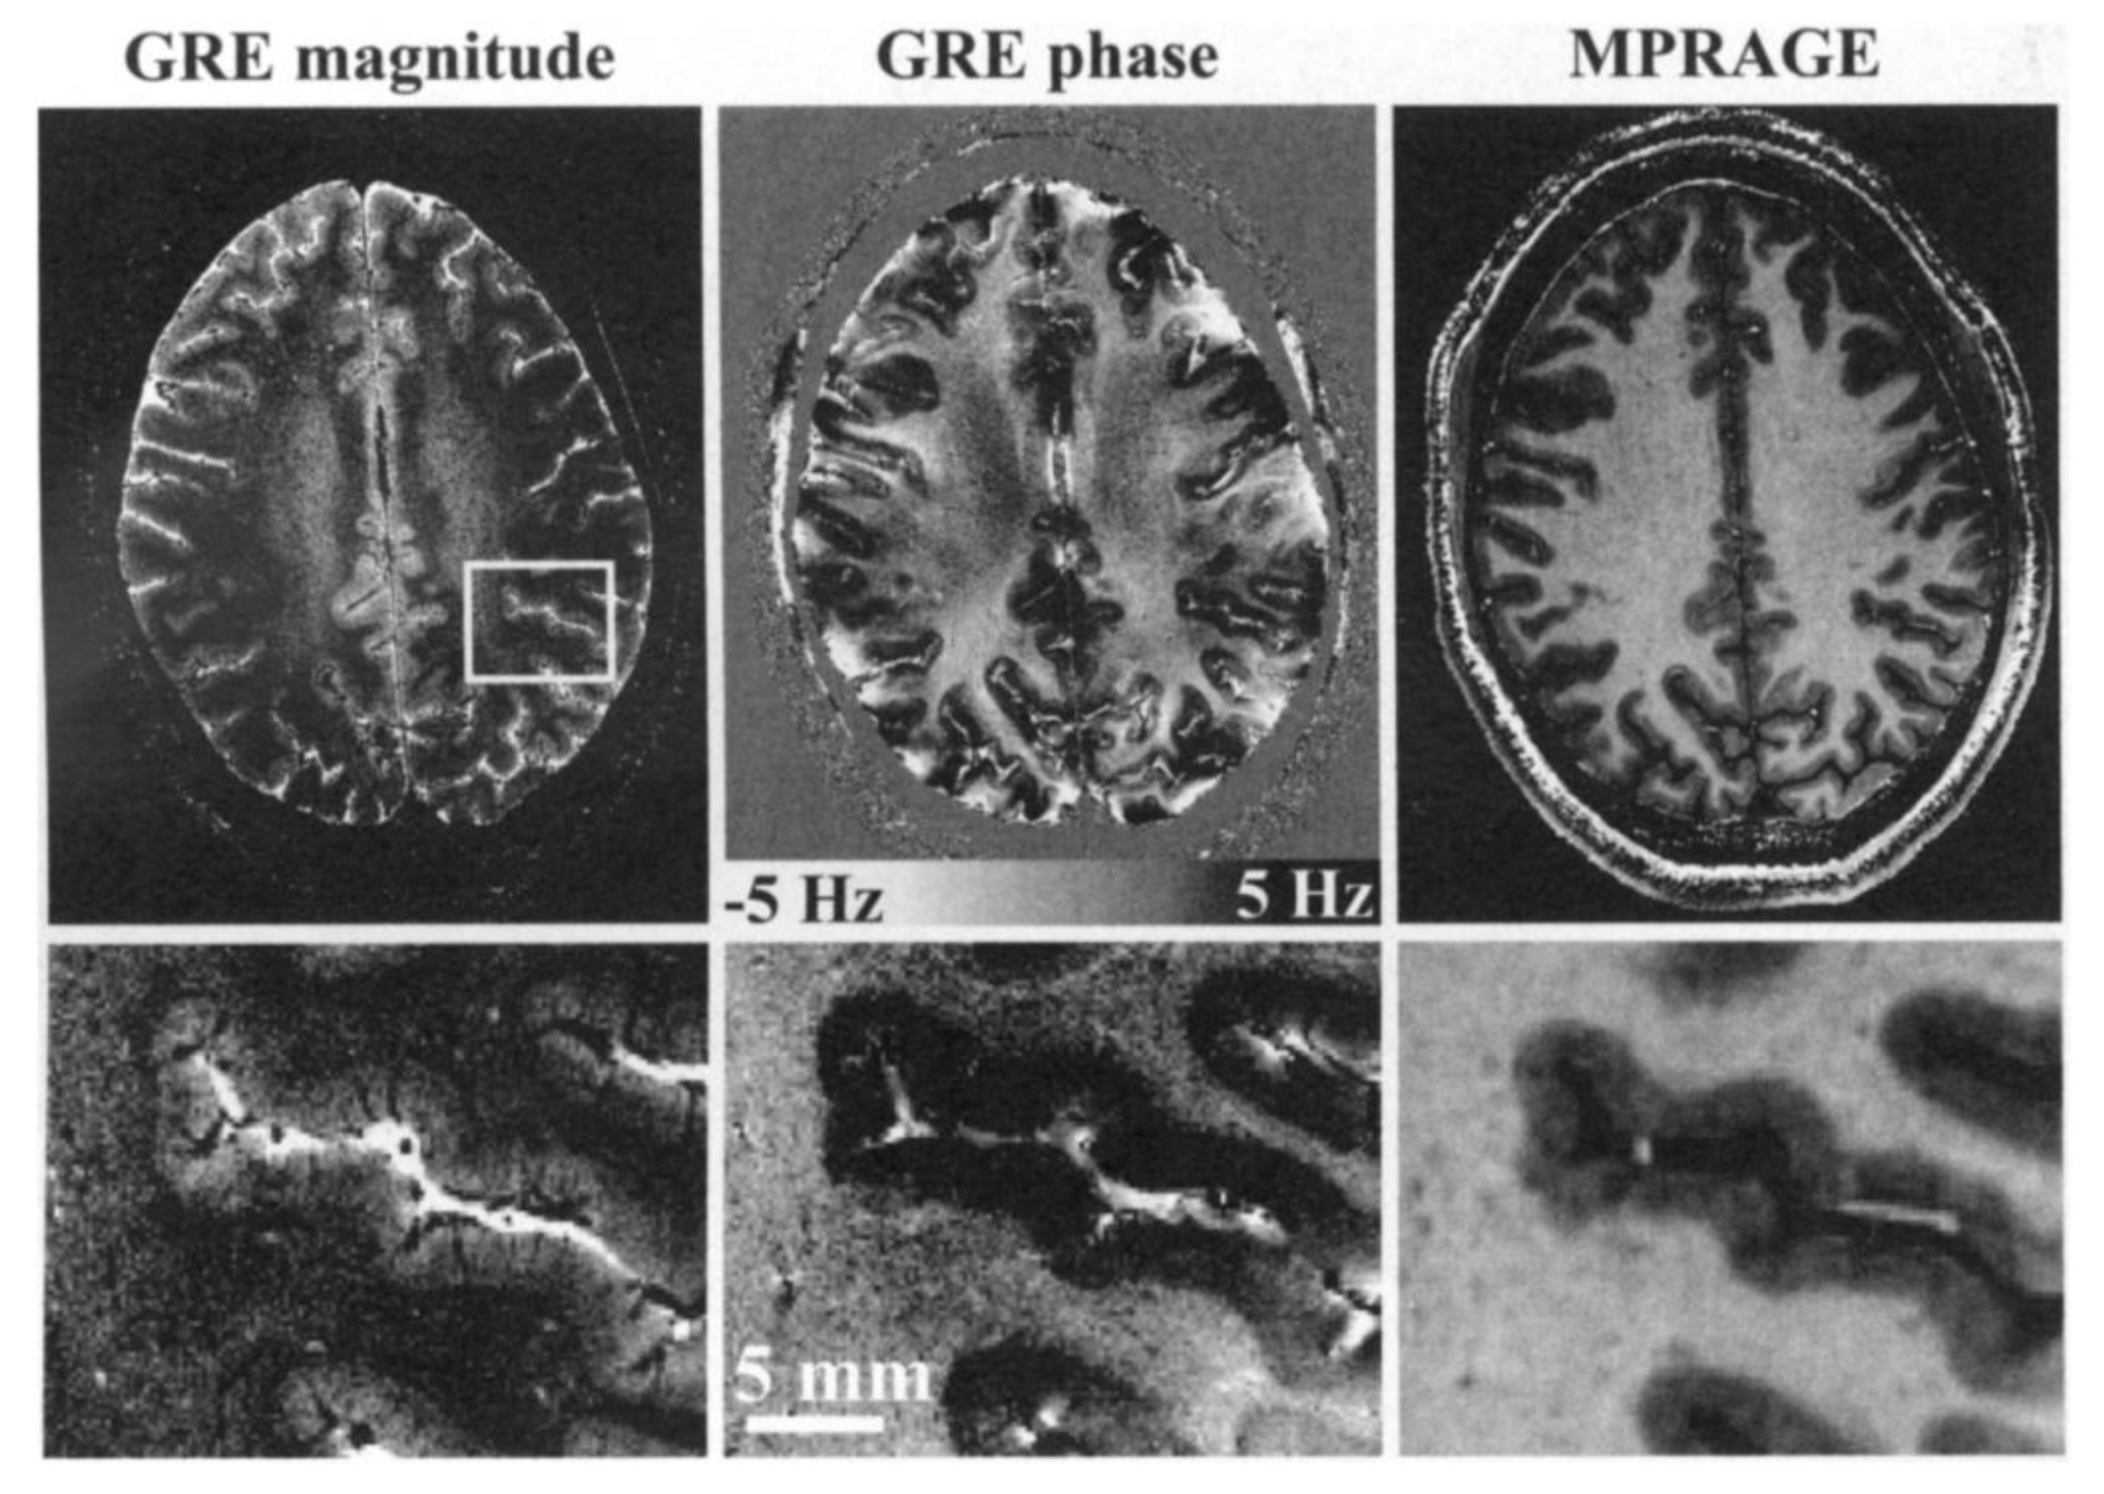
Koopmans et al., 2008 // FIG 3 // Meso-veins are visible in GRE magnitude (left) and phase (right) images. In vivo human MRI at 0.27 × 0.27 × 1.5 mm3 voxels with minimum intensity projection over five slices.
doi.org/10.1007/s10334-007-0101-3
Lauwers et al., 2008 // FIG 1 // Space filling geometry of the human intracortical vessels. Post mortem, confocal microscopy. Scale bar is 1 mm.
doi.org/10.1016/j.neuroimage.2007.09.024
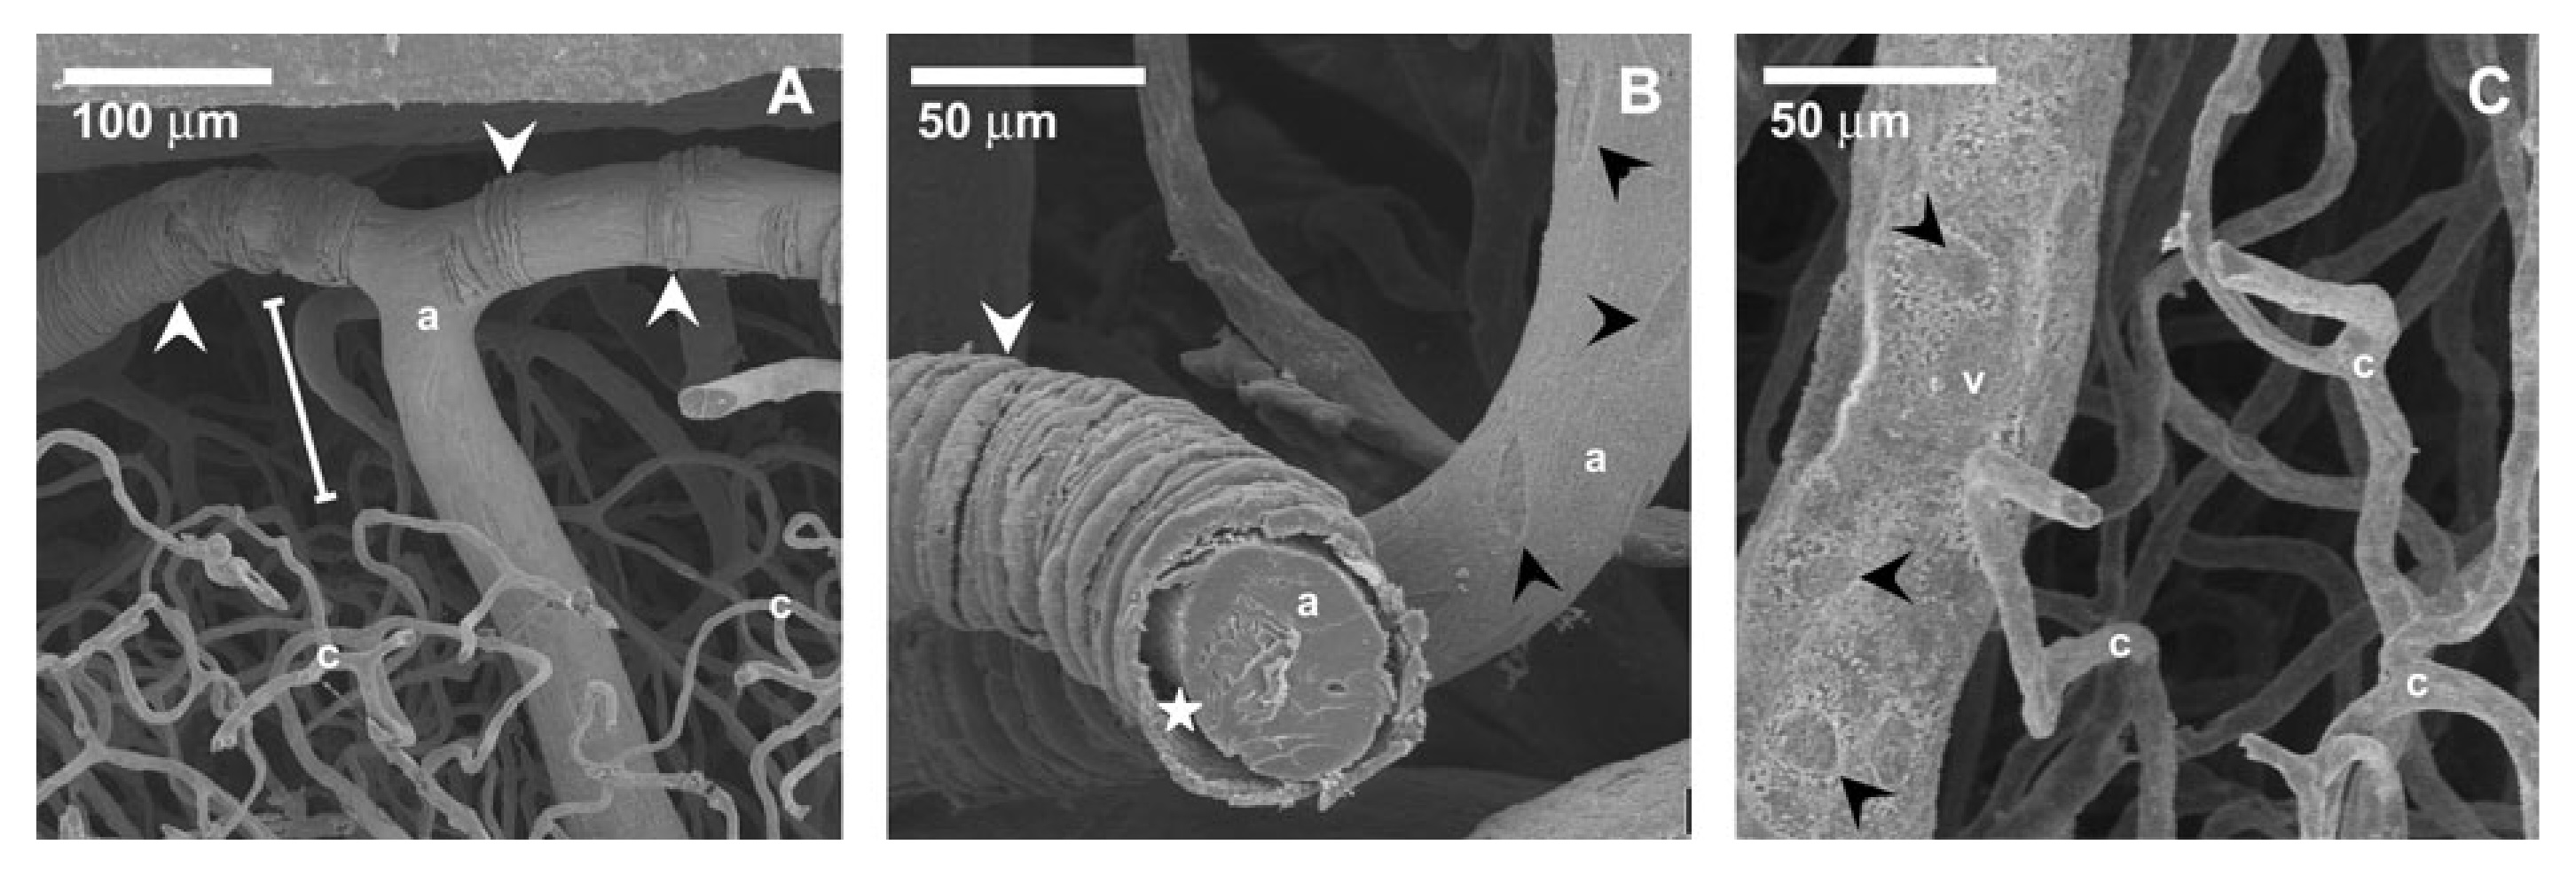
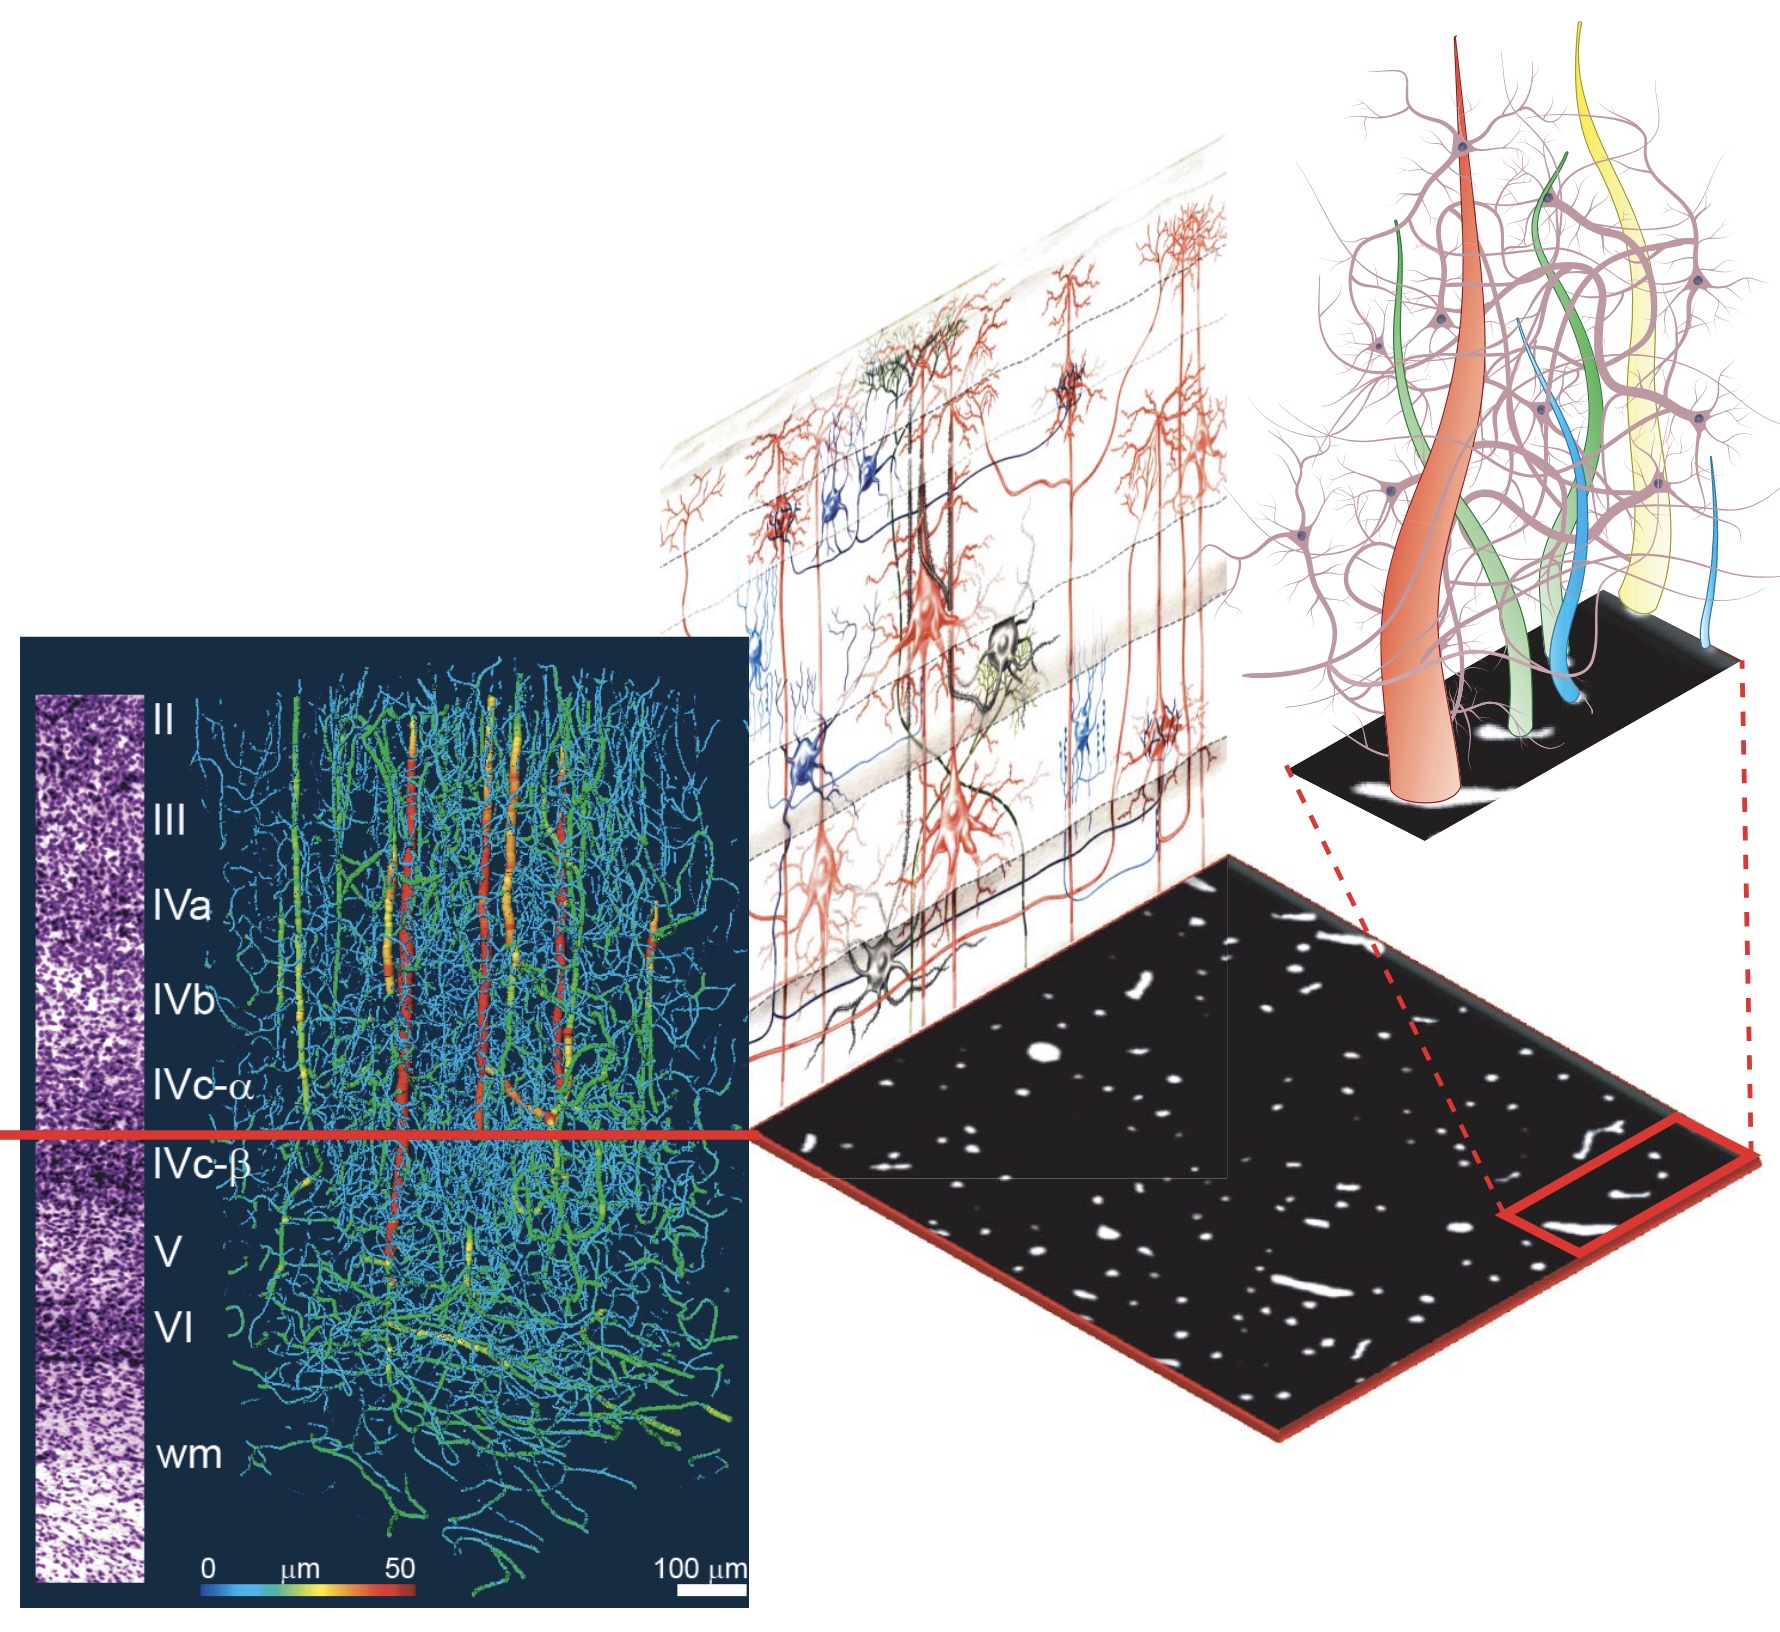
Weber et al., 2008 // FIG 1 // Intracortical vessel in macaque visual cortex. Electron micrographs of a vascular corrosion cast. Dotted line indicates the white matter boundary.
doi.org/10.1093/cercor/bhm259
Weber et al., 2008 // FIG 2 // Zoomed view of intracortical vessel in macaque visual cortex. The white bar marks the upper molecular layer which is devoid of capillaries. White arrows indicate plastic strips. Black arrows indicate imprints of endothelial nuclei. Arteries (a), veins (b), and capillaries (c) are indicated with letters. Electron micrographs of a vascular corrosion cast.
doi.org/10.1093/cercor/bhm259
Park et al., 2008 // FIG 1 // Meso-veins in rats. In vivo MRI, 78 × 78 × 78 μm3 voxels.
doi.org/10.1002/mrm.21573
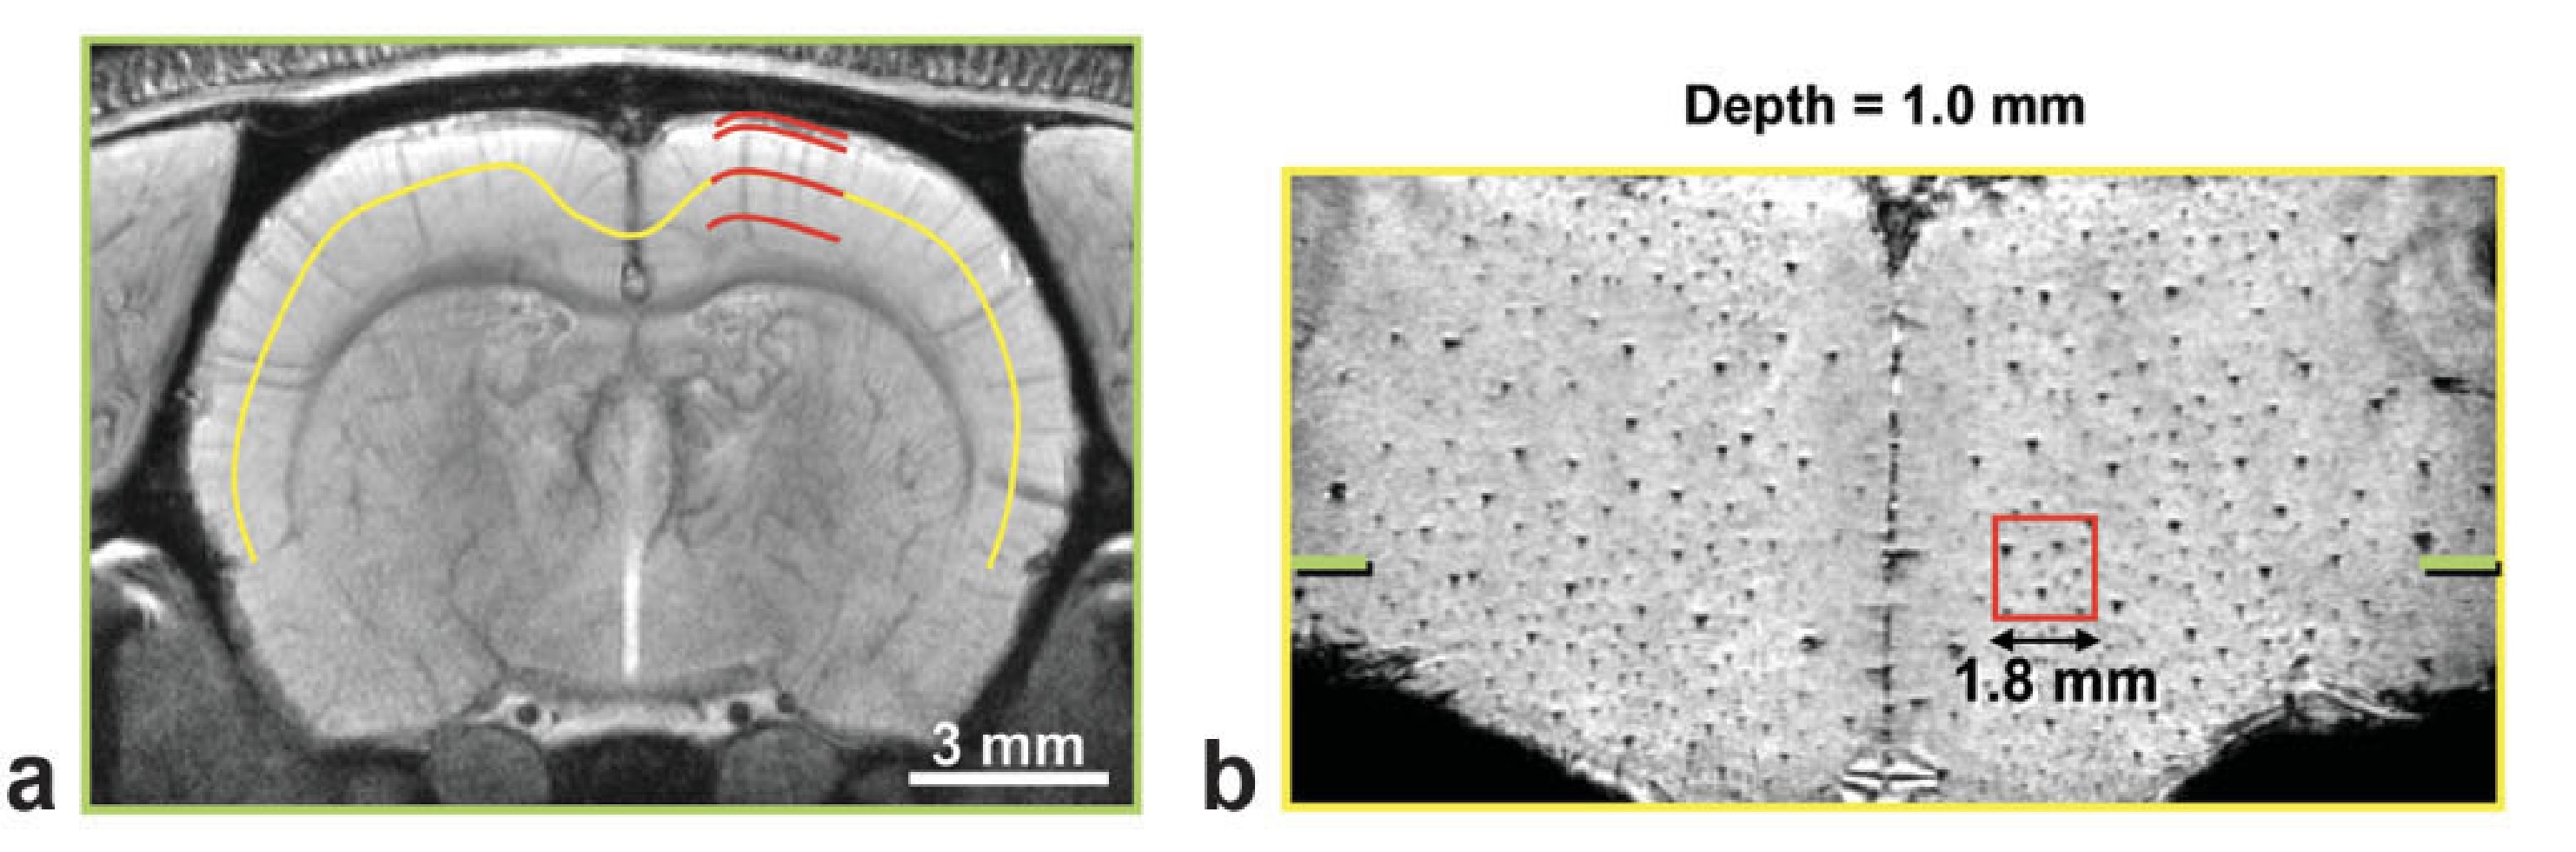
Park et al., 2008 // FIG 4 // Intracortical meso-veins in rats. A shows mean intensity projection over 1 mm. B shows flattened mid-thickness surface with meso-veins appearing as dark dots. In vivo MRI, 78 × 78 × 78 μm3 voxels.
doi.org/10.1002/mrm.21573
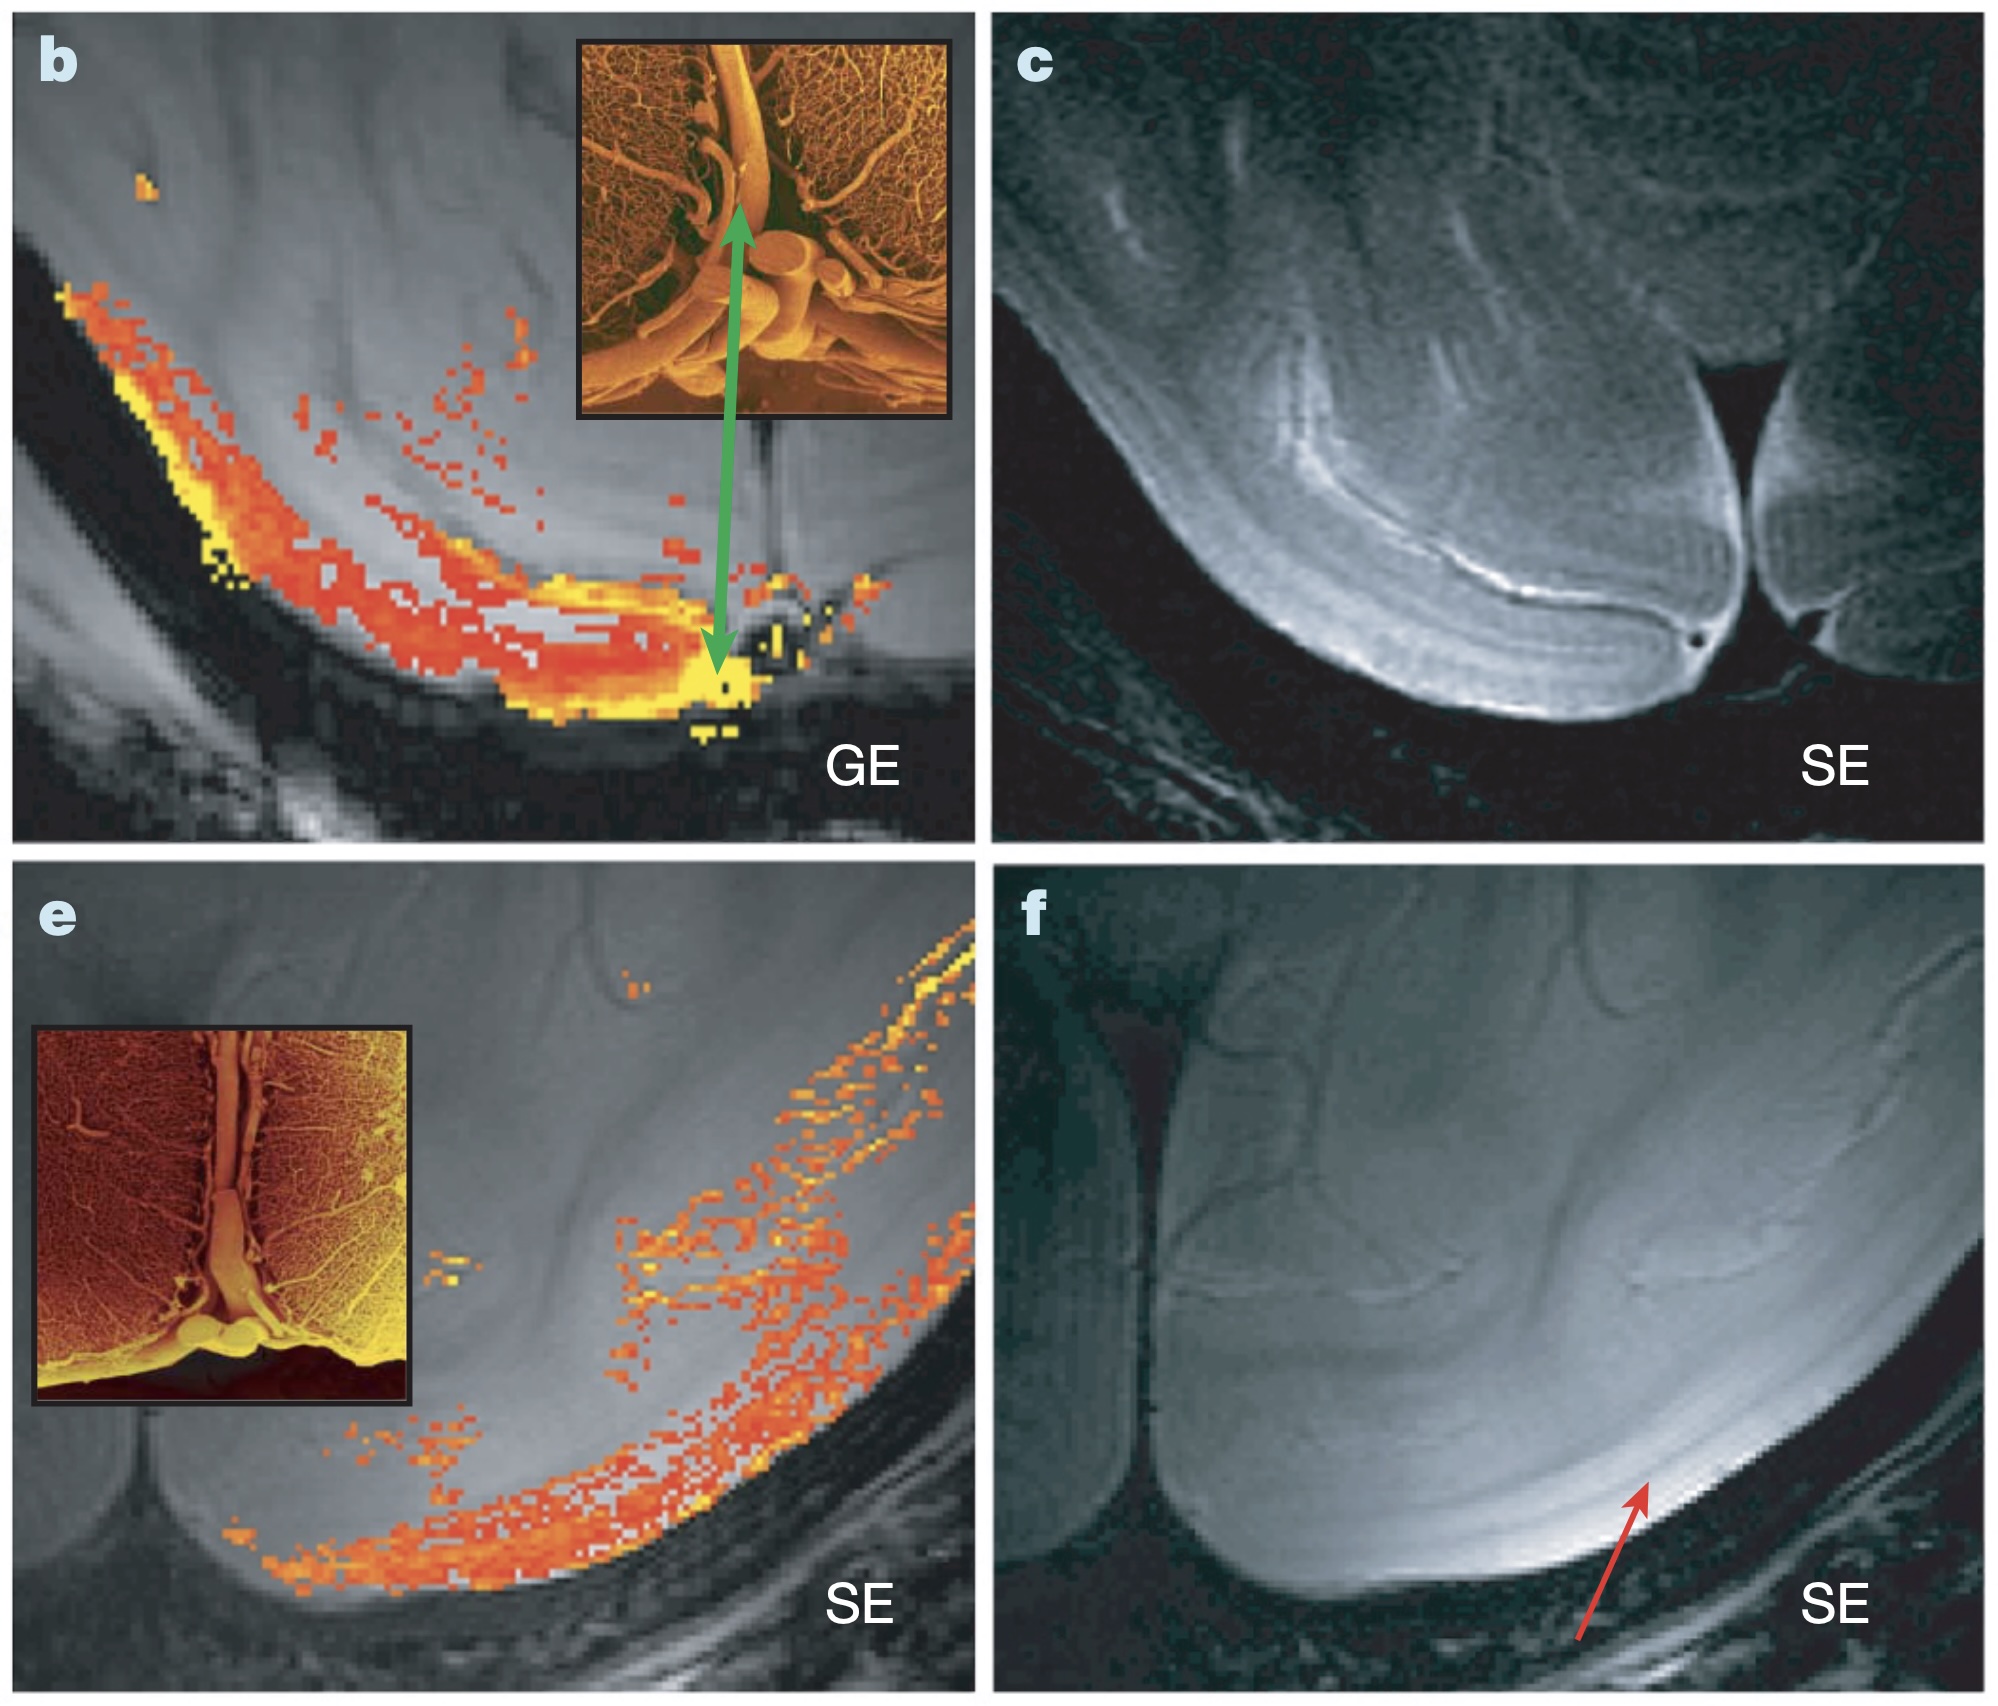
Logothetis, 2008 // FIG 1 // High-resolution gradient echo (GE) and spin echo (SE) EPI fMRI images show the strong contribution of macrovessels (courtesy J. Goense). Green arrows point to pia vessels (shown in the inset scanning electron microscopy image, total width of inset is 2 mm). fMRI images have 0.33 × 0.33 × 2 mm voxels. Macaque monkey visual cortex (V1).
doi.org/10.1038/nature06976
Logothetis, 2008 // FIG 3 // Neural and vascular contents of a voxel. The left panel demonstrates the relative density of vessels in the visual cortex of monkeys against the Nissl slice from the same area. The average distance between the capillaries is about 50 mm which is approximately the distance that oxygen molecules travel by diffusion within the limited transit time of the blood. Top right panel depicts hypothetical vascular and neural elements.
doi.org/10.1038/nature06976
Duyn et al., 2007 // FIG 1 // Intracortical meso-veins are visible in GRE magnitude images at 0.24 × 0.24 × 1 mm3 voxels. In vivo human MRI.
doi.org/10.1073/pnas.0610821104
Bolan et al., 2006 // FIG 3 // Intracortical meso-vessels reconstructions of a living cat using MRI.
doi.org/10.1016/j.neuroimage.2006.03.027
Bolan et al., 2006 // FIG 5 // Intracortical meso-vessels of a living cat using a post-MION MRI acquisition oriented in the coronal plane.
doi.org/10.1016/j.neuroimage.2006.03.027
Schaffer et al., 2006 // FIG 1 // Meso-vessels of the rat cortex. In vivo two-photon lightsheet microscopy.
doi.org/10.1371/journal.pbio.0040022
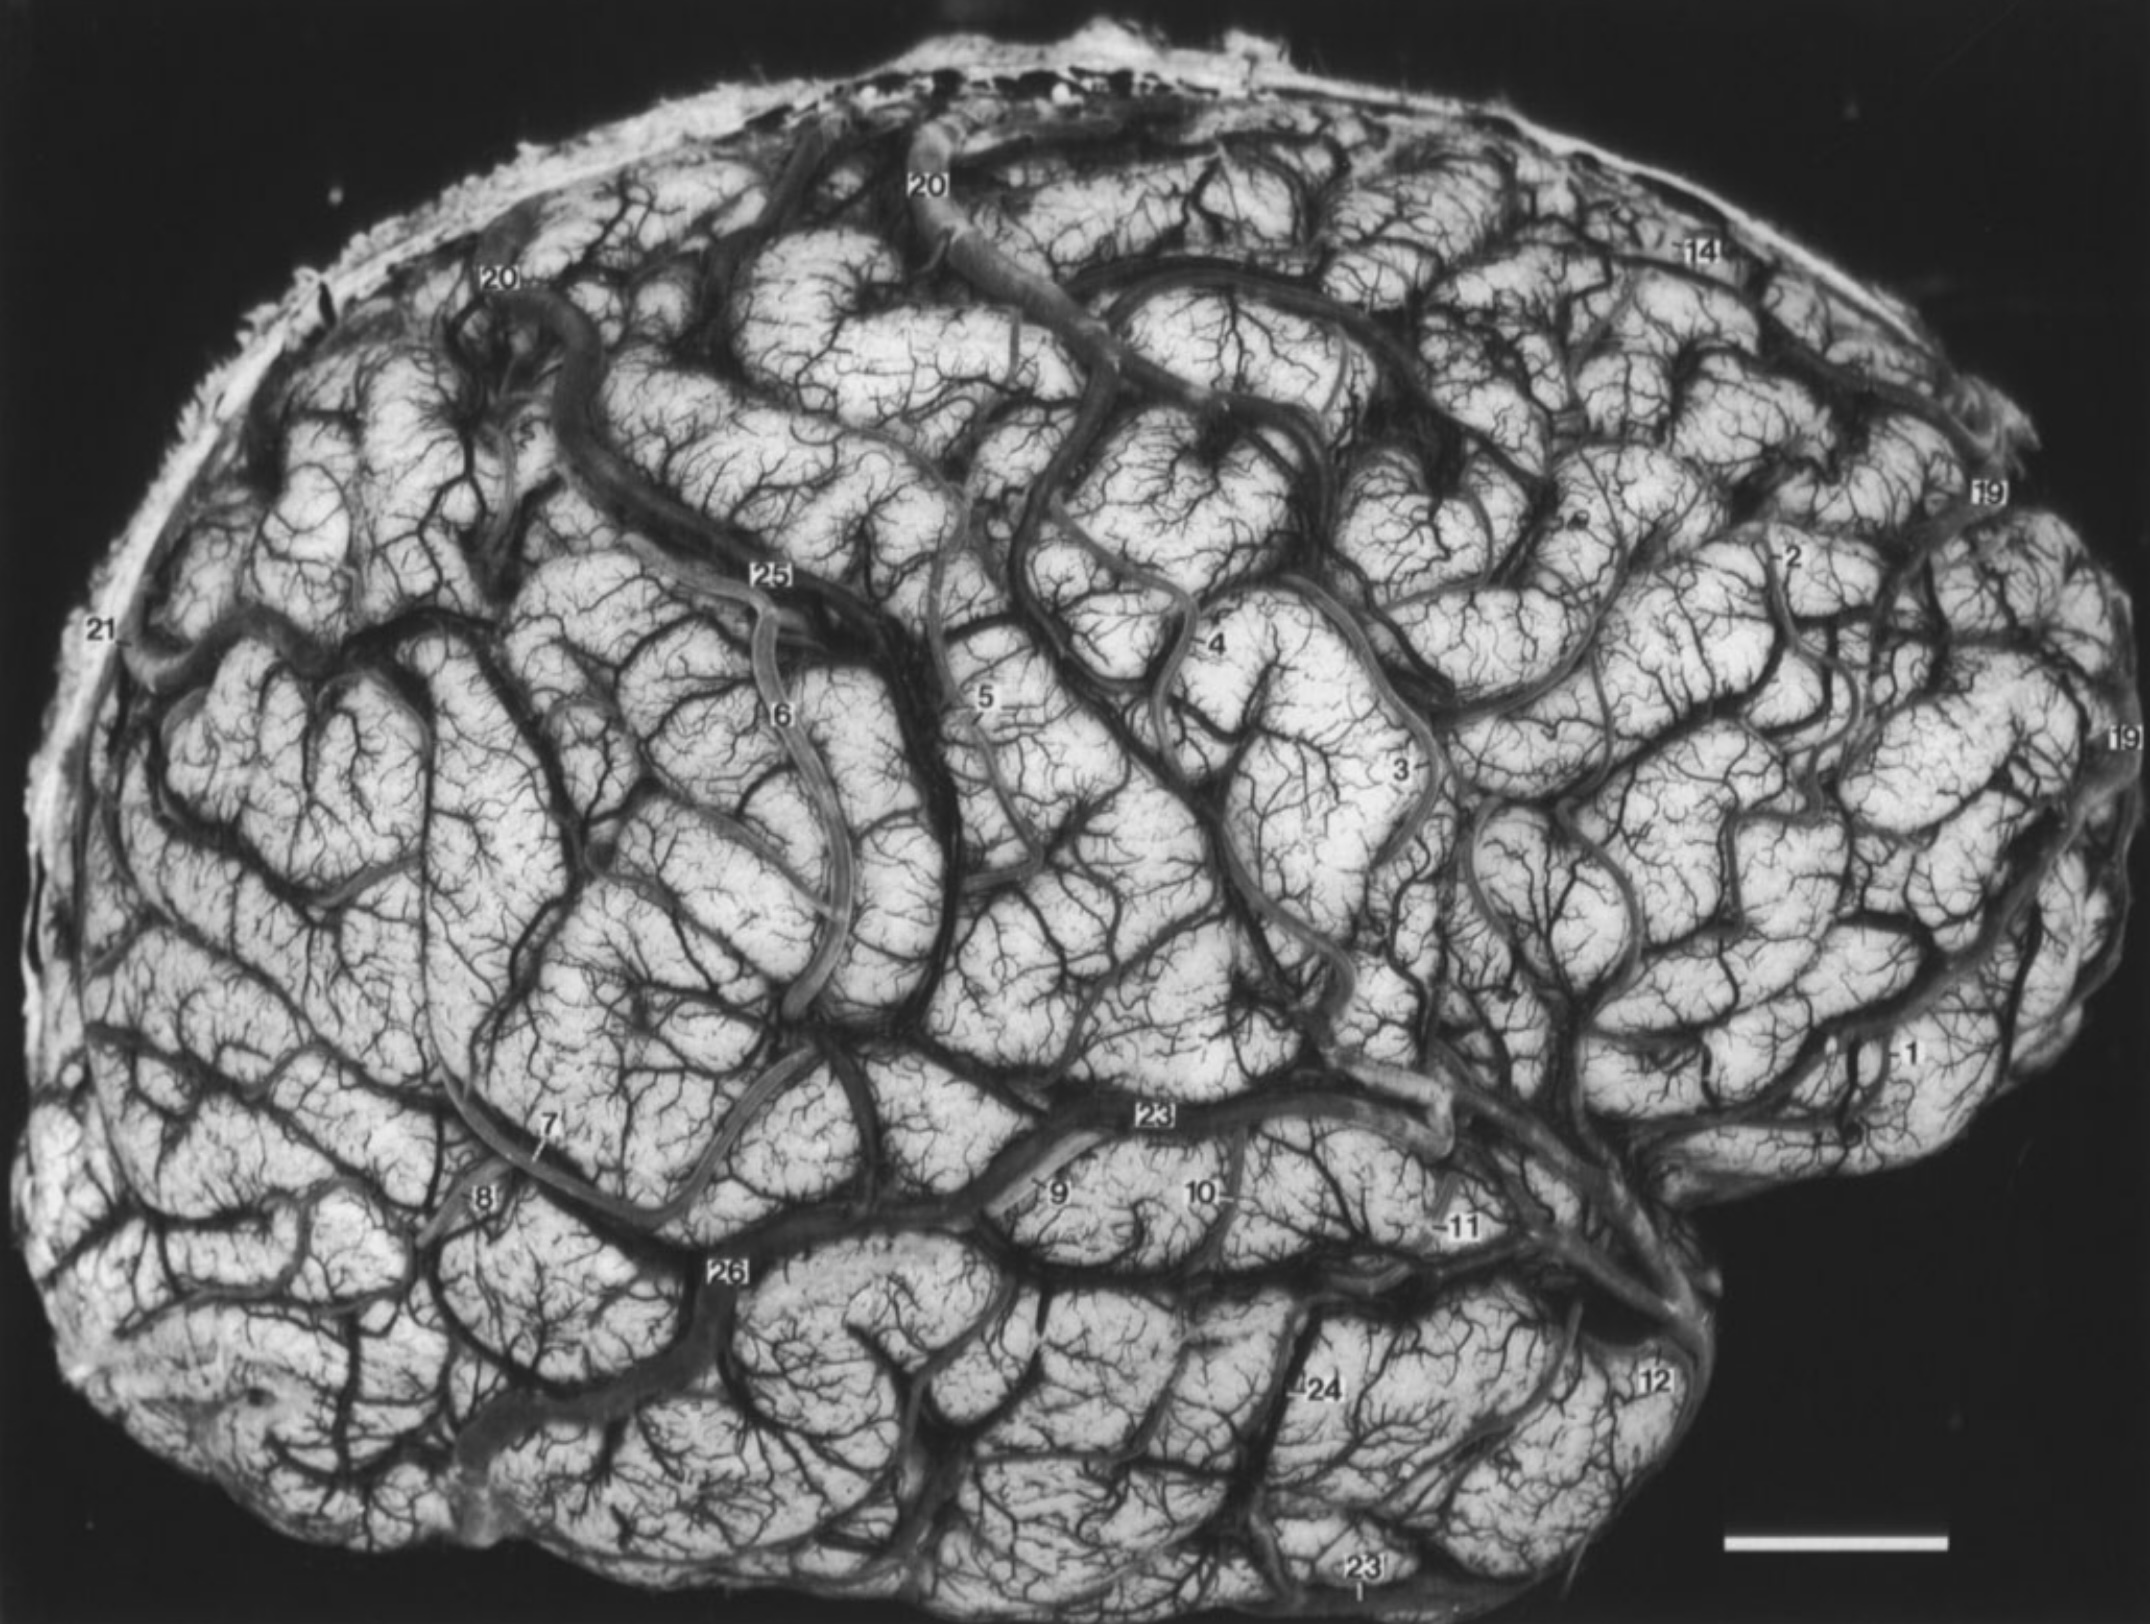
Duvernoy, Vannson, 1999 // FIG 233 // Leptomeningeal and pial vessels of a human brain. Post mortem imaging using intravascular india ink injection. Scale bar is 18.3 mm.
doi.org/0.1007/978-3-7091-6792-2
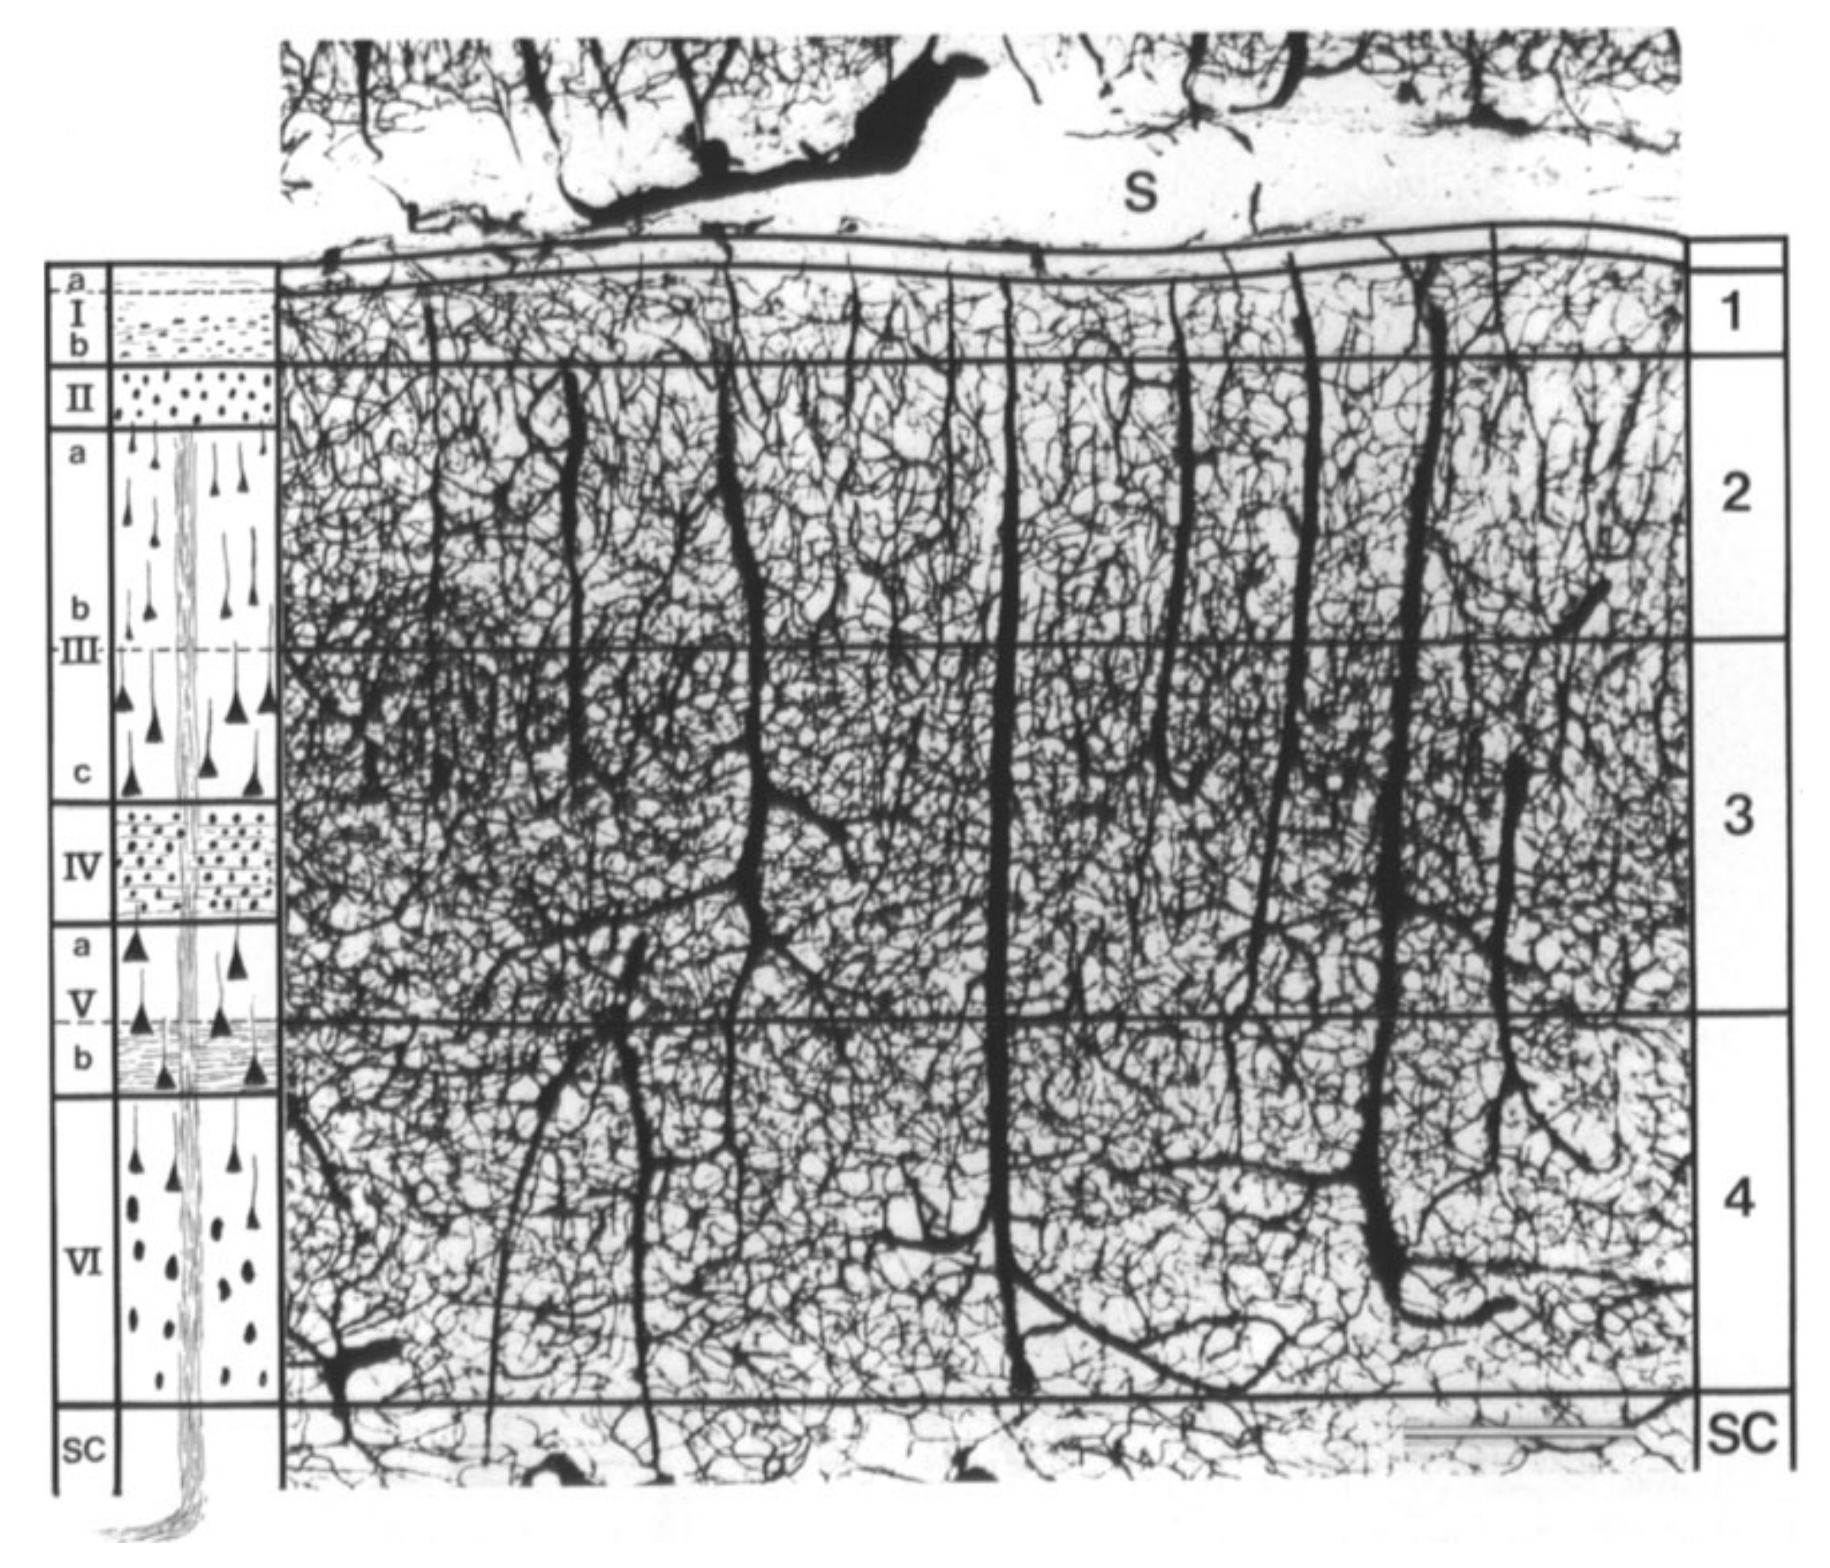
Duvernoy, Vannson, 1999 // FIG 255 // Human intracortical vessels together with six cortical cellular layers (left) and four vascular layers (right) can be seen. Post mortem imaging using intravascular india ink injection. Scale bar is 500 μm.
doi.org/0.1007/978-3-7091-6792-2
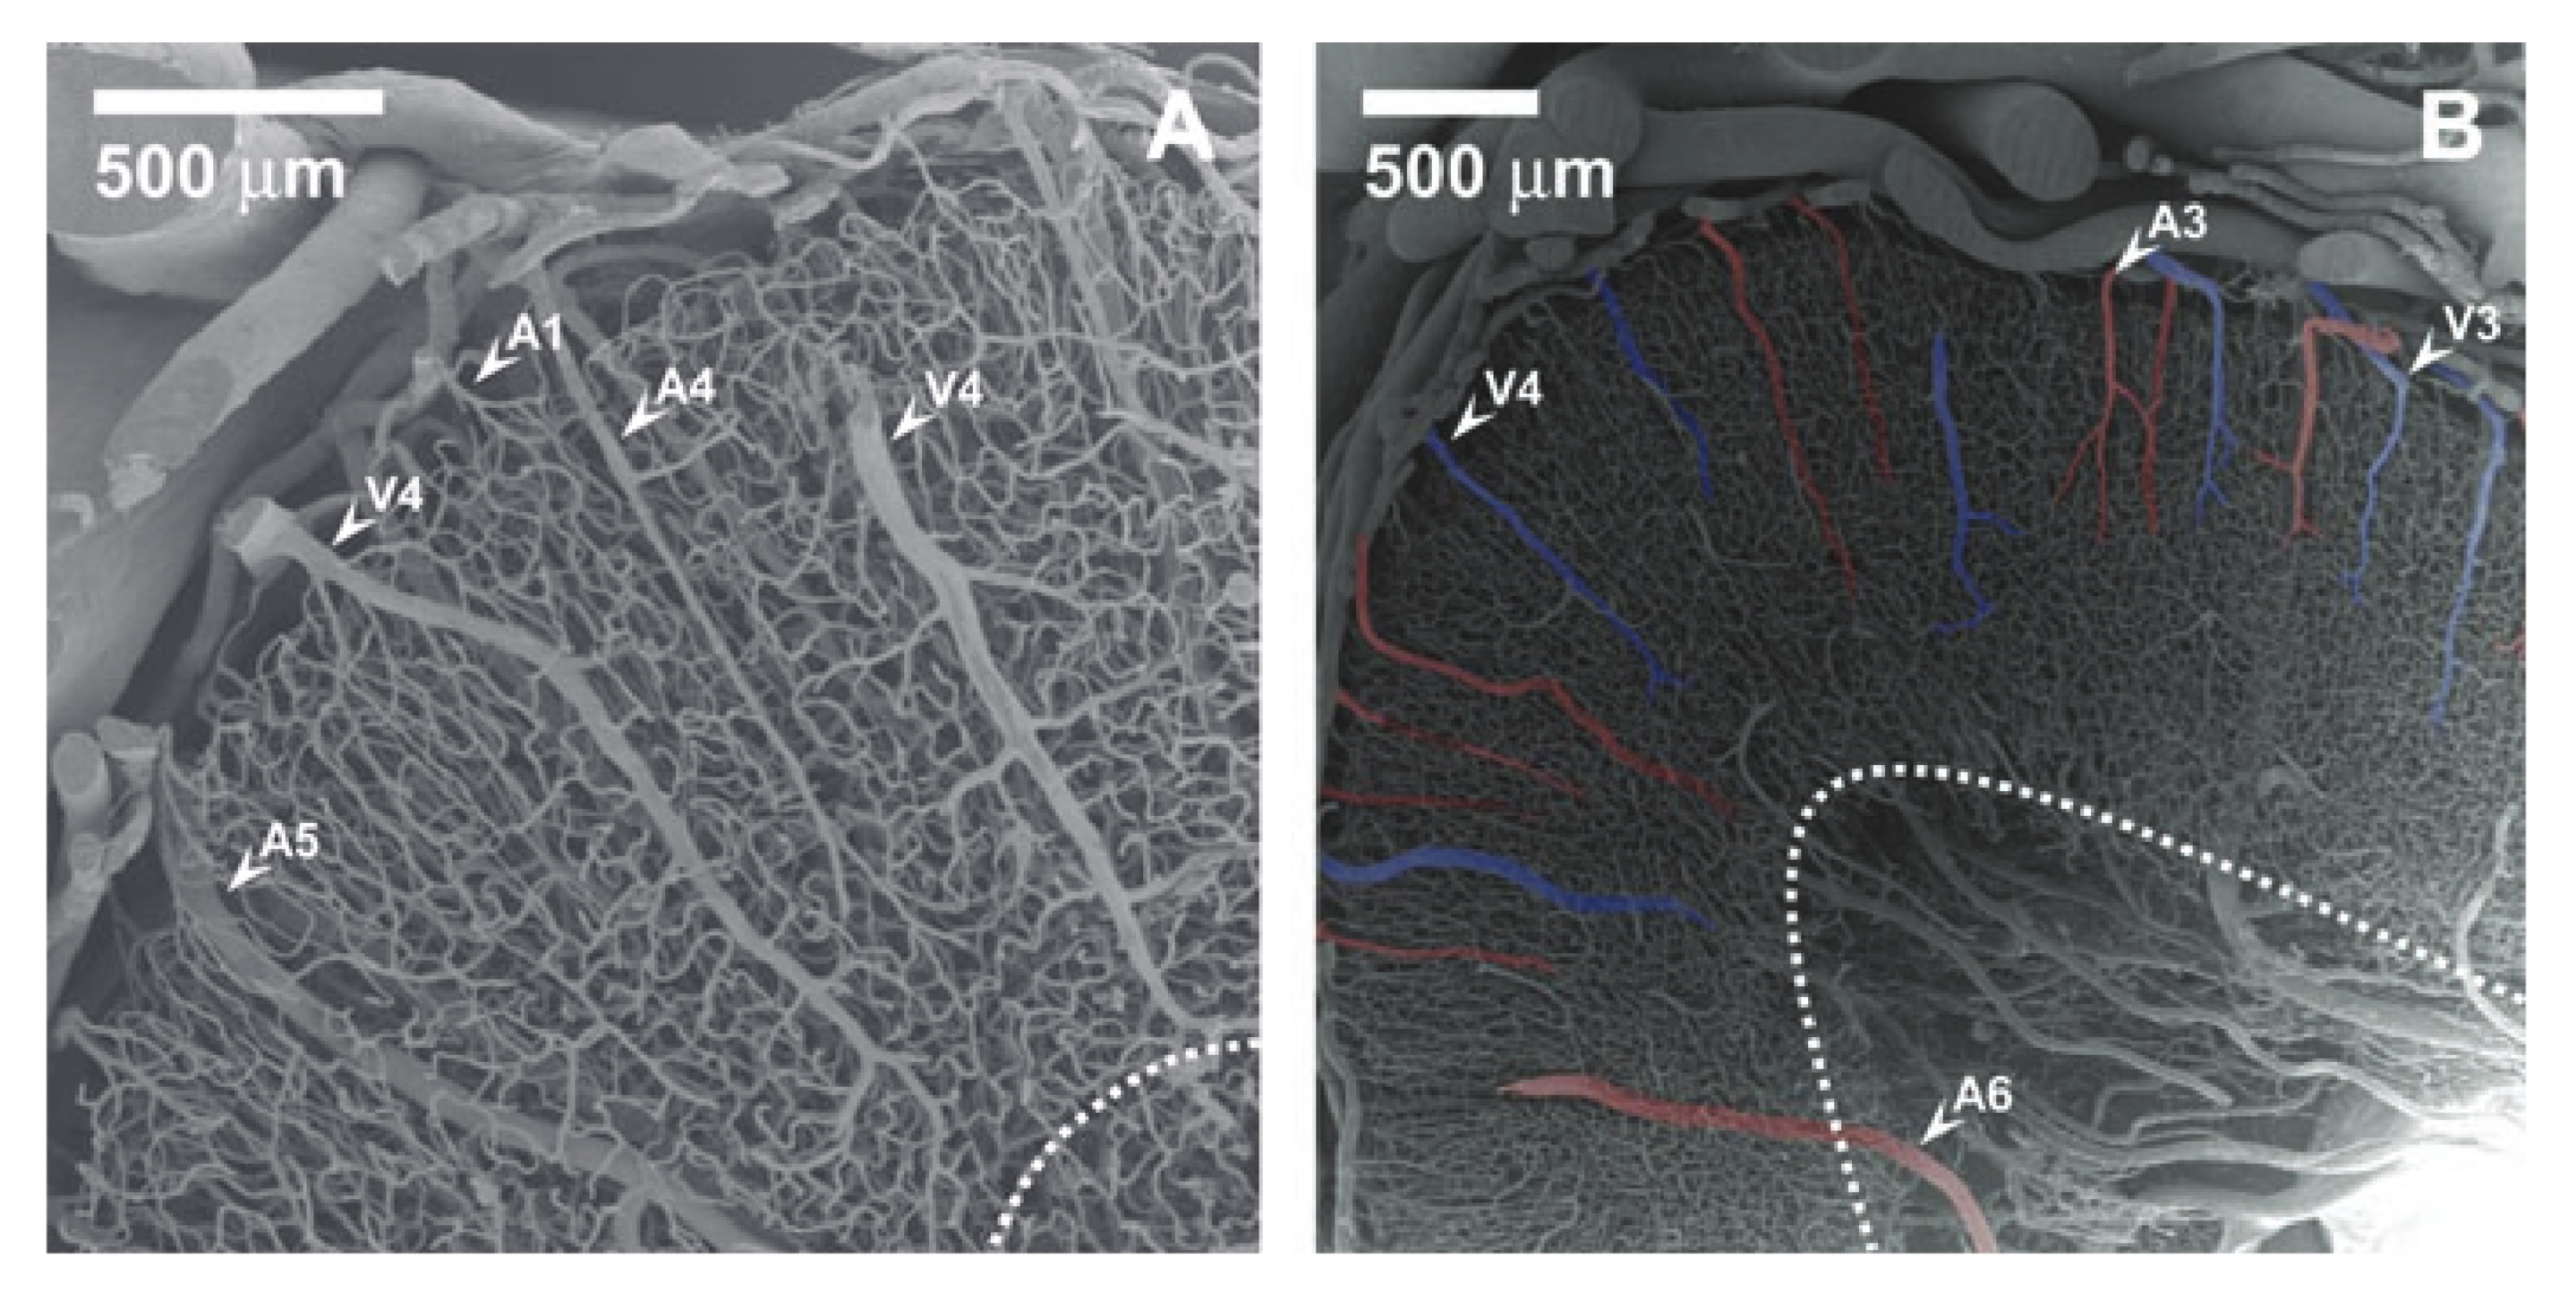
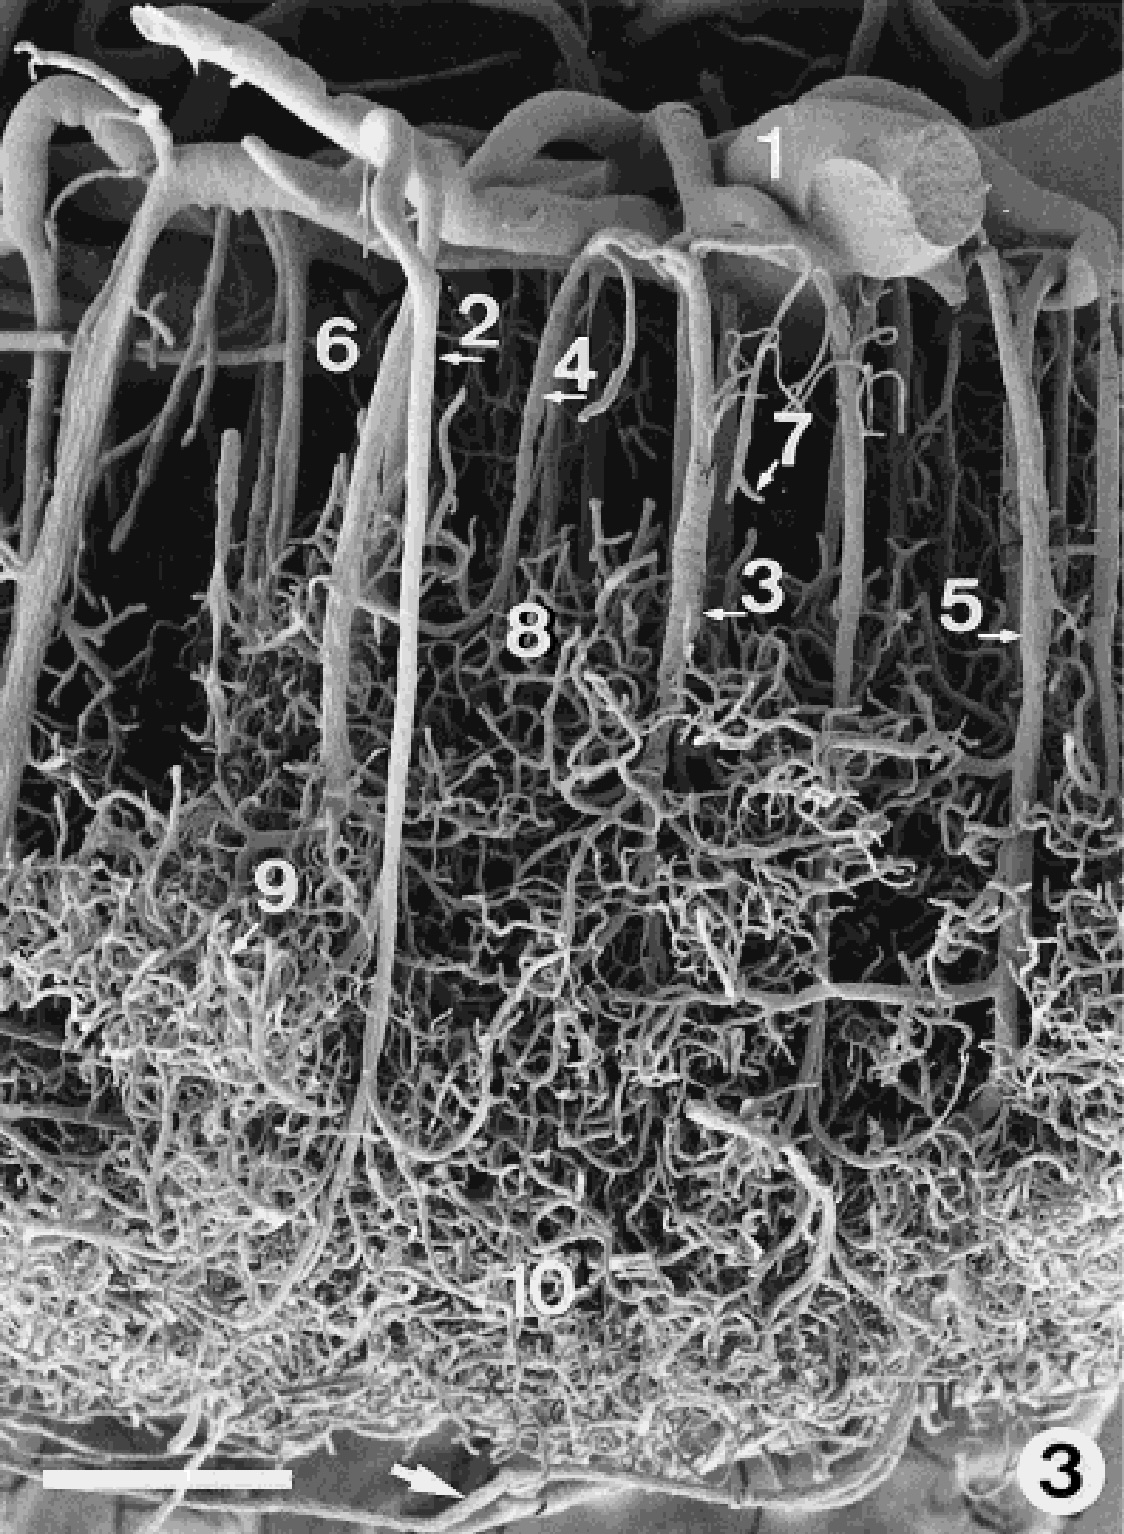
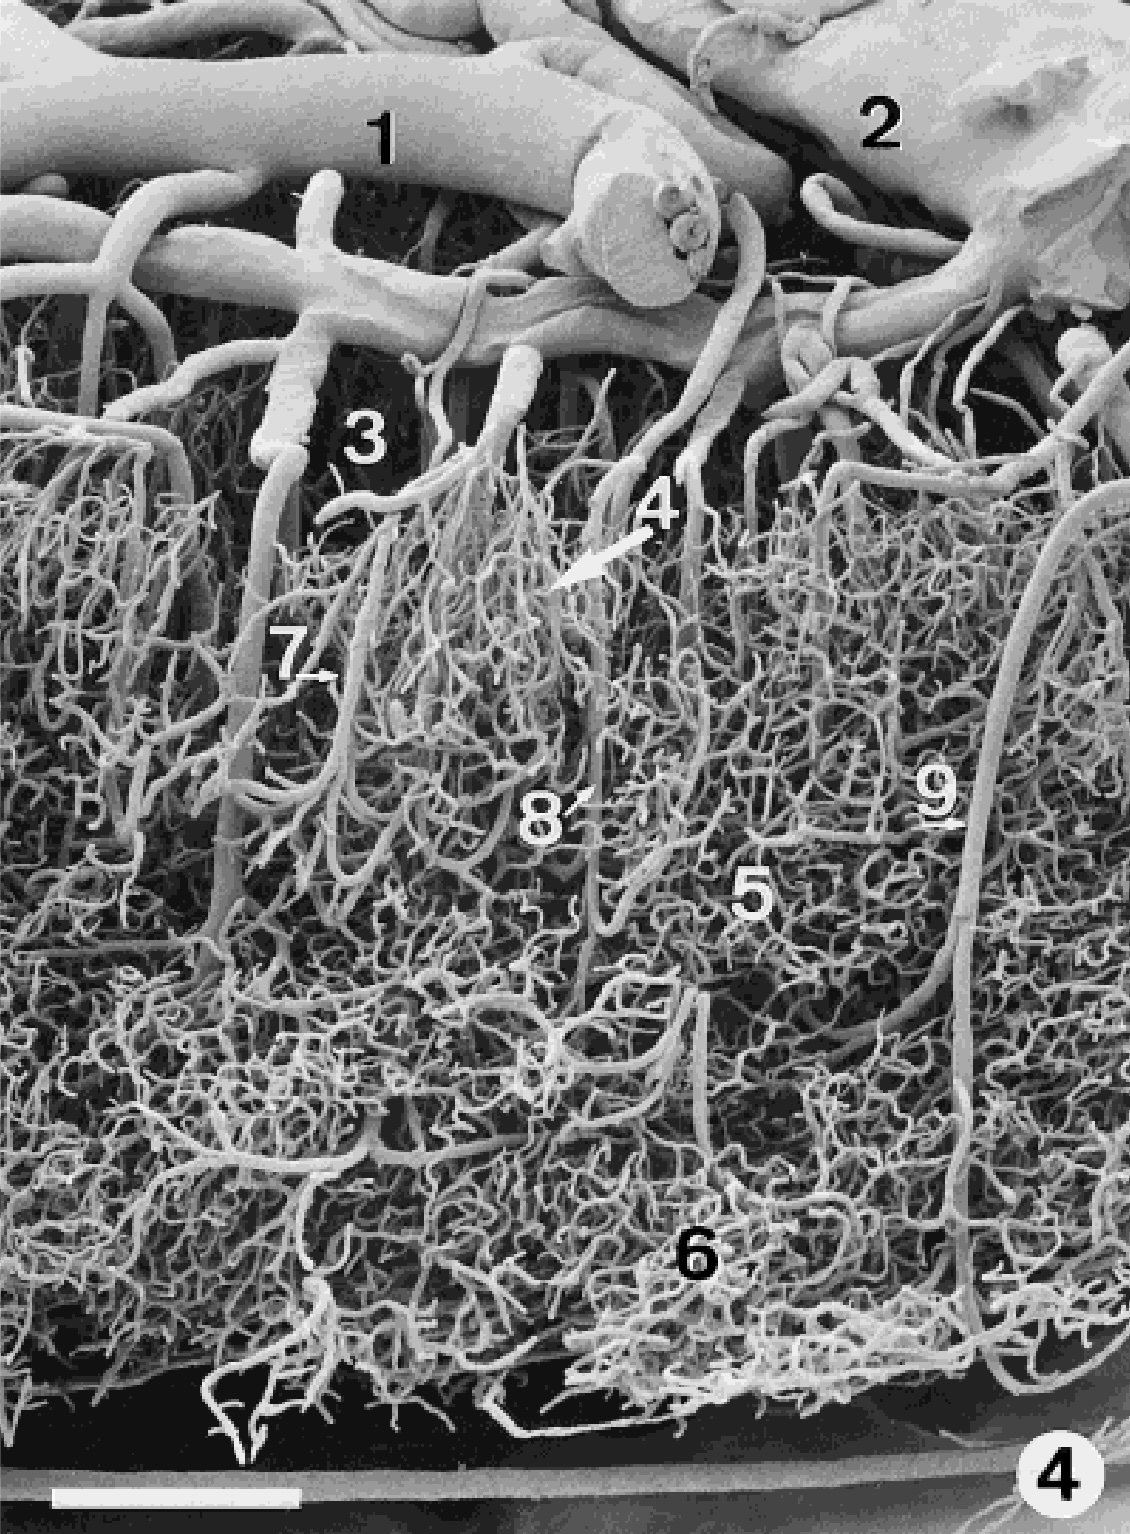
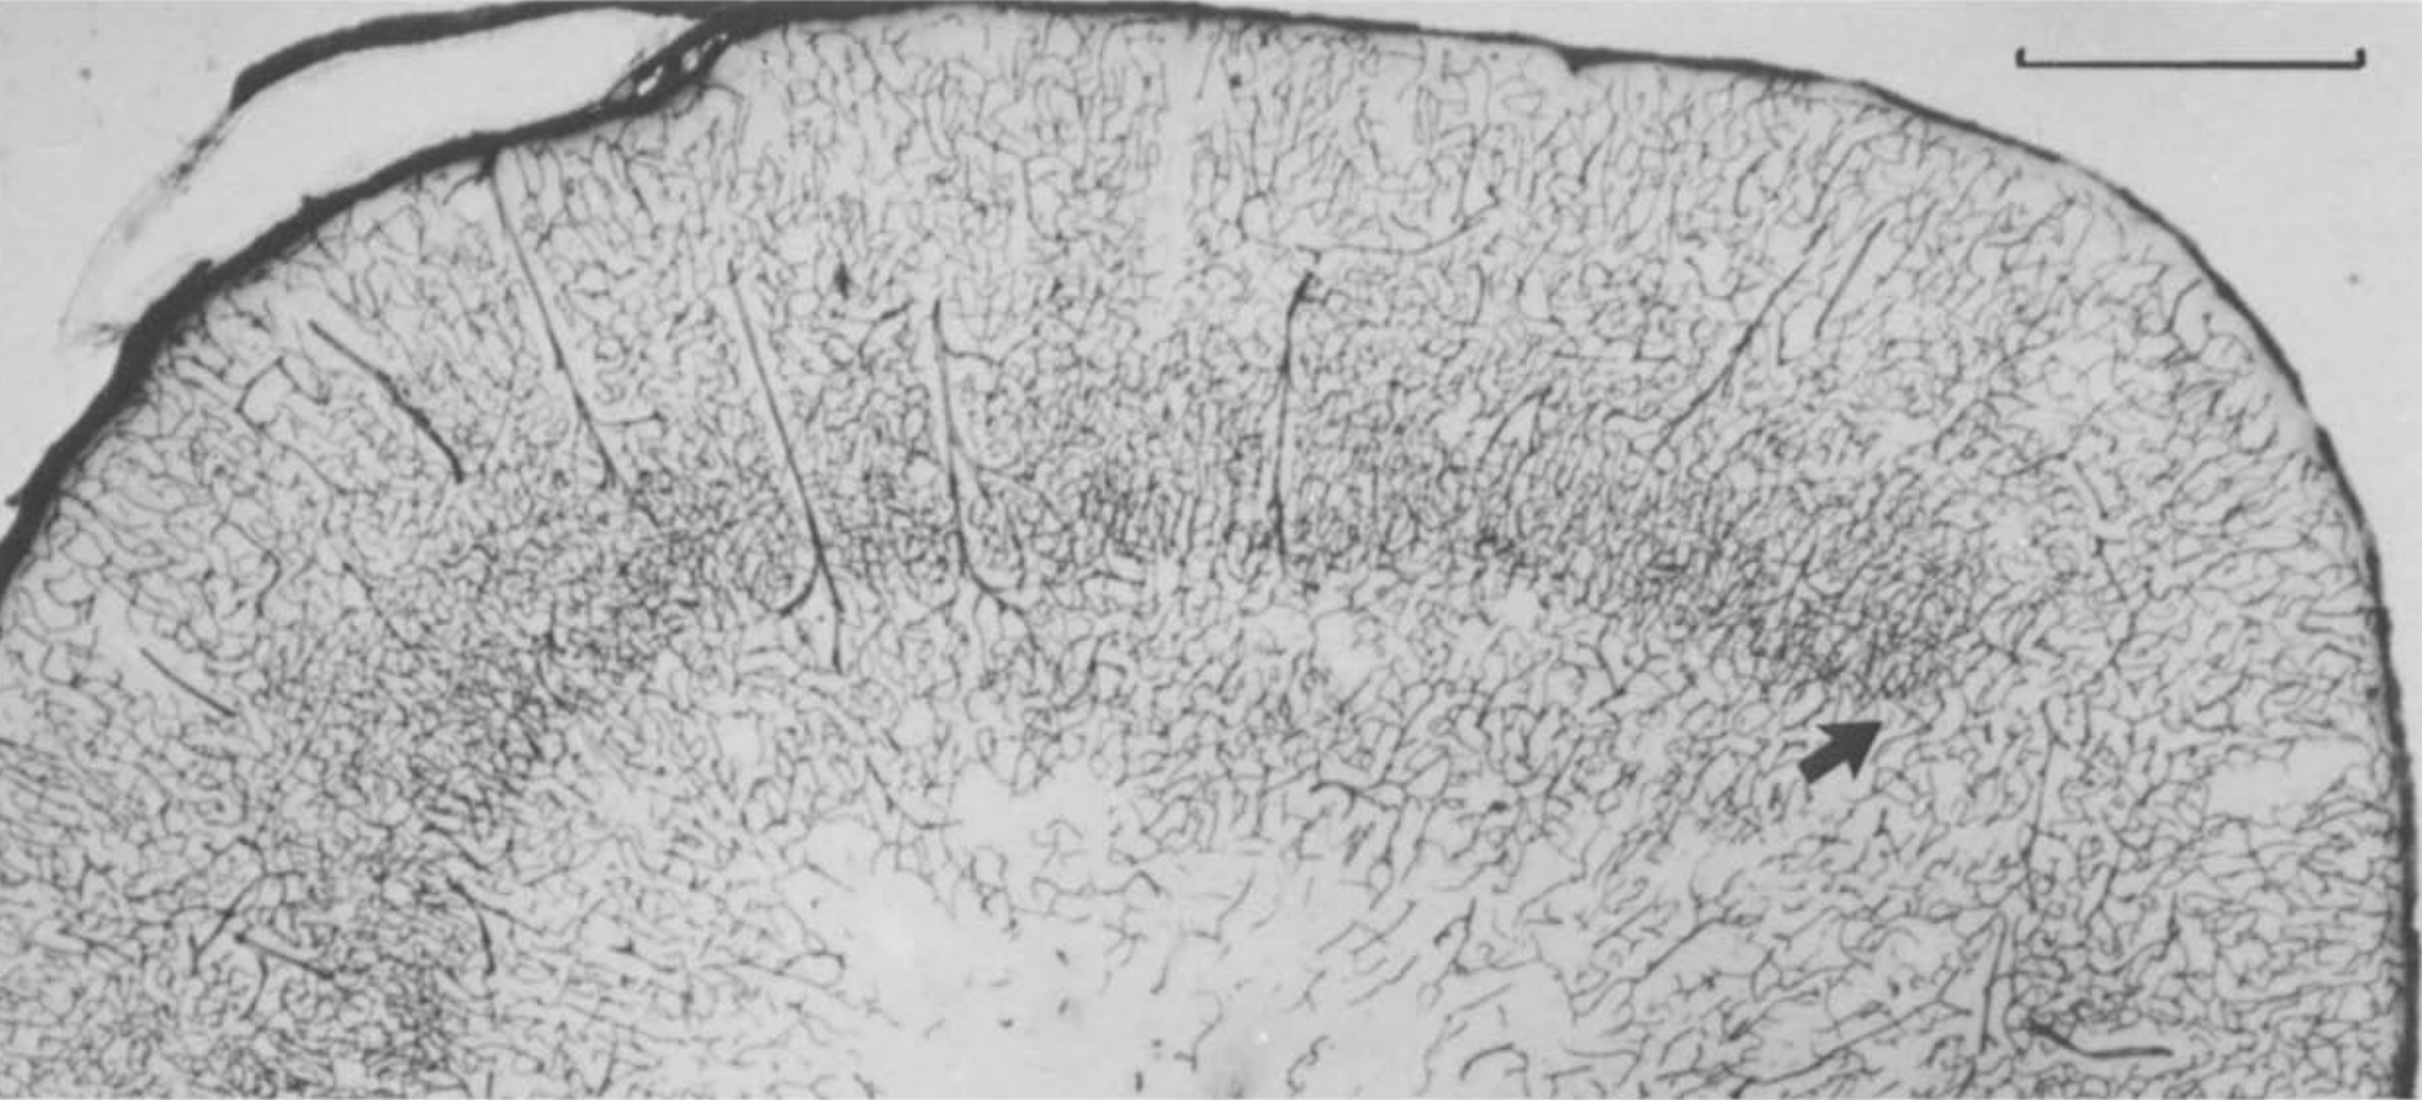
Reina-De La Torre et al., 1998 // FIG 3 // Scanning electron micrograph showing an overview of a corrosion cast from a human temporal cerebral cortex. Both the arterial and venous distributions are shown. The arrow indicates the transcortical artery. 1, pial artery; 2, long cortical artery; 3, middle cortical artery; 4, short cortical artery; 5, cortical vein; 6, subpial zone; 7, precapillary vessels with blind endings; 8, superficial capillary zone; 9, middle capillary zone; 10, deep capillary zone. Scale bar 5 375 μm.
doi.org/10.1002/(SICI)1097-0185(199805)251:1%3C87::AID-AR14%3E3.0.CO;2-7
Reina-De La Torre et al., 1998 // FIG 4 // Scanning electron micrograph showing an overview of a corrosion cast from a human occipital cerebral cortex. Both the arterial distribution and capillary networks are shown. 1, pial artery; 2, pial vein; 3, subpial zone; 4, superficial capillary zone; 5, middle capillary zone; 6, deep capillary zone; 7, short cortical artery; 8, middle cortical artery; 9, long cortical artery. Scale bar 5 430 μm.
doi.org/10.1002/(SICI)1097-0185(199805)251:1%3C87::AID-AR14%3E3.0.CO;2-7
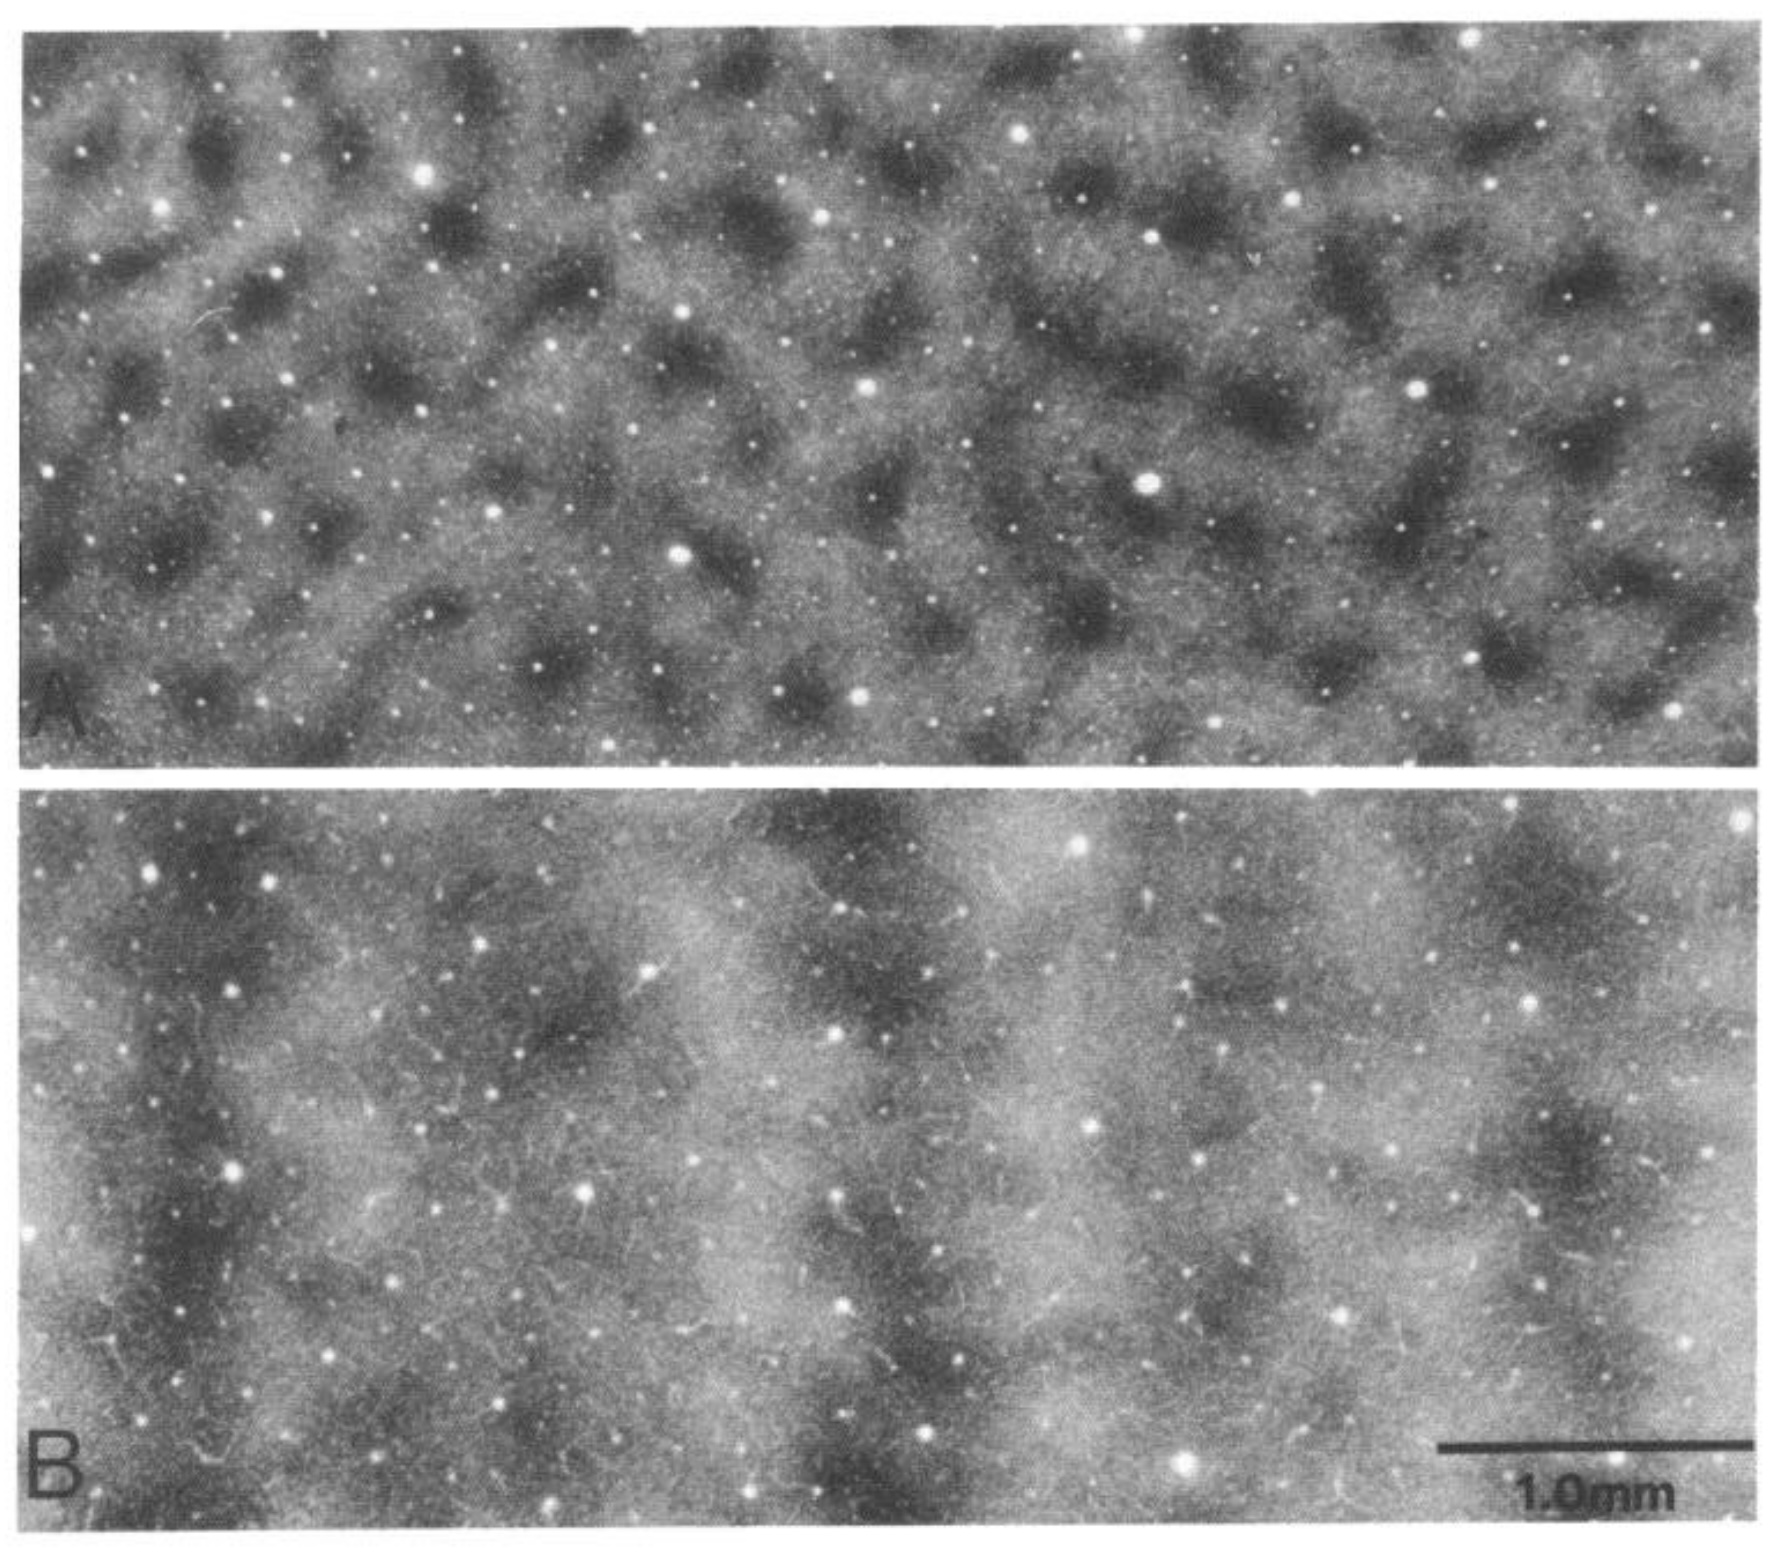
Zheng, LaMantia, Purves, 1991 // FIG 1 // Low-power photomicrographs of cytochrome oxidase-stained modules in the squirrel monkey visual cortex. Panel A shows blobs in a tangential section through laminae II-III of area 17. Panel B shows stripes in a tangential section through laminae II-III of area 18. The white spots are empty spaces remained from meso-vessels.
doi.org/10.1523/JNEUROSCI.11-08-02622.1991
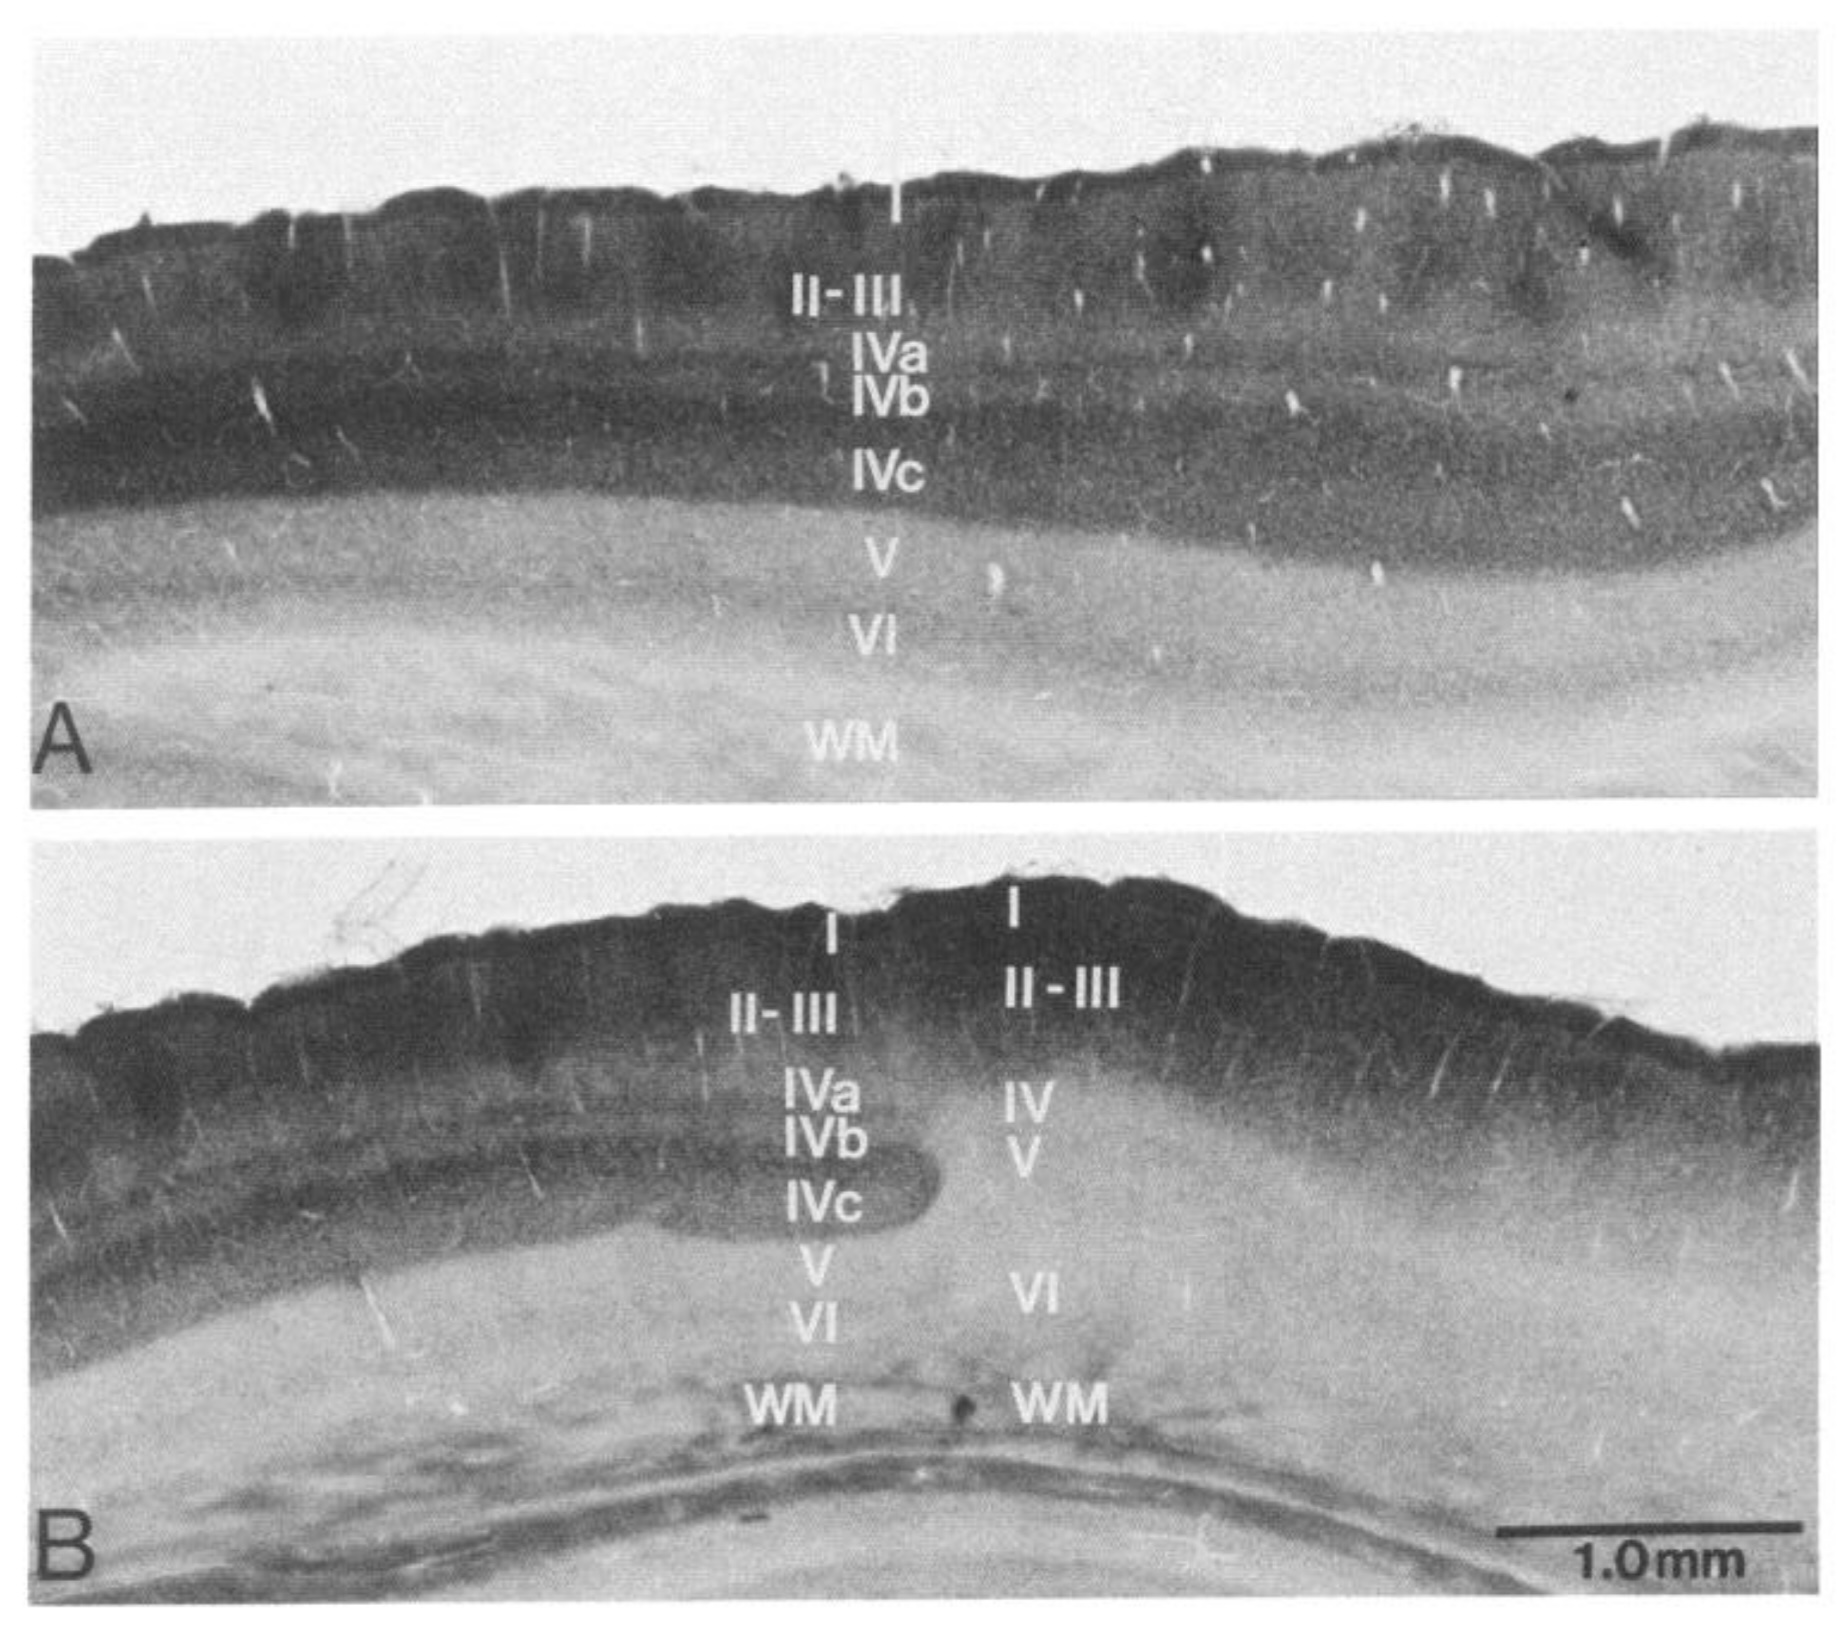
Zheng, LaMantia, Purves, 1991 // FIG 2 // Low-power photomicrographs of laminar and regional features of the squirrel monkey visual cortex stained with cytochrome oxidase. Panel A shows cortical laminae in a coronal section through area 17. Note blobs in layers IJ and III. Panel B shows border of area 17 (left) and area 18 (right). The white stripes and spots are empty spaces remainded from meso-vessels.
doi.org/10.1523/JNEUROSCI.11-08-02622.1991
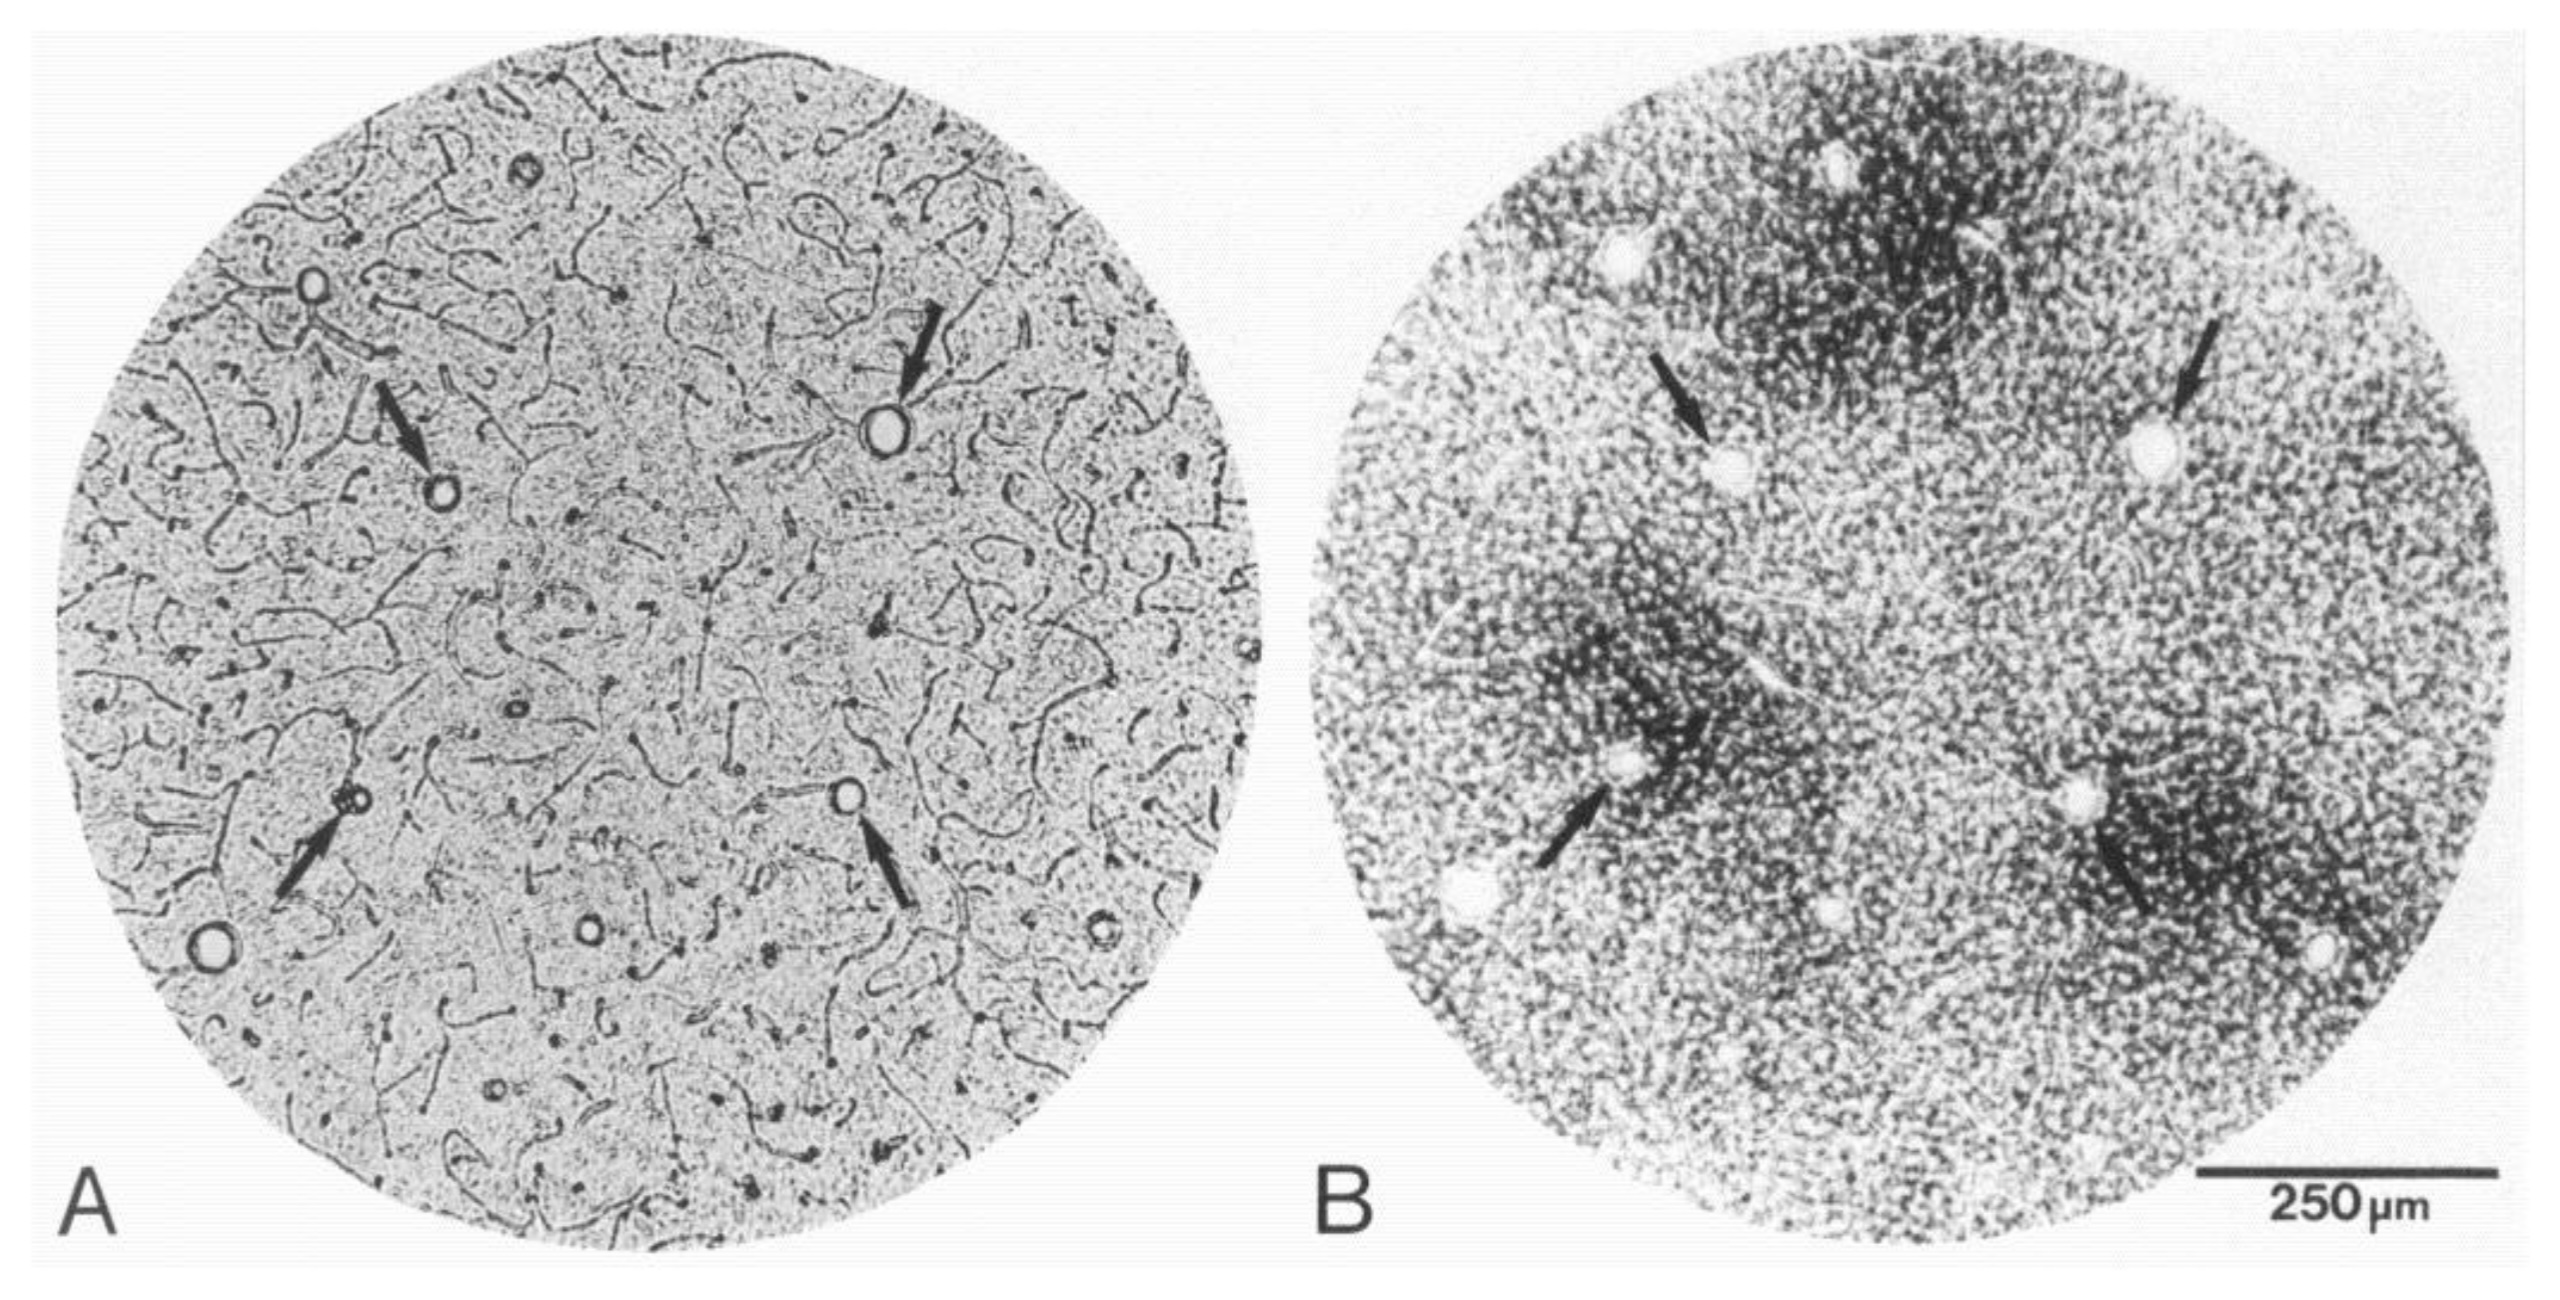
Zheng, LaMantia, Purves, 1991 // FIG 4 // Panel A shows cortical photomicrograph of microvessels in a 1.0-mm-diameter field from an unstained tangential section of area 17. Panel B shows The same field from an adjacent section stained with cytochrome oxidase. The arrows indicate radial meso-vessels. Squirrel monkey cortex.
doi.org/10.1523/JNEUROSCI.11-08-02622.1991
Bell and Ball, 1985 // FIG 1 // Human visual cortex, upper calcarine lip (alkaline phosphatase, 100 μm section). The arrow indicates changing capillary density in layer IV which ends abruptly at striate-parastriate junction. Scale bar is 1 mm.
doi.org/10.1016/0006-8993(85)90284-7
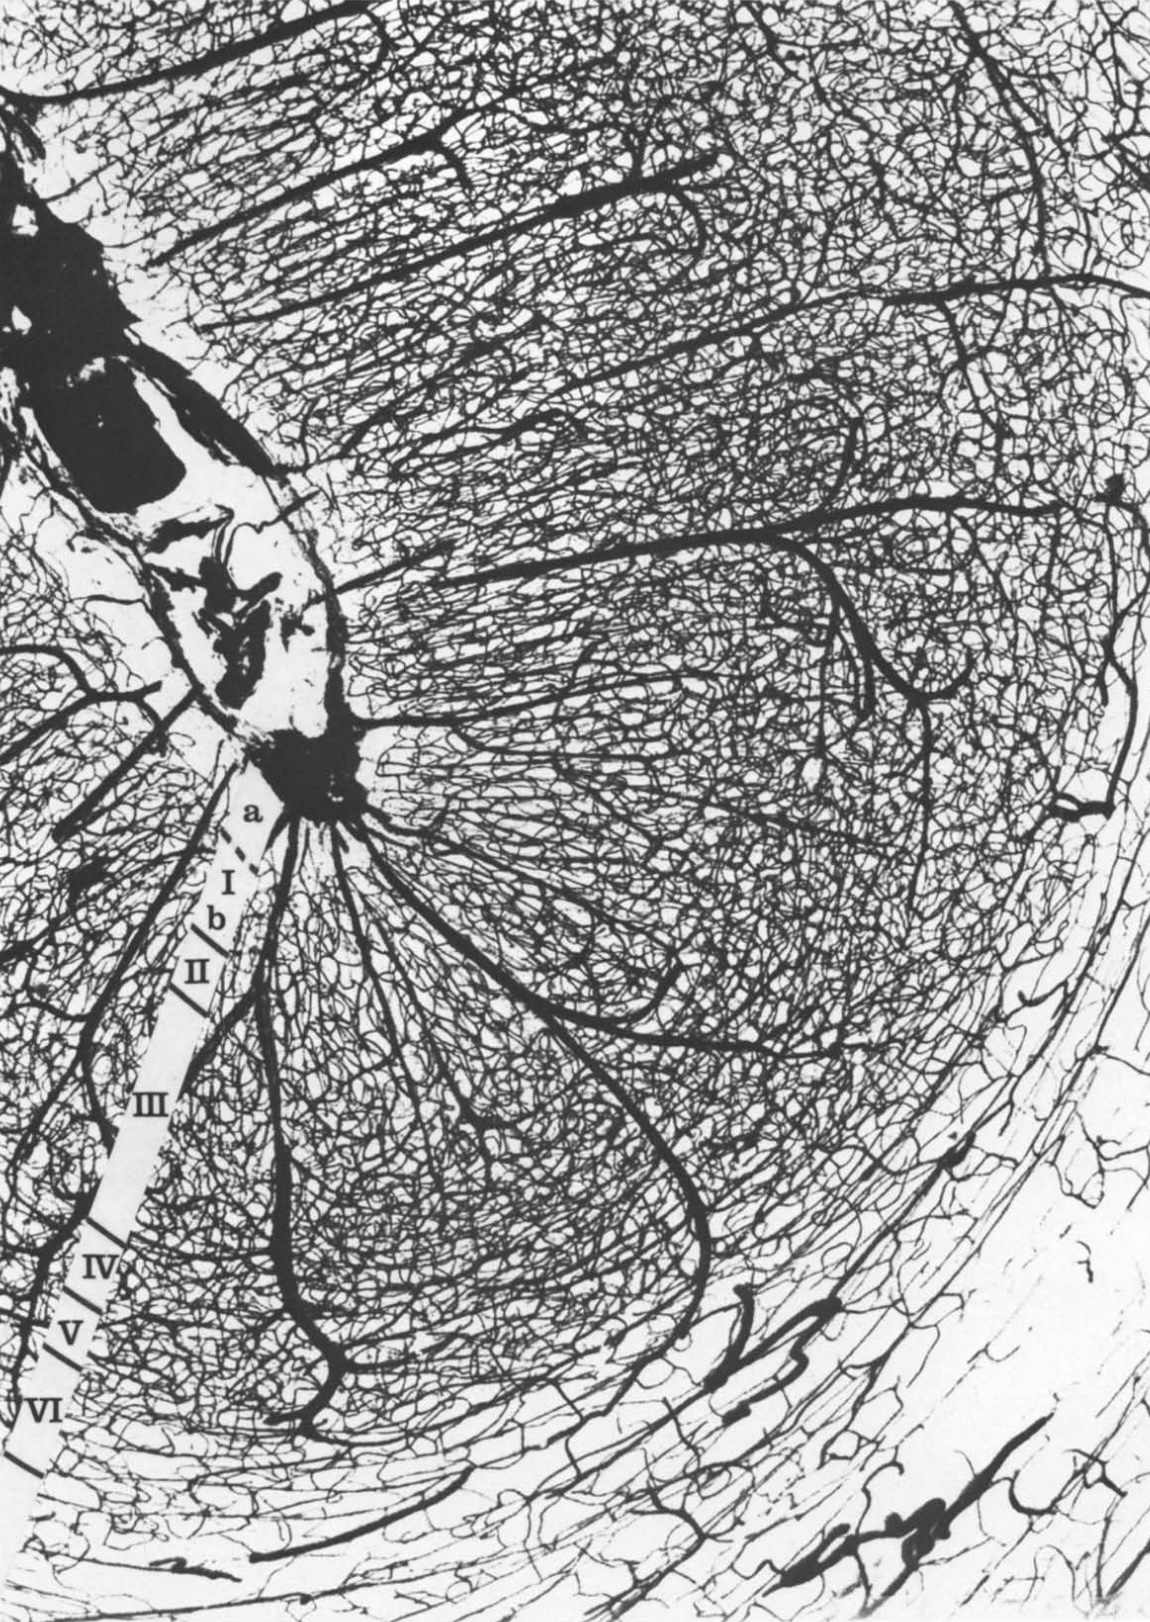
Duvernoy, Delon, Vannson, 1981 // FIG 43 // Vascular territory of a principal intracortical vein. Human post mortem intravascular injection of india ink and gelatin photography.
doi.org/10.1016/0361-9230(81)90007-1
Duvernoy, Delon, Vannson, 1981 // FIG 53 // Cortical section of a sulcus bottom. Human post mortem intravascular injection of india ink and gelatin photography.
doi.org/10.1016/0361-9230(81)90007-1
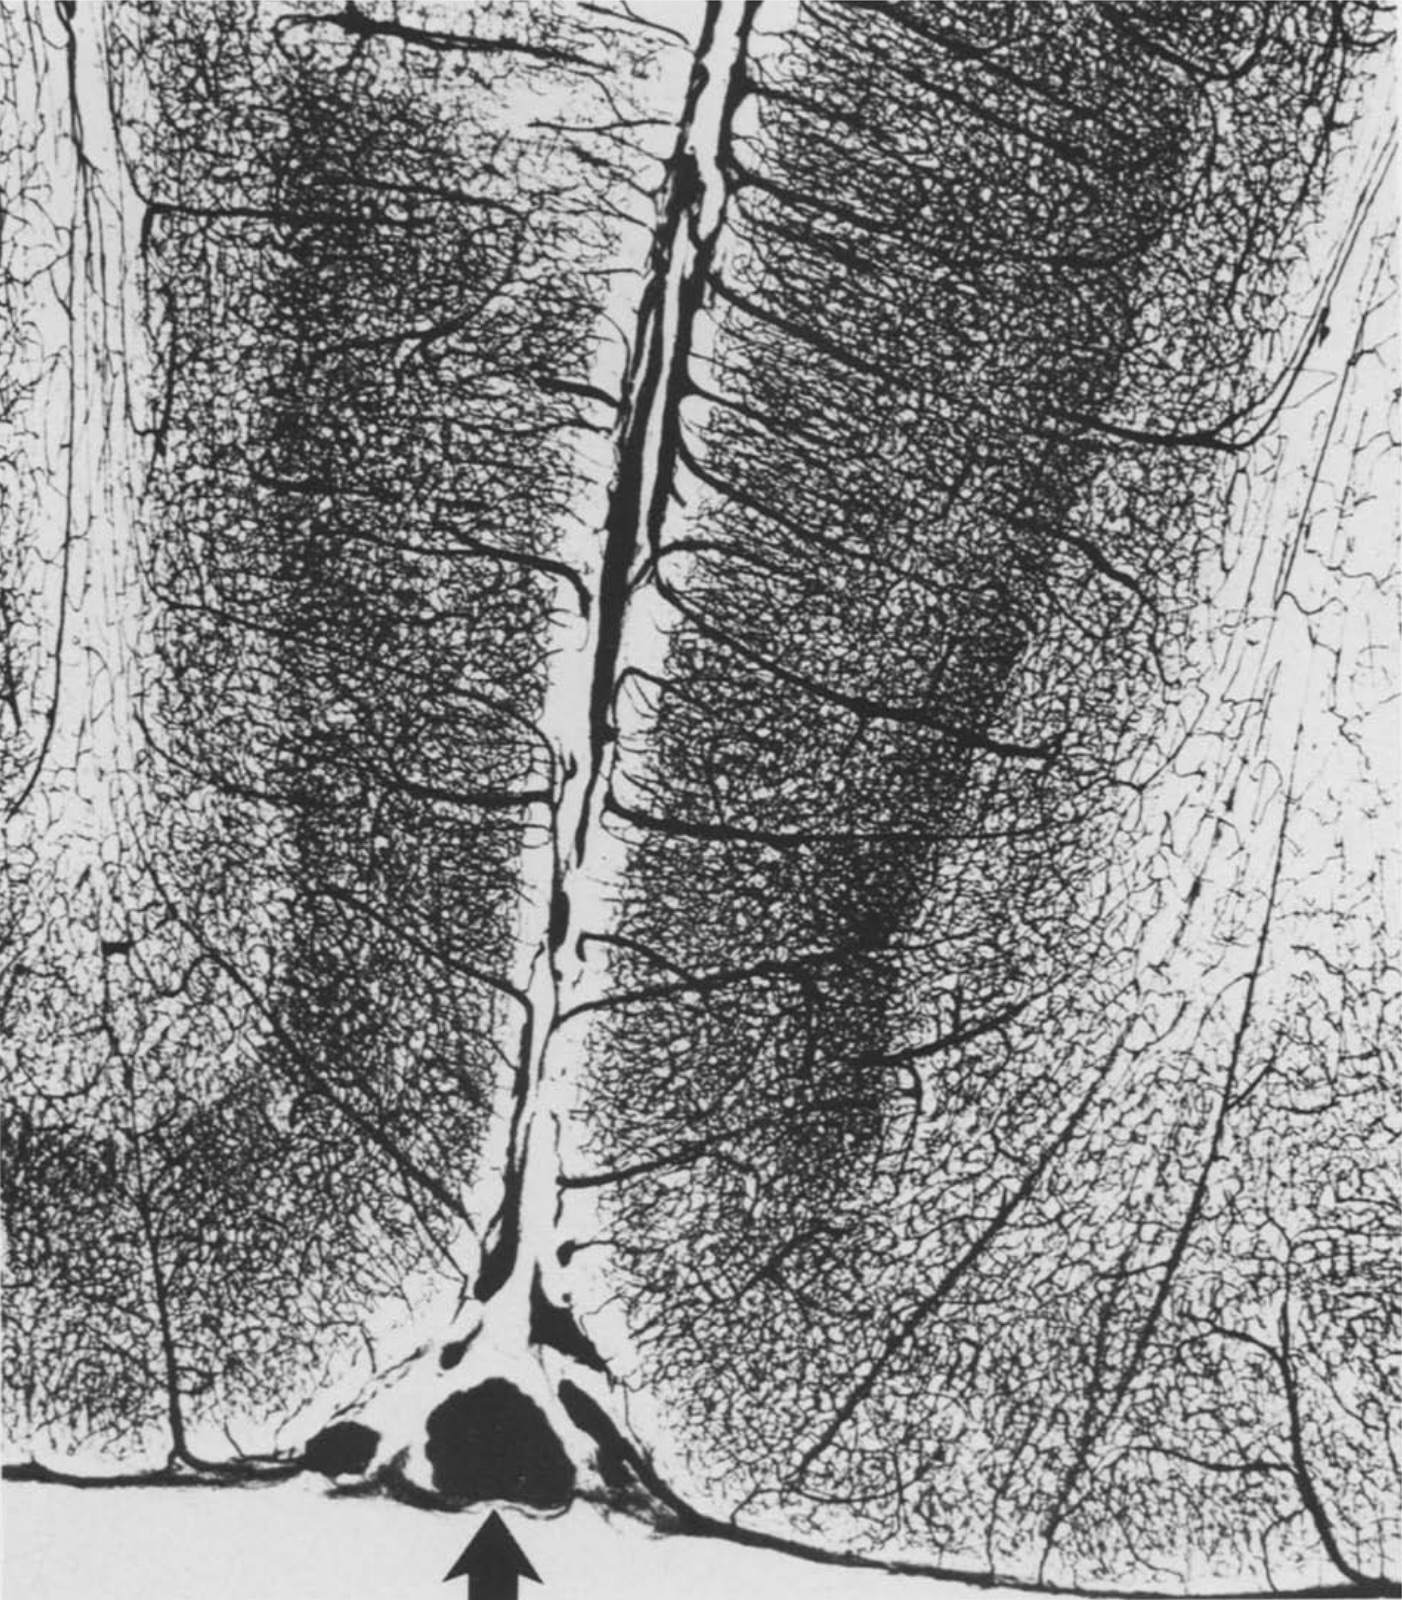
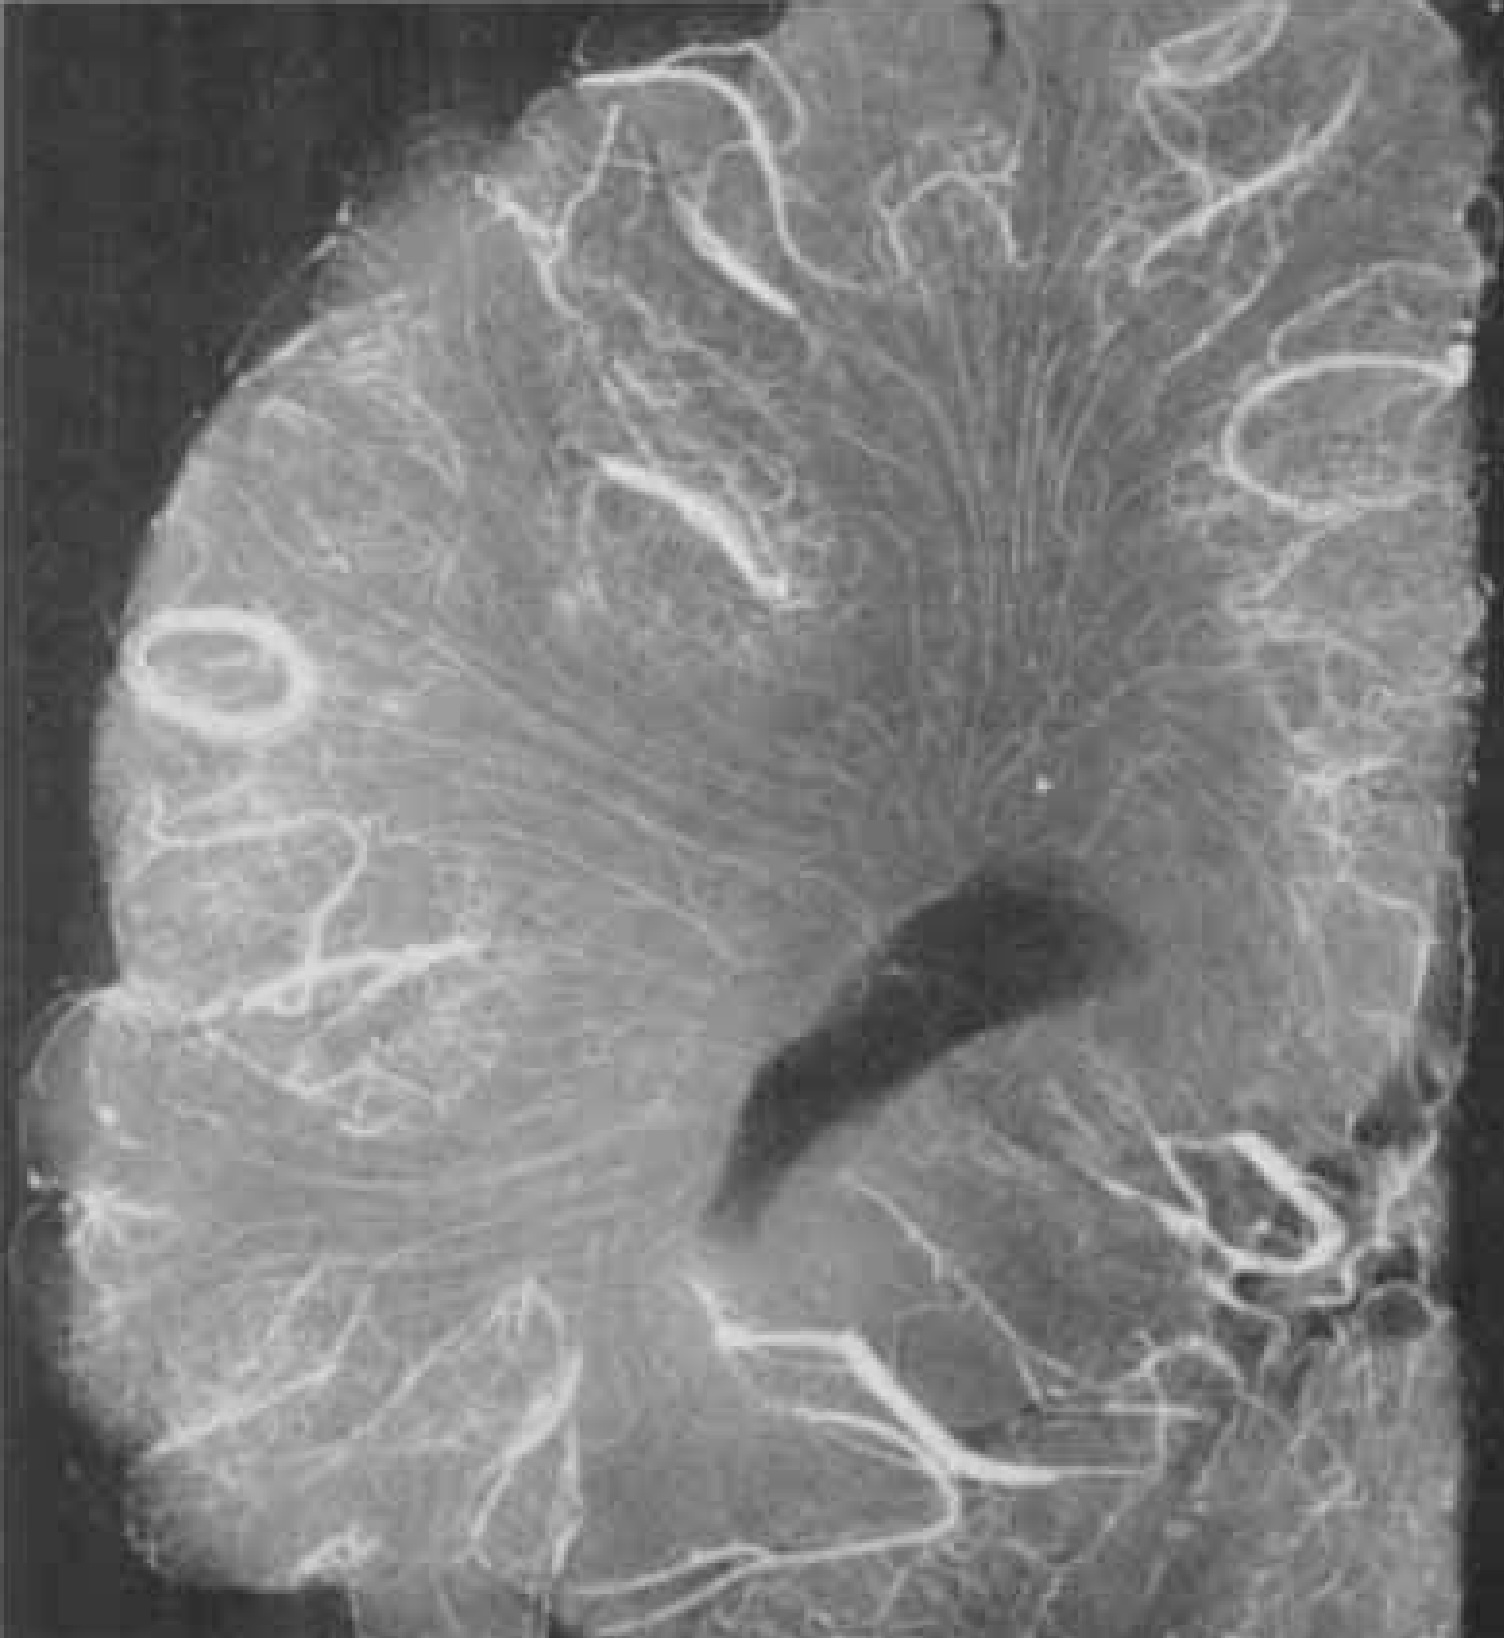
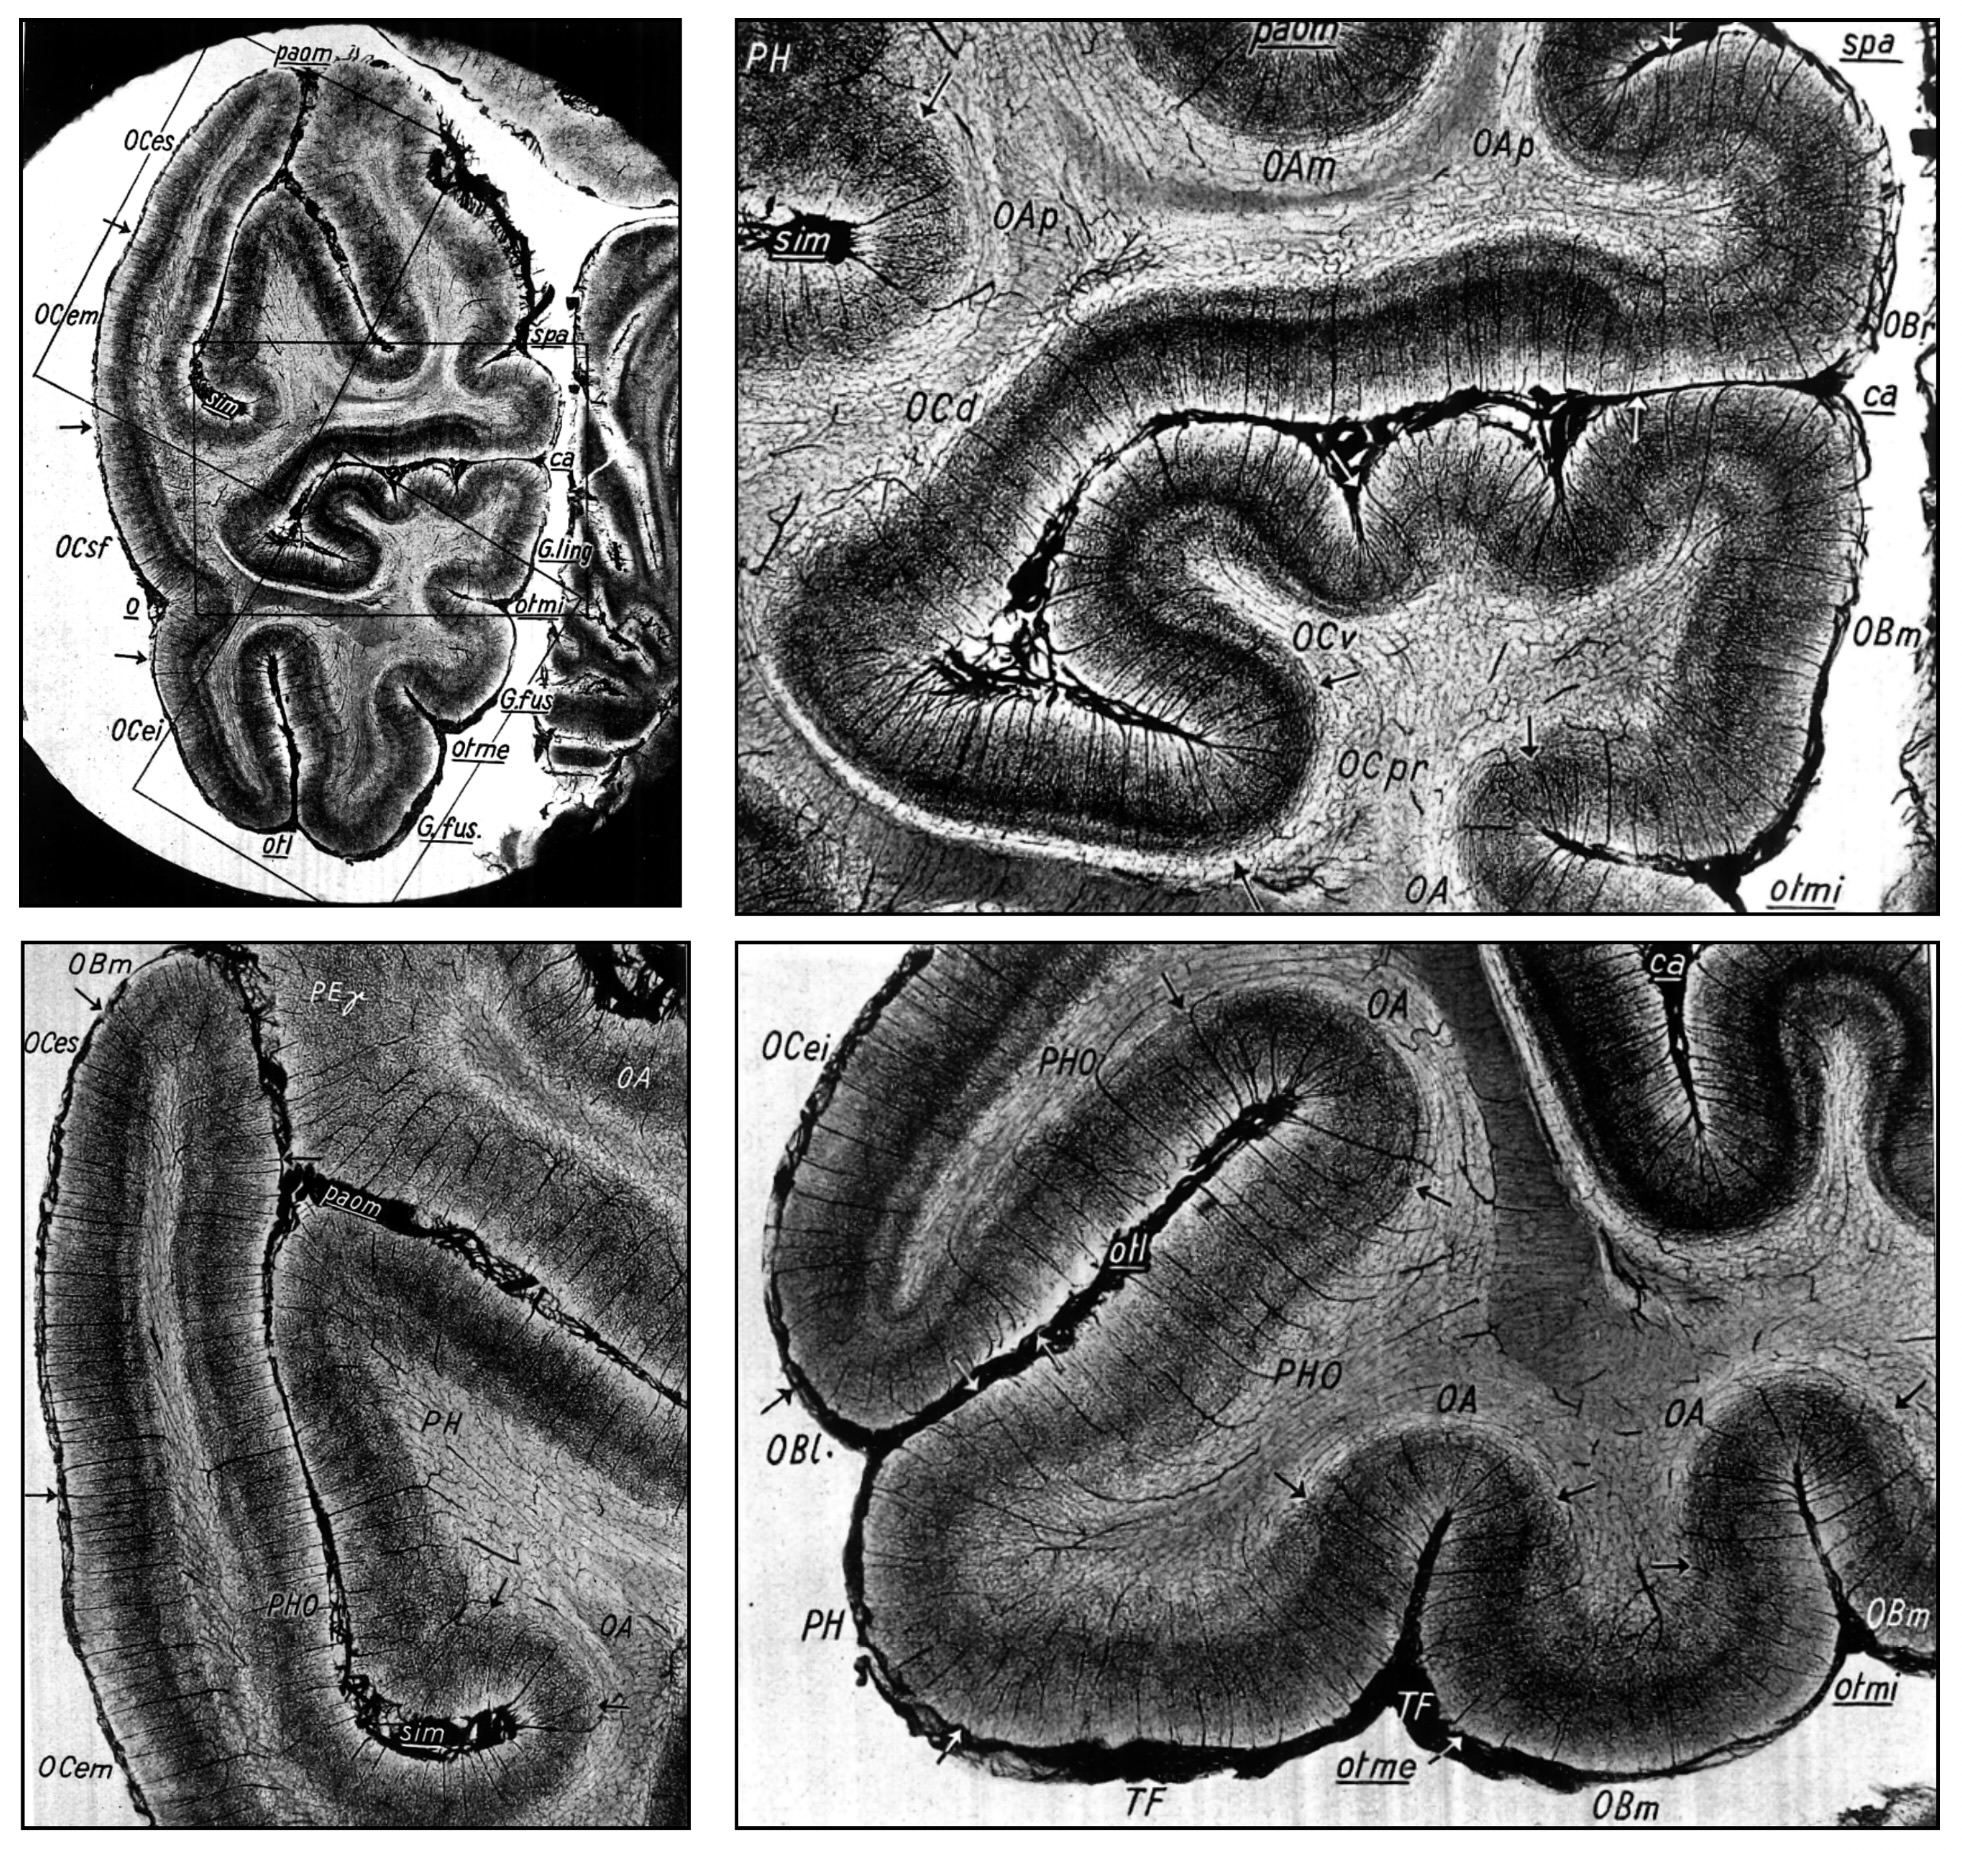
Duvernoy, Delon, Vannson, 1981 // FIG 59 // Striate cortex. Note the intensive vascular density of the middle vascular layer. The arrow indicates the calcarine fissure. Human post mortem intravascular injection of india ink and gelatin photography.
doi.org/10.1016/0361-9230(81)90007-1
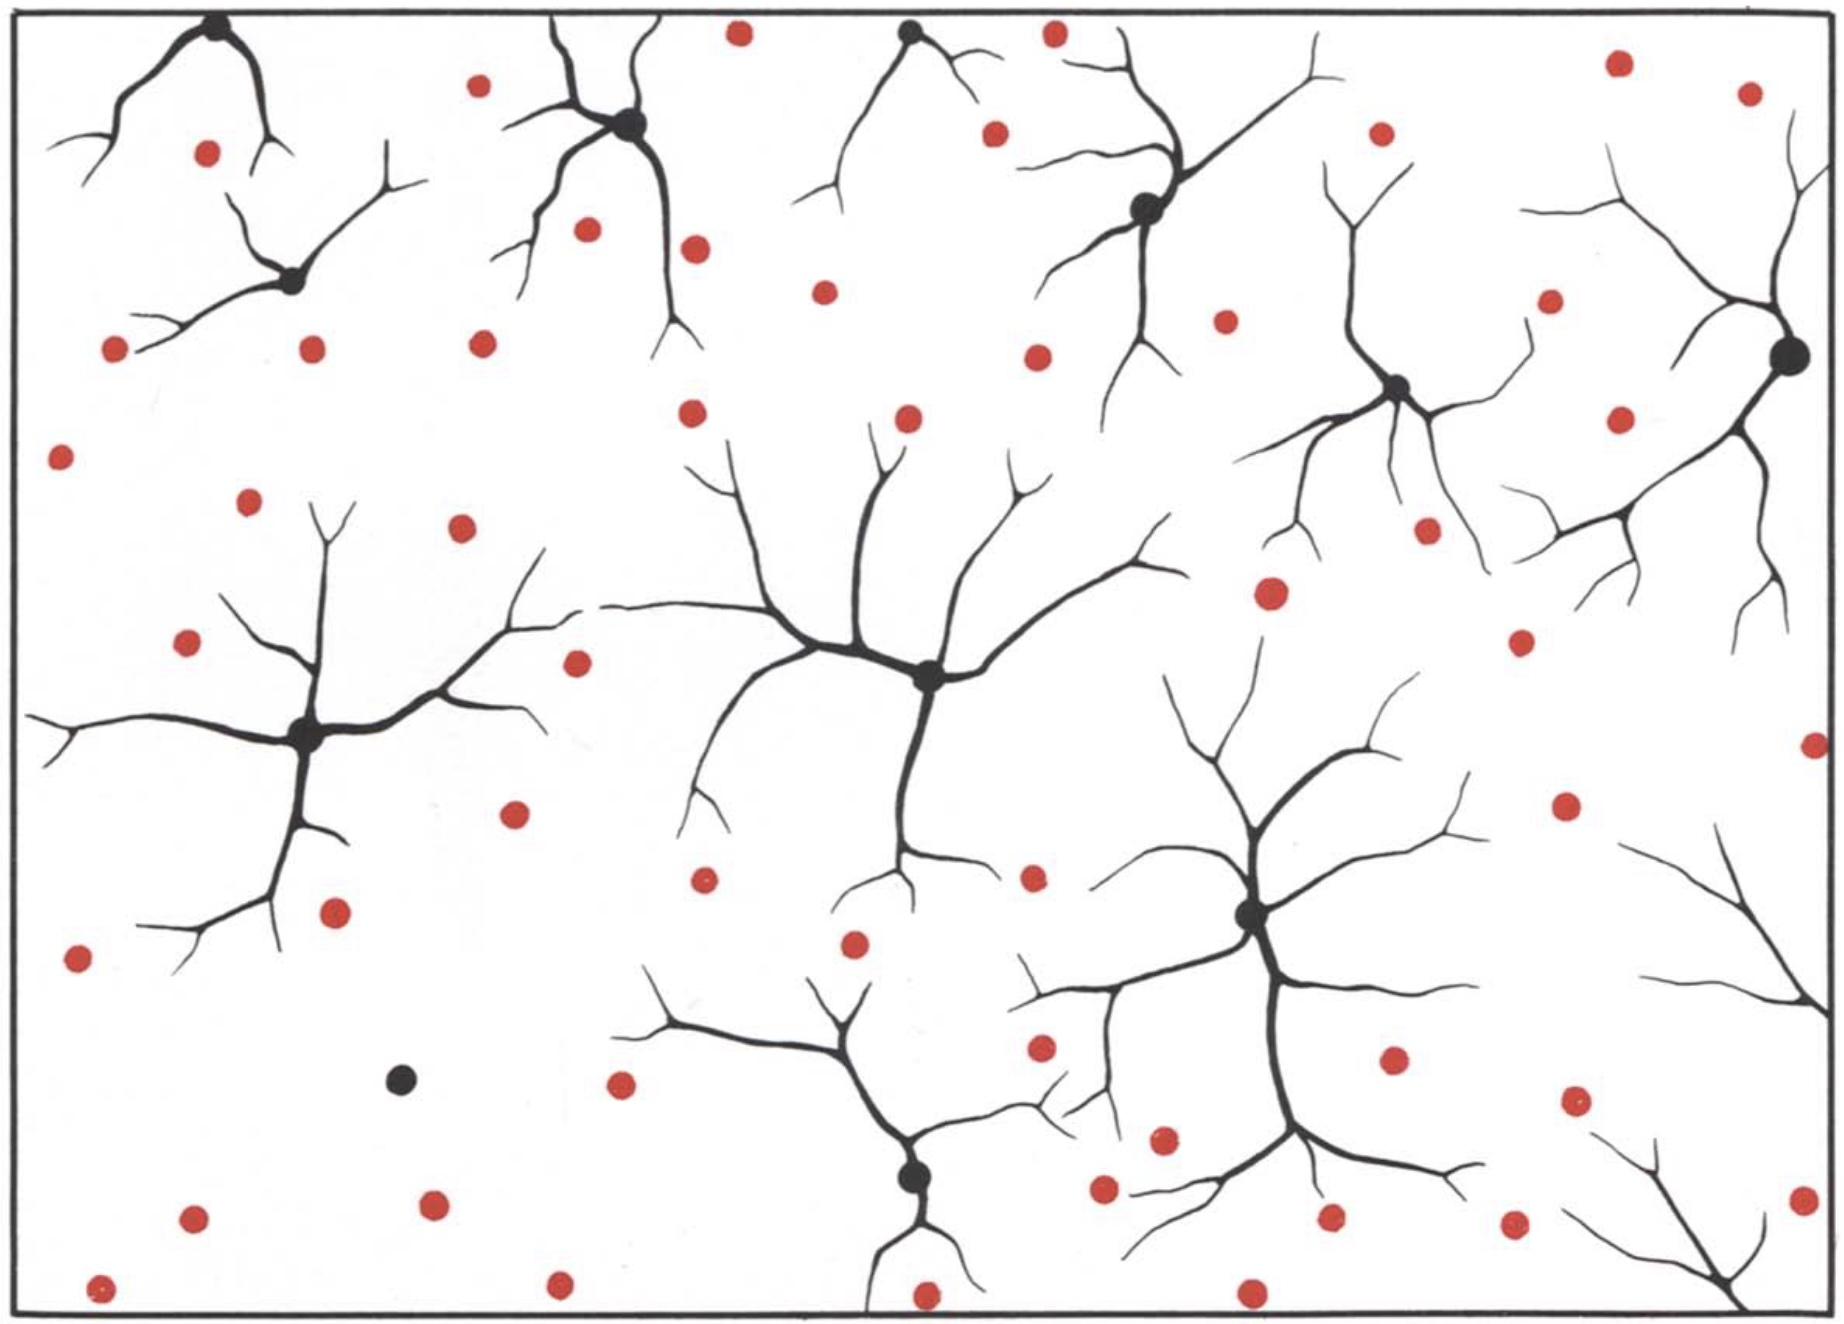
Duvernoy, Delon, Vannson, 1981 // FIG 63 // Tangential section of the human cortex. Drawing shows venous units with their arterial rings.
doi.org/10.1016/0361-9230(81)90007-1
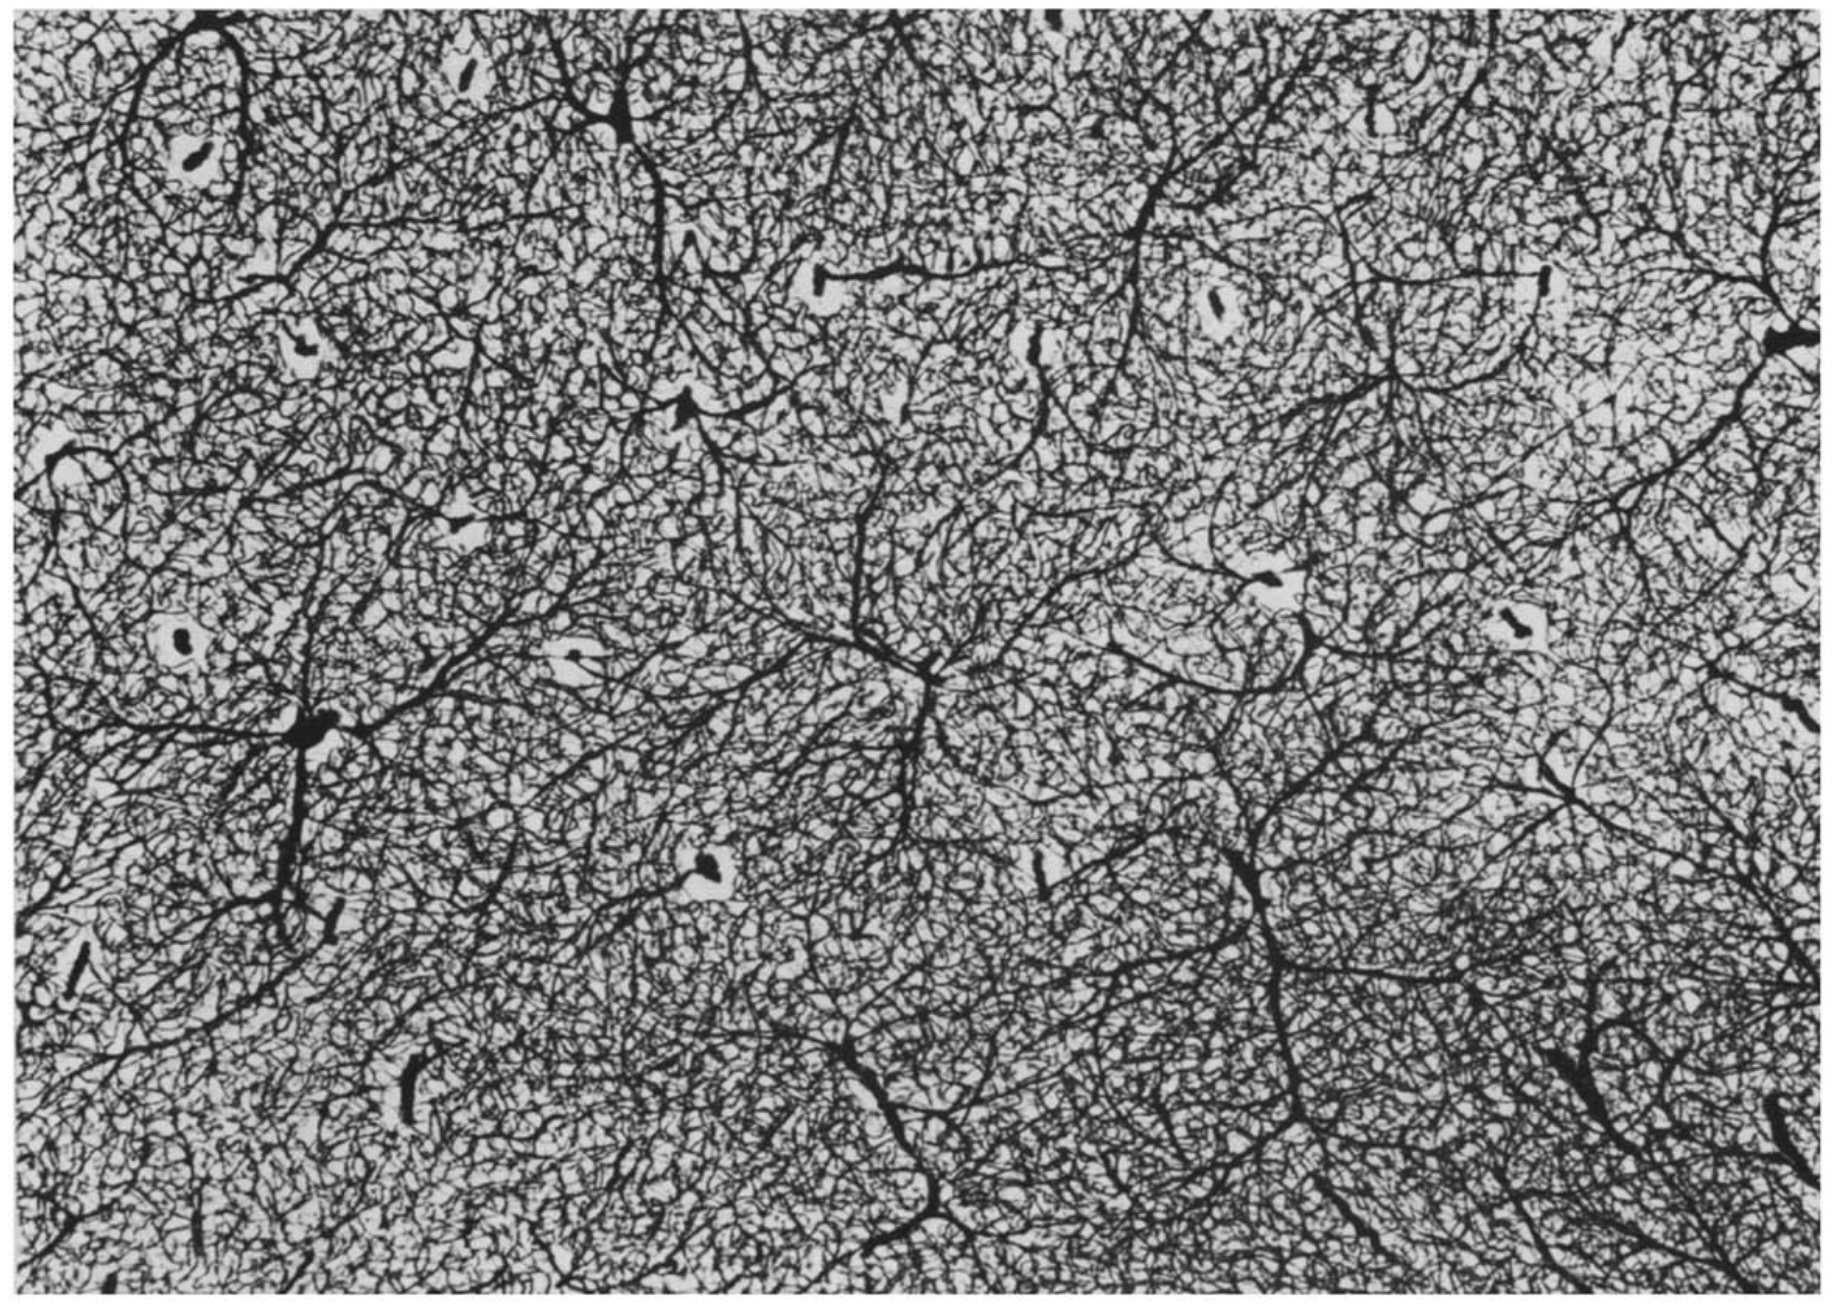
Duvernoy, Delon, Vannson, 1981 // FIG 64 // Tangential section of the human cortex. This photograph corresponds Figure 63 from the same manuscript. The authors note the capillary-free space around arteries and veins.
doi.org/10.1016/0361-9230(81)90007-1
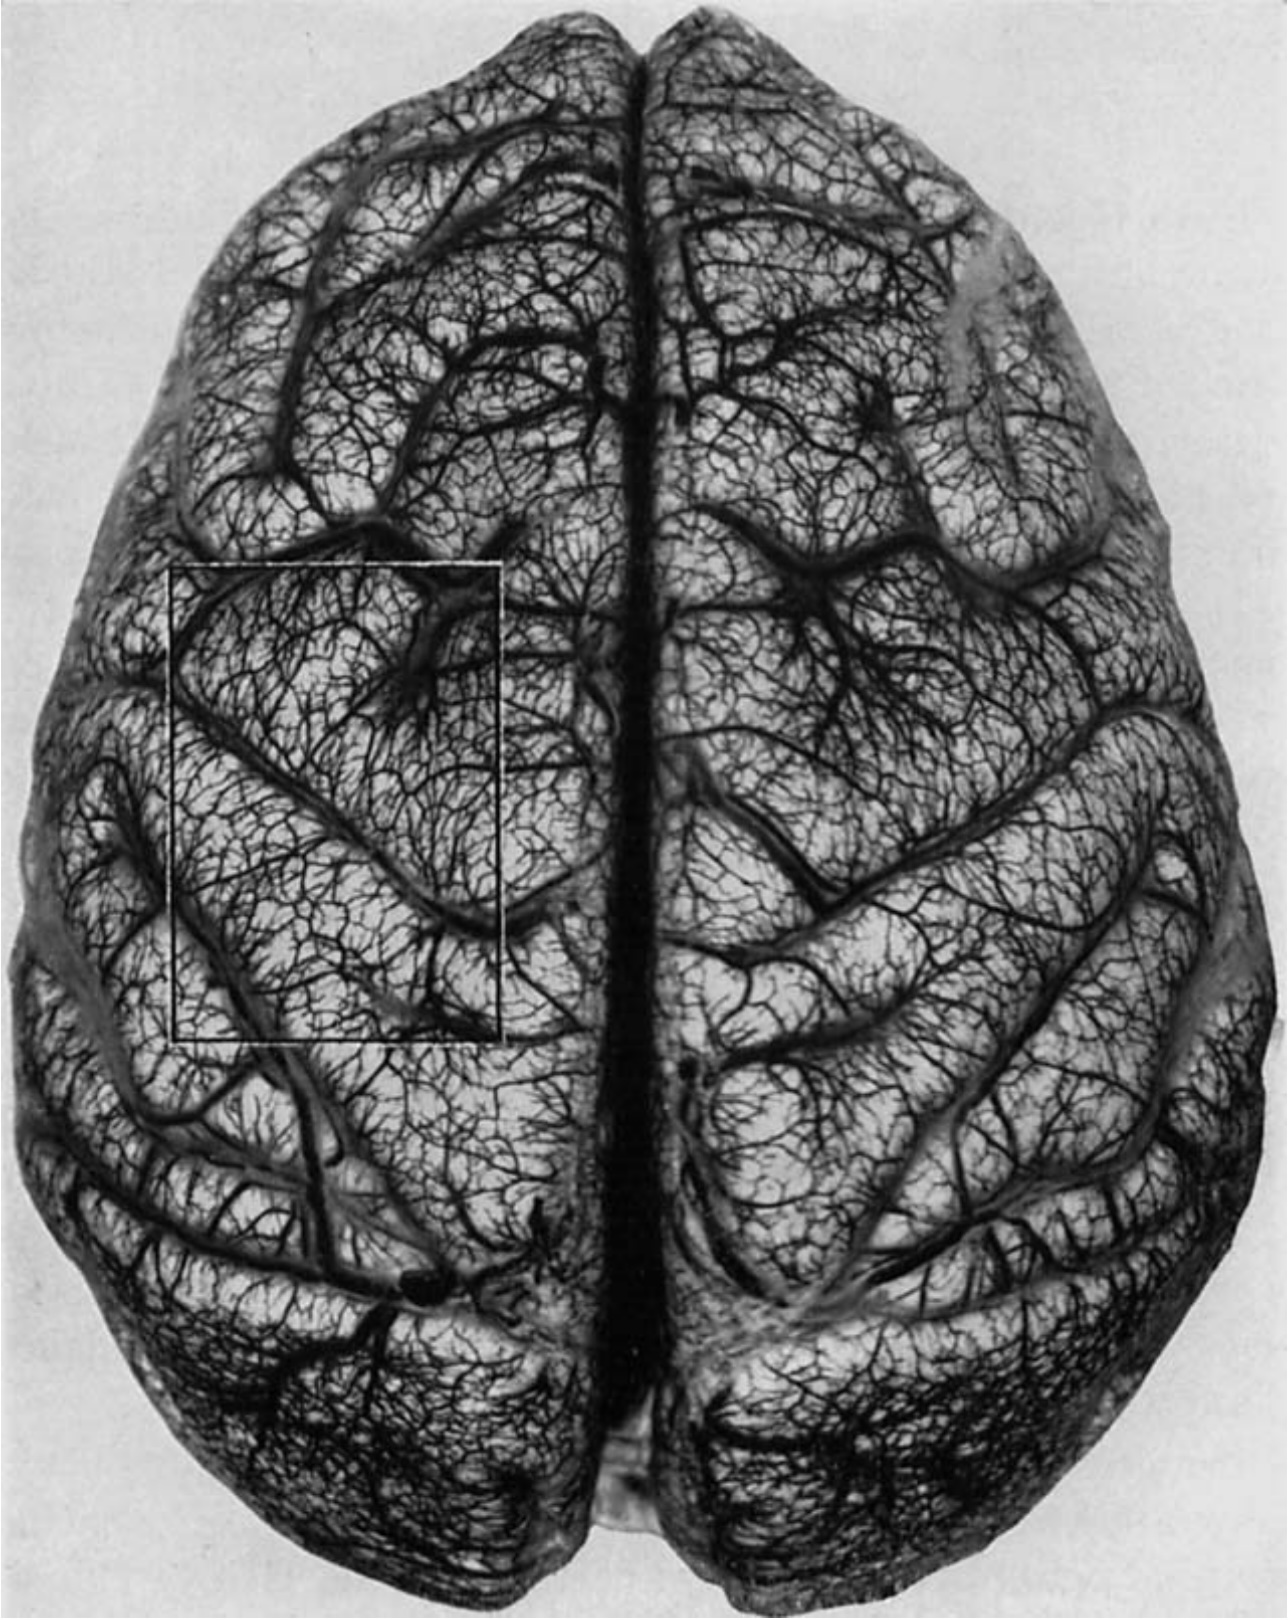
Rowbotham & Little 1965 // FIG 1 // Meso-vessels of the human brain. Radiography, micropaque filled vessels.
doi.org/10.1002/bjs.1800520104
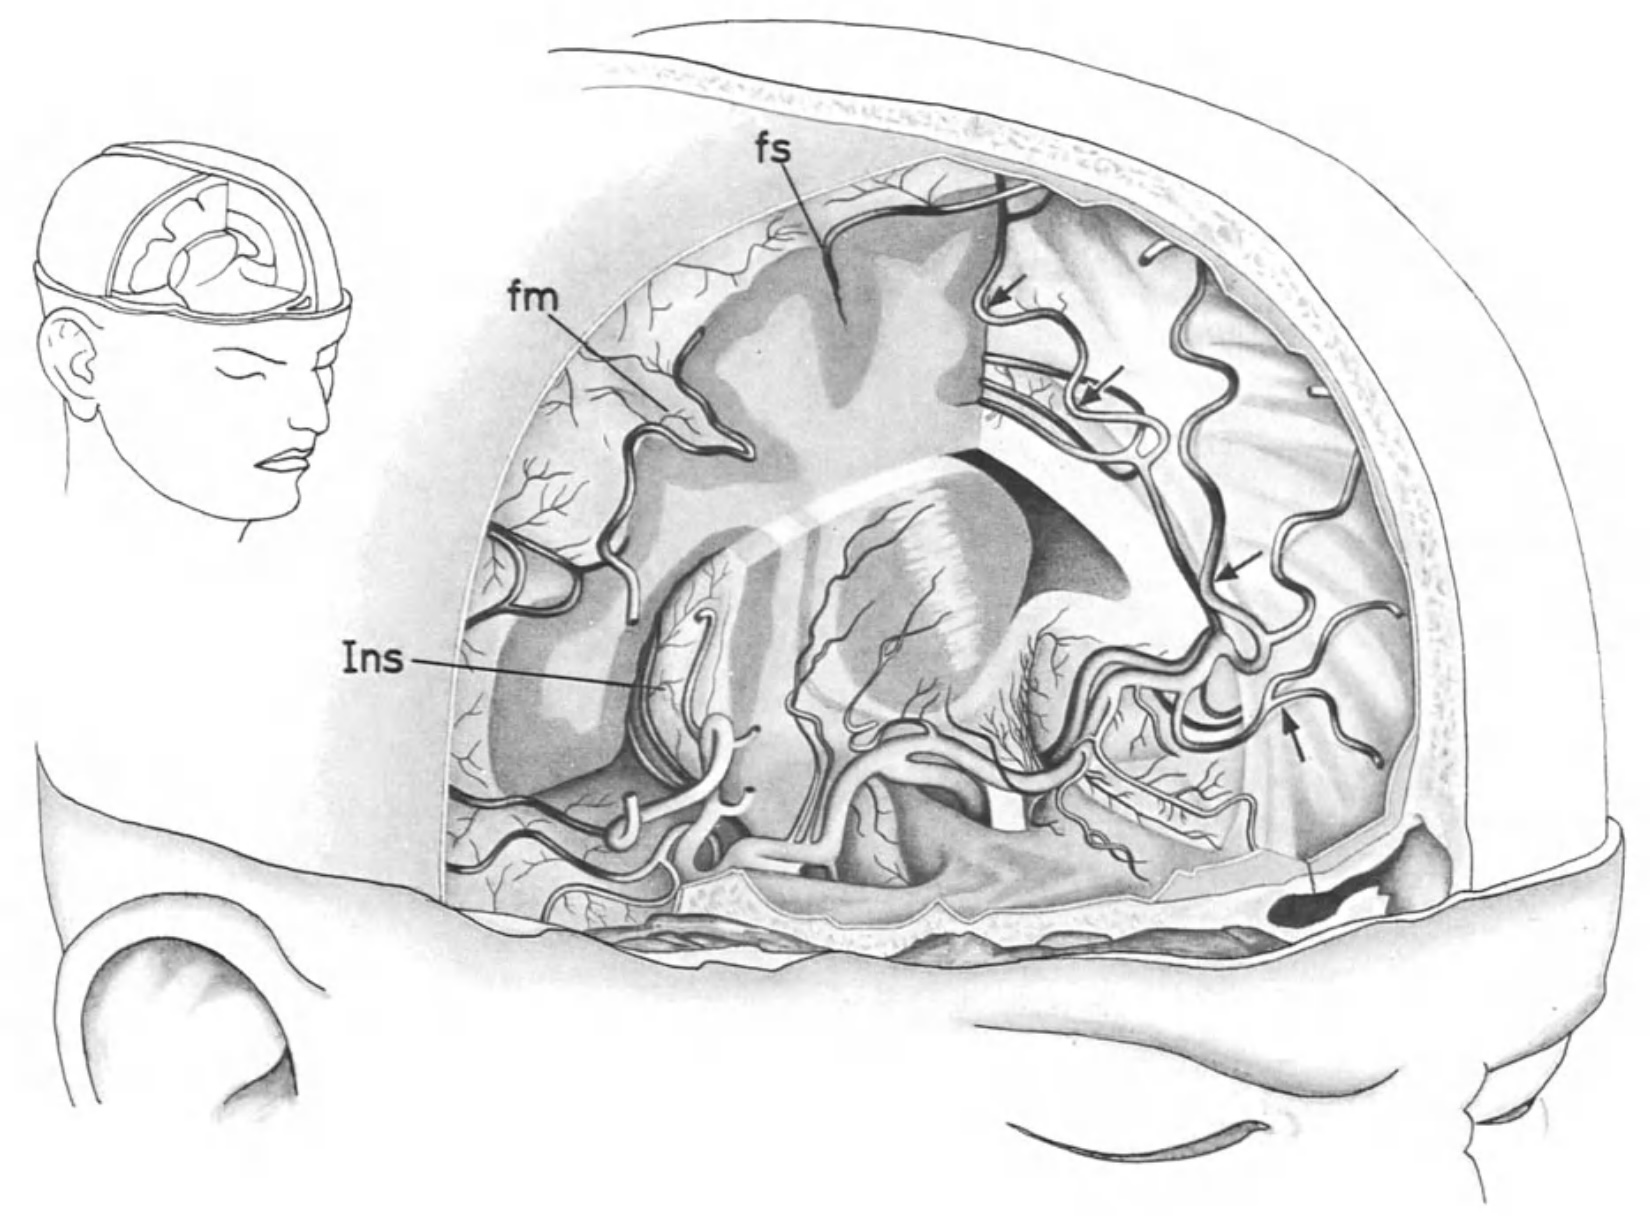
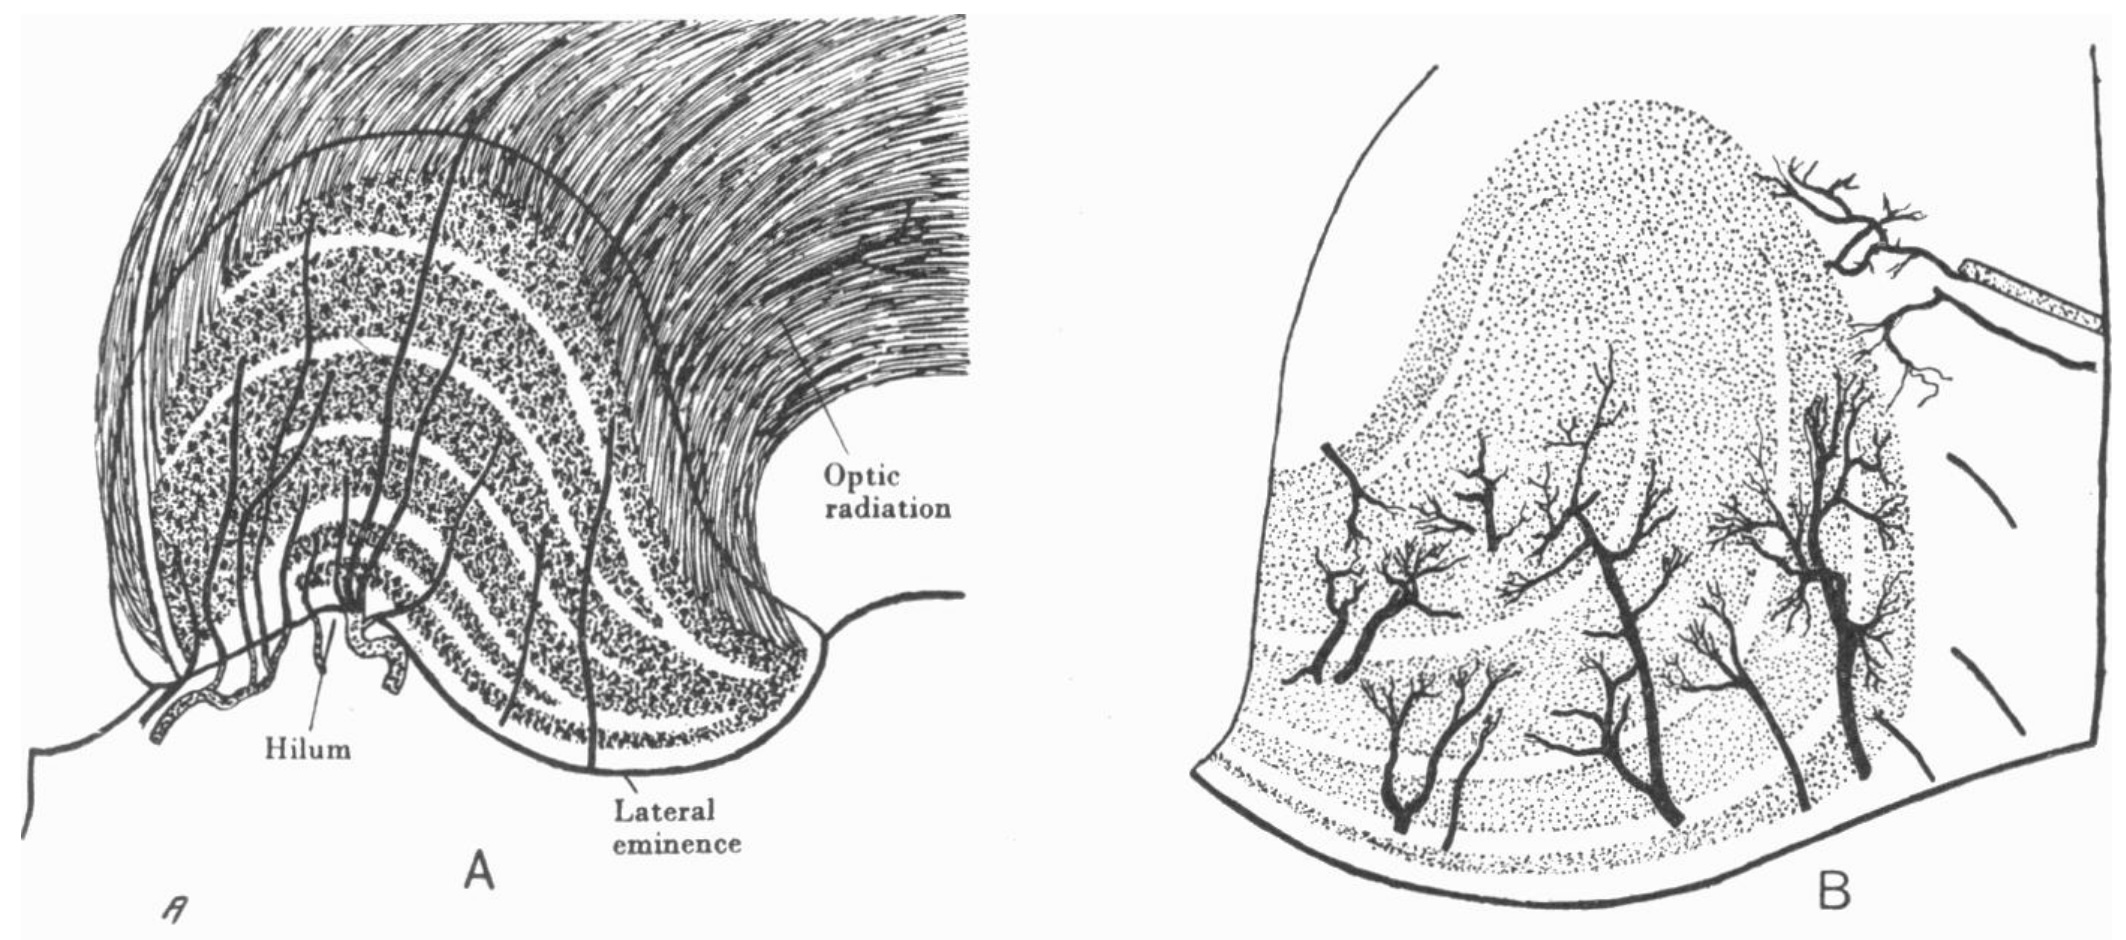
Szikla et al., 1977 // FIG 5 // Course of human brain arteries is seen from the carotid bifurcation to insular, opercular, lateral, and medial cortical surfaces. While they cross the sulci, arteries descend in the depth and climb again to the surface on the opposite wall. Note that position of the cingulate sulcus is clearly indicated by loops on the traversing arteries (arrows).
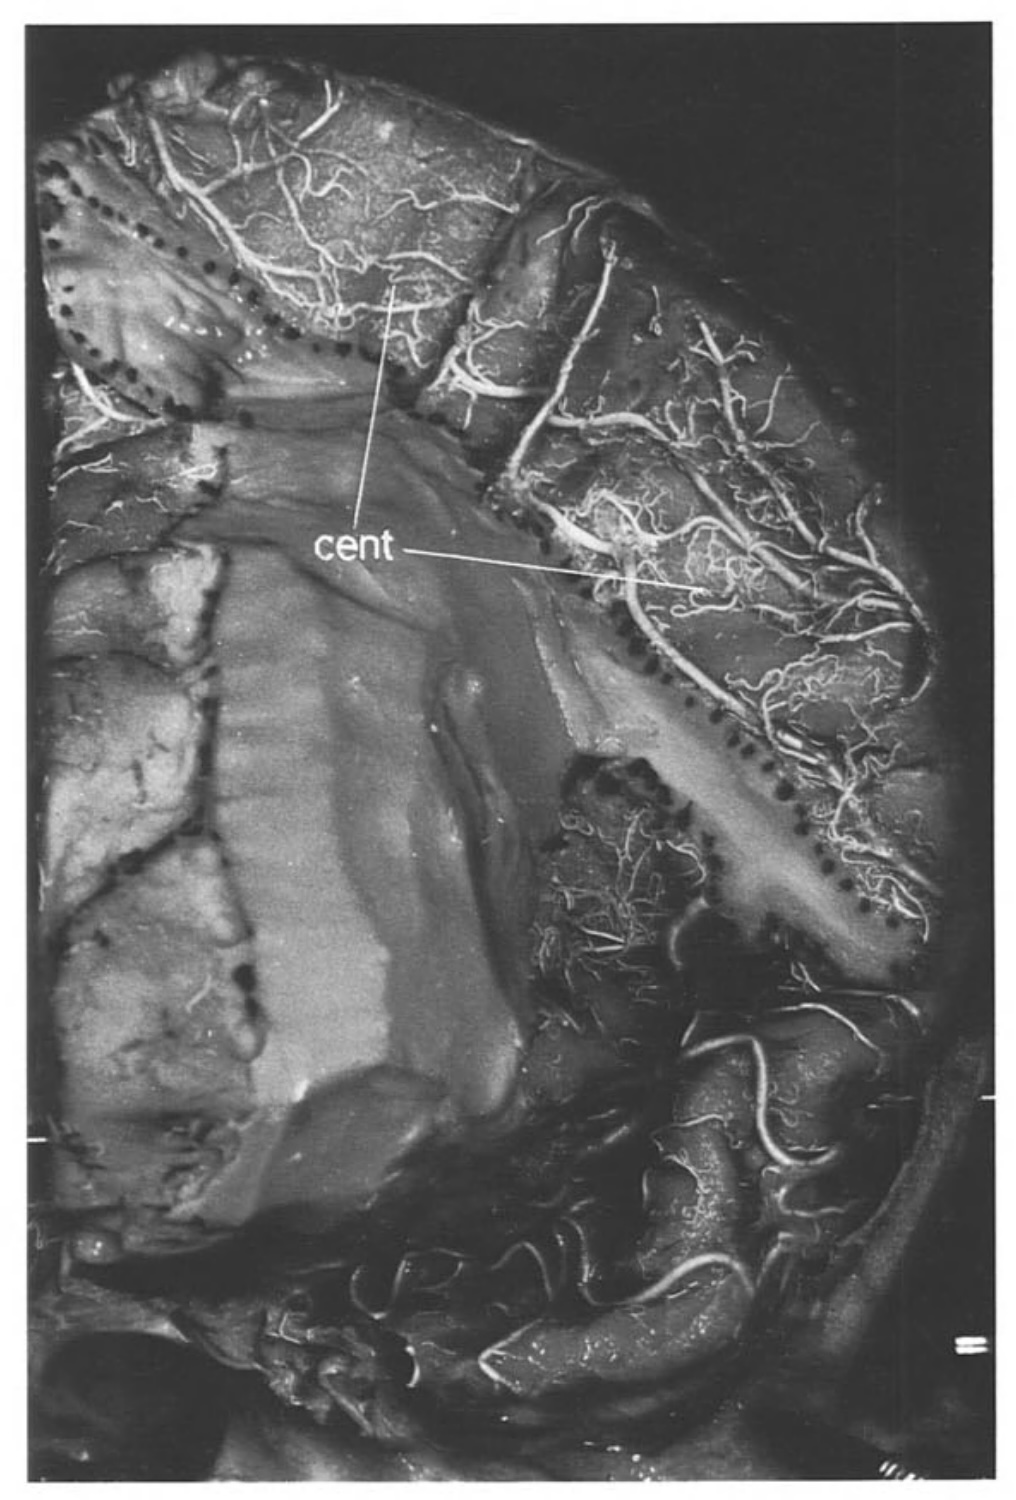
Szikla et al., 1977 // FIG 13 // Anterior view of the vascular lamina composed by all arterial branch running on the walls of the central sulcus (human). Precentral gyrus wall removed carefully, leaving the pial covering of it posterior aspect.
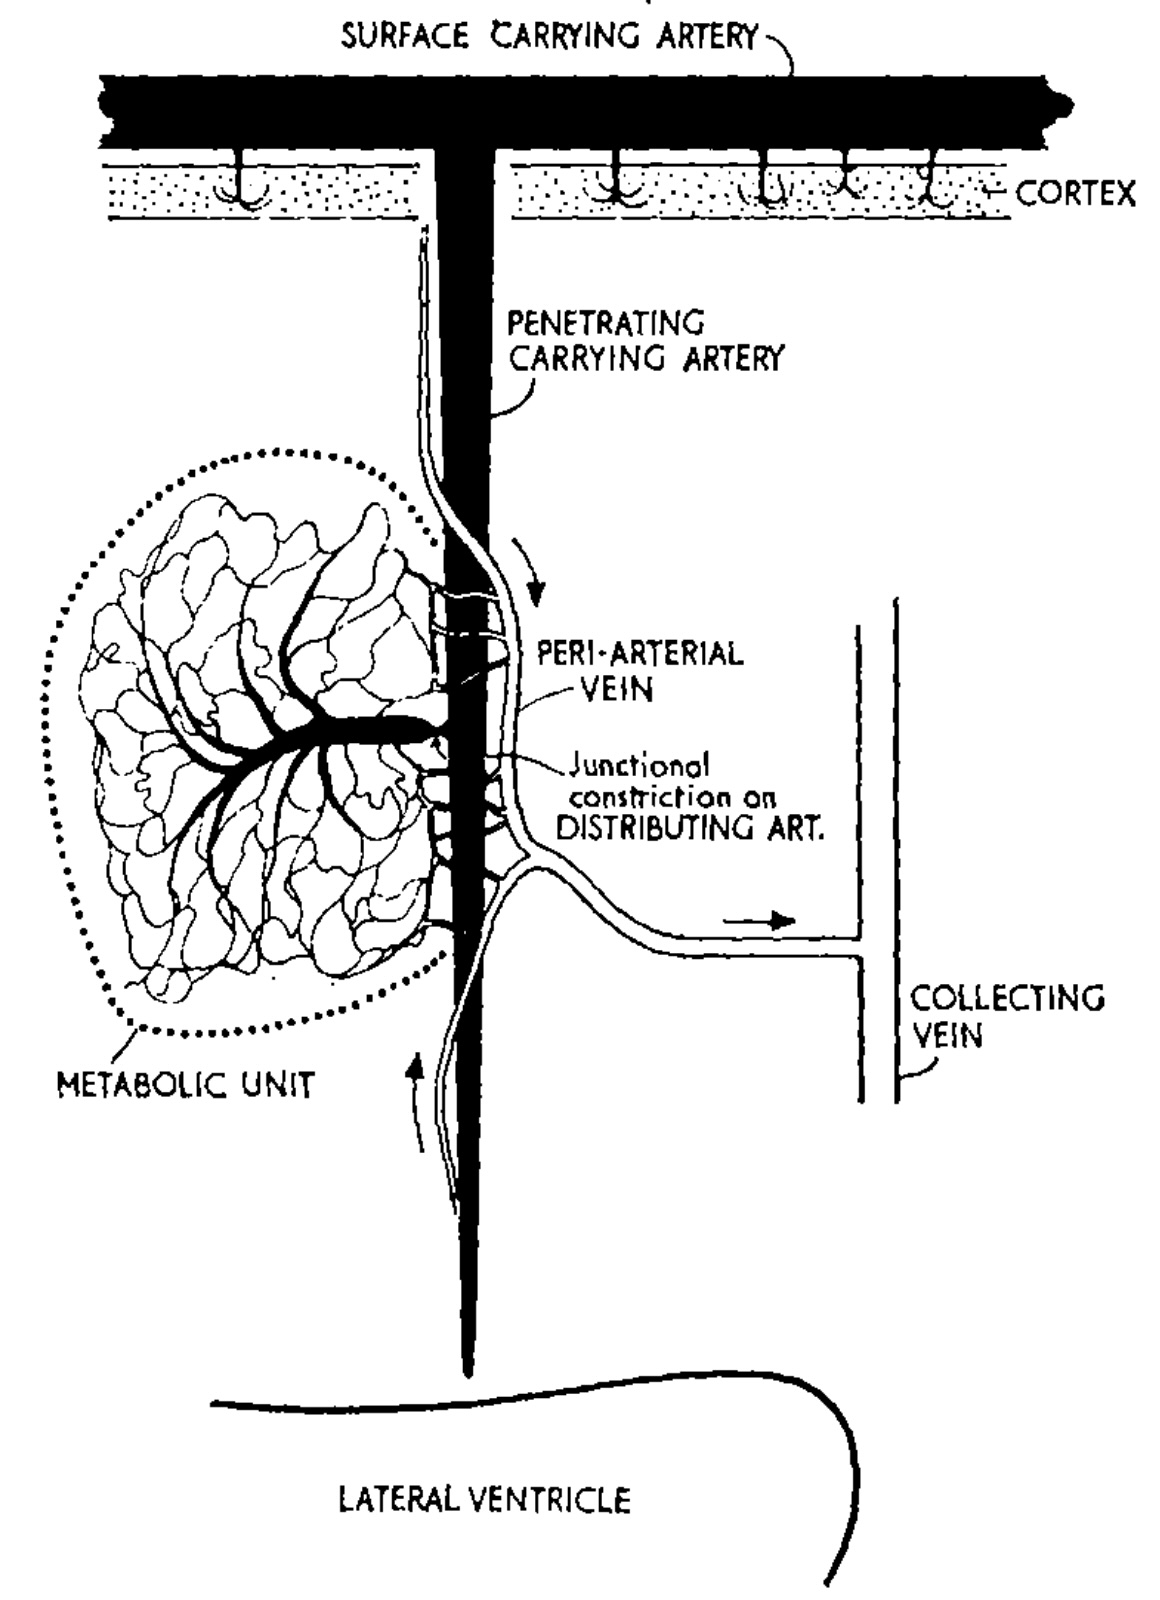
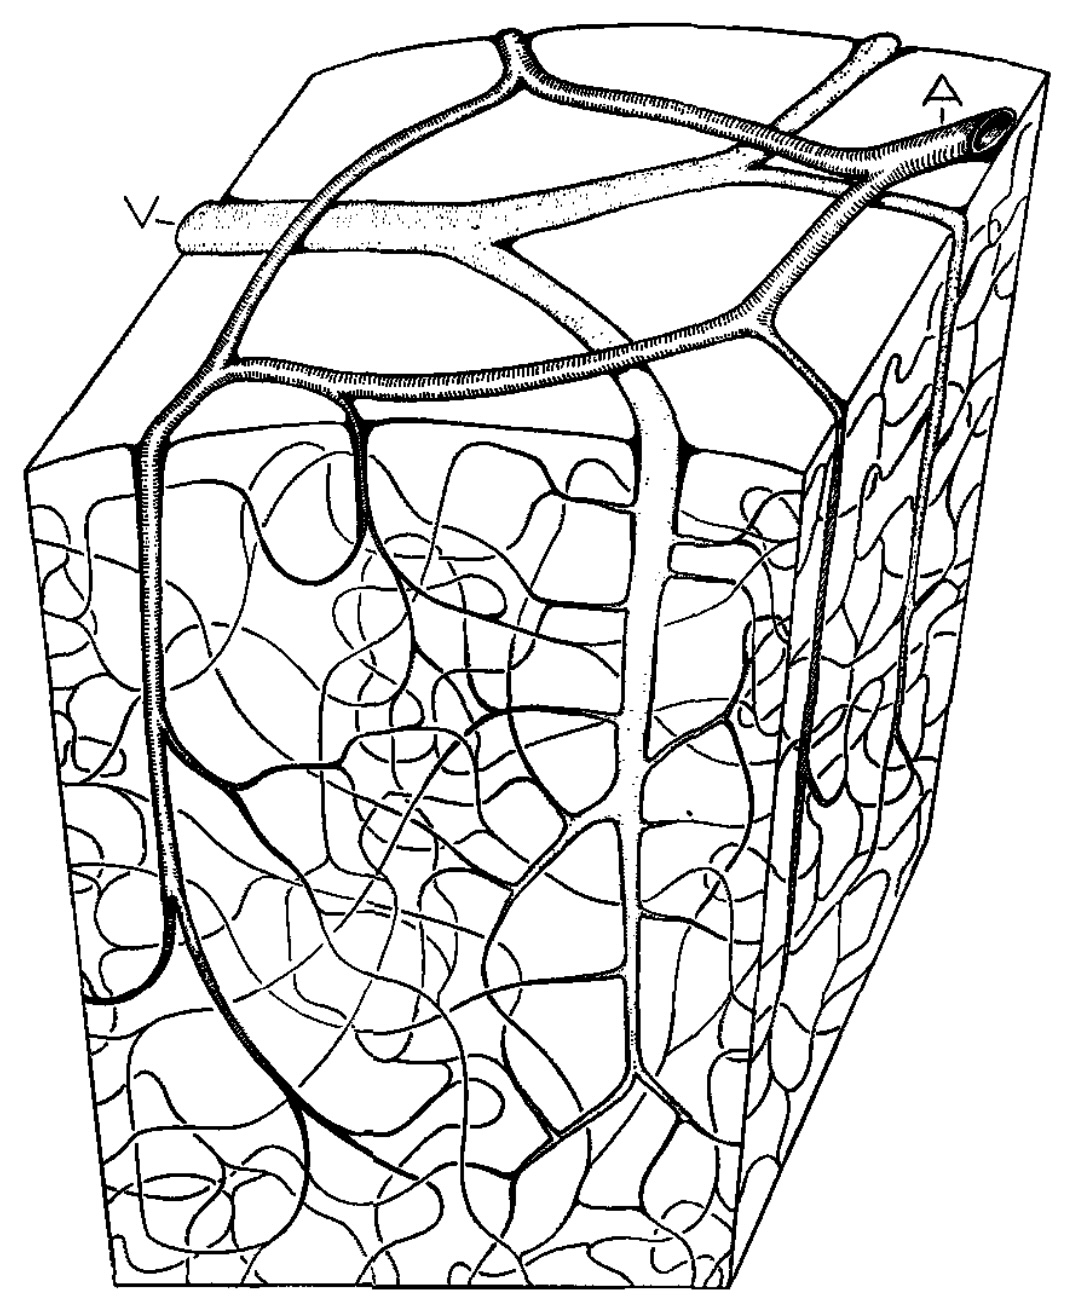
Rowbotham & Little 1965 // FIG 4 // Diagram of metabolic unit within the white matter.
doi.org/10.1002/bjs.1800520104
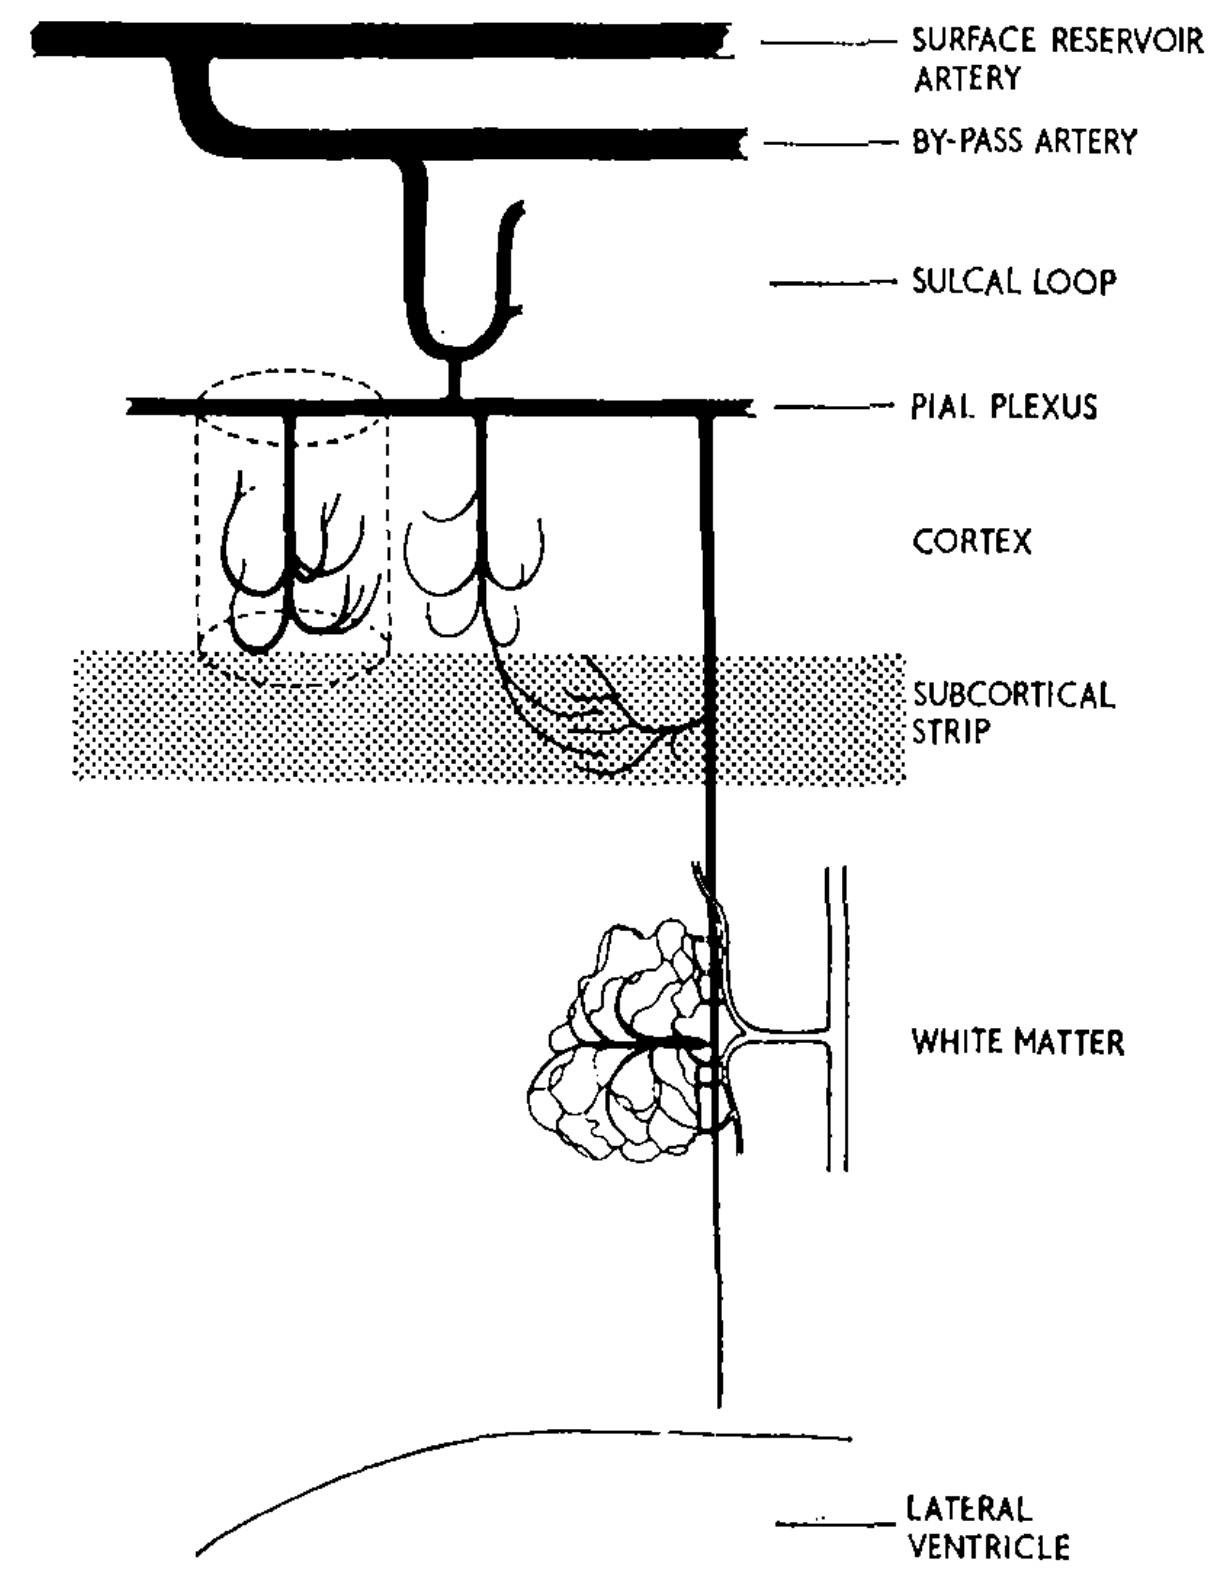
Rowbotham & Little 1965 // FIG 18 // A pictorial summary of the circulations of the cerebral hemispheres.
doi.org/10.1002/bjs.1800520104
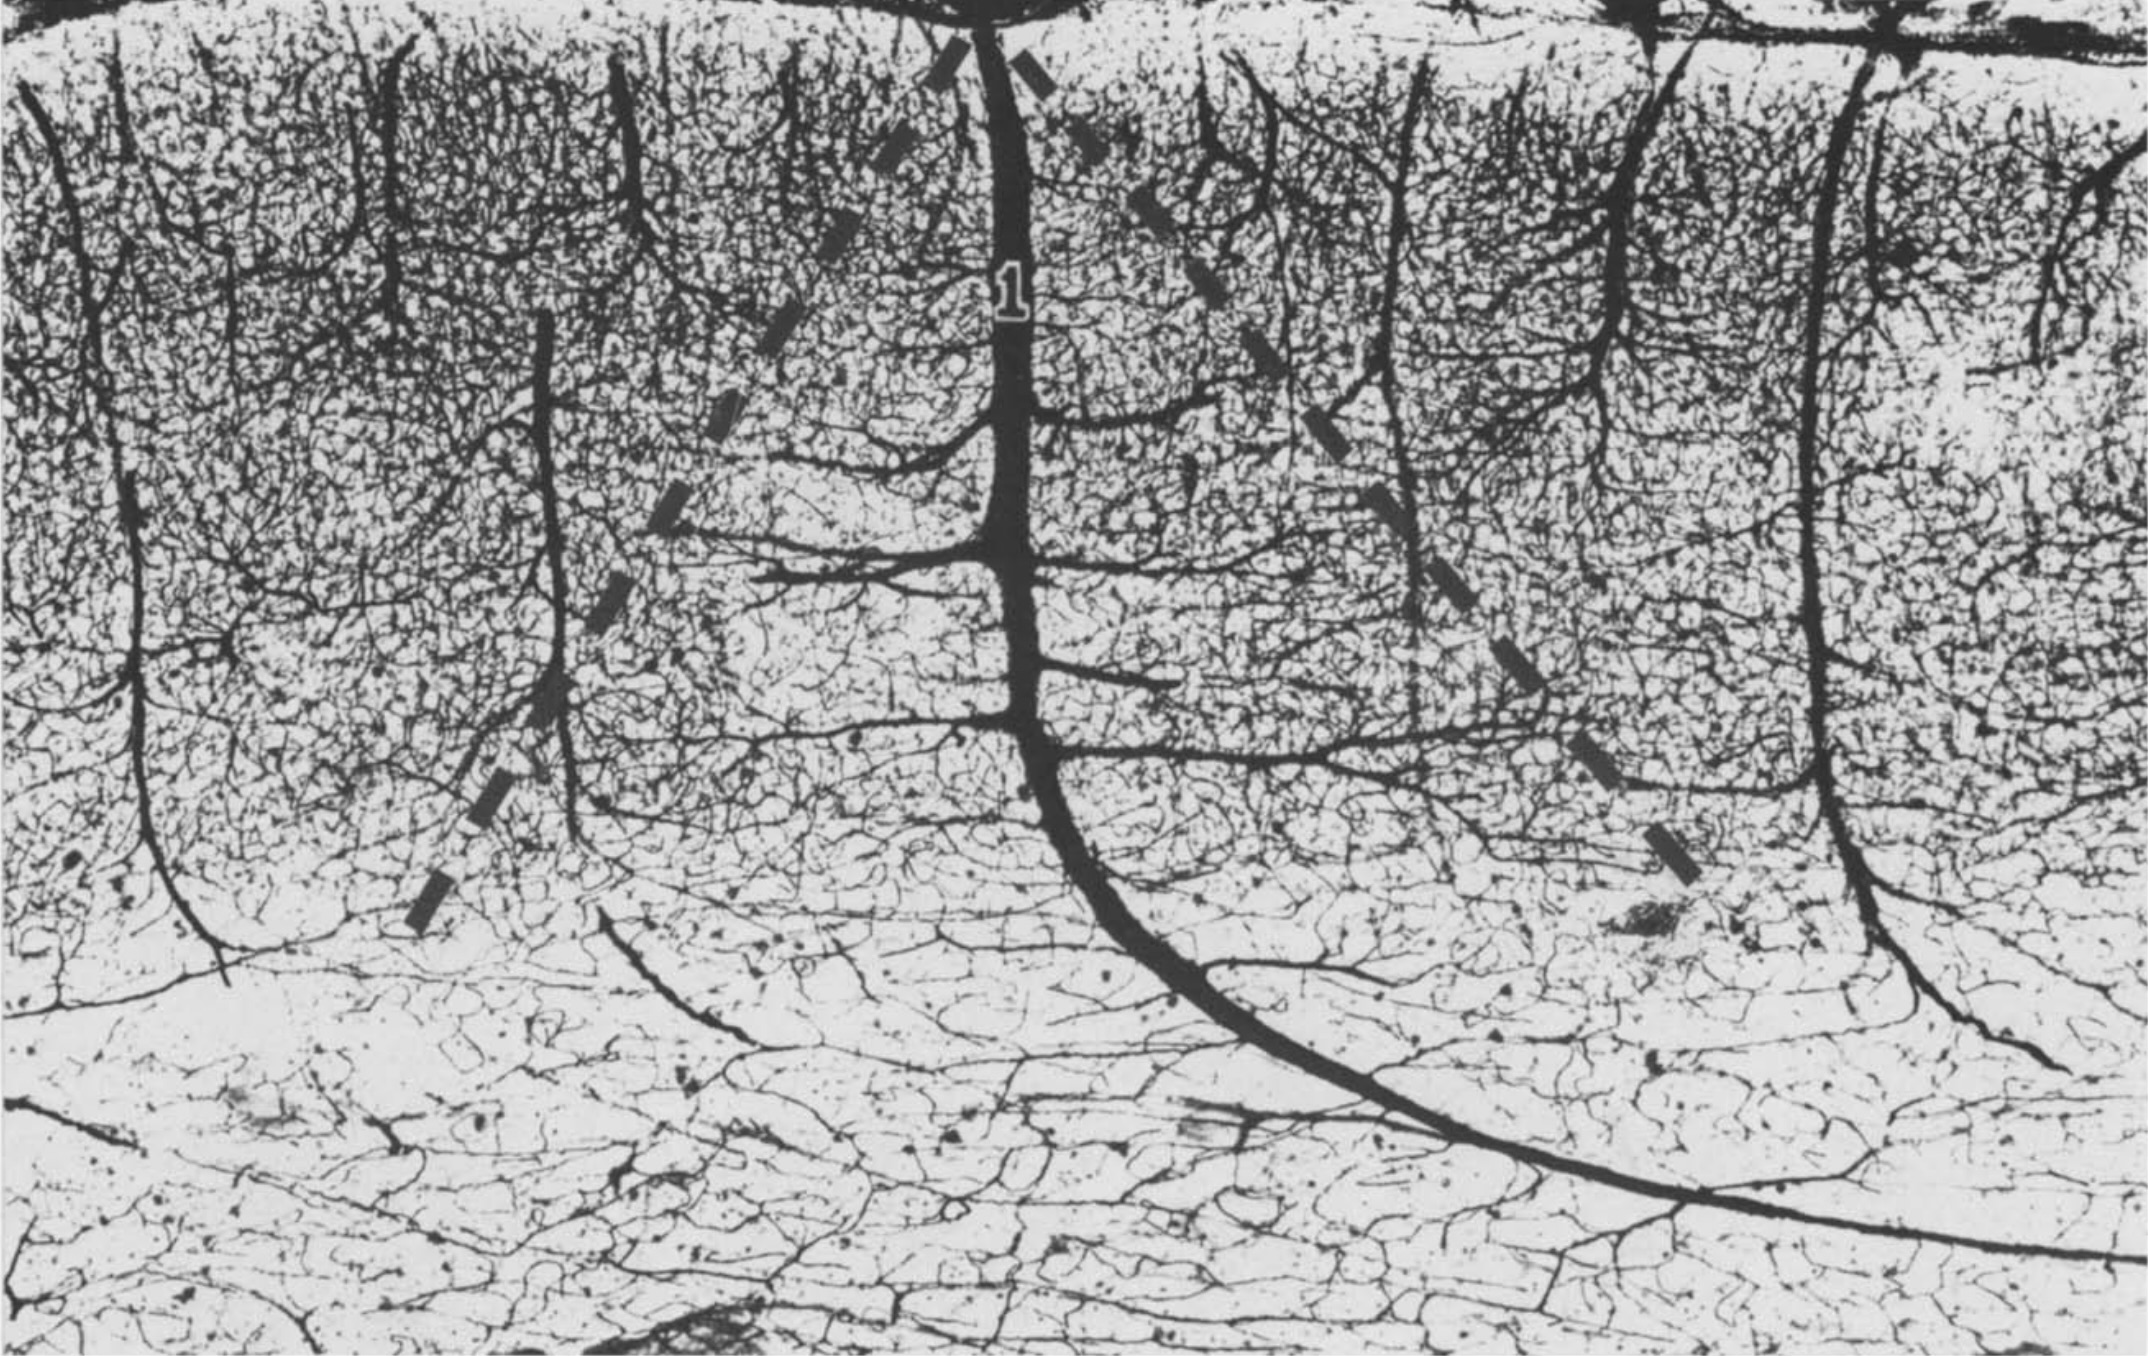
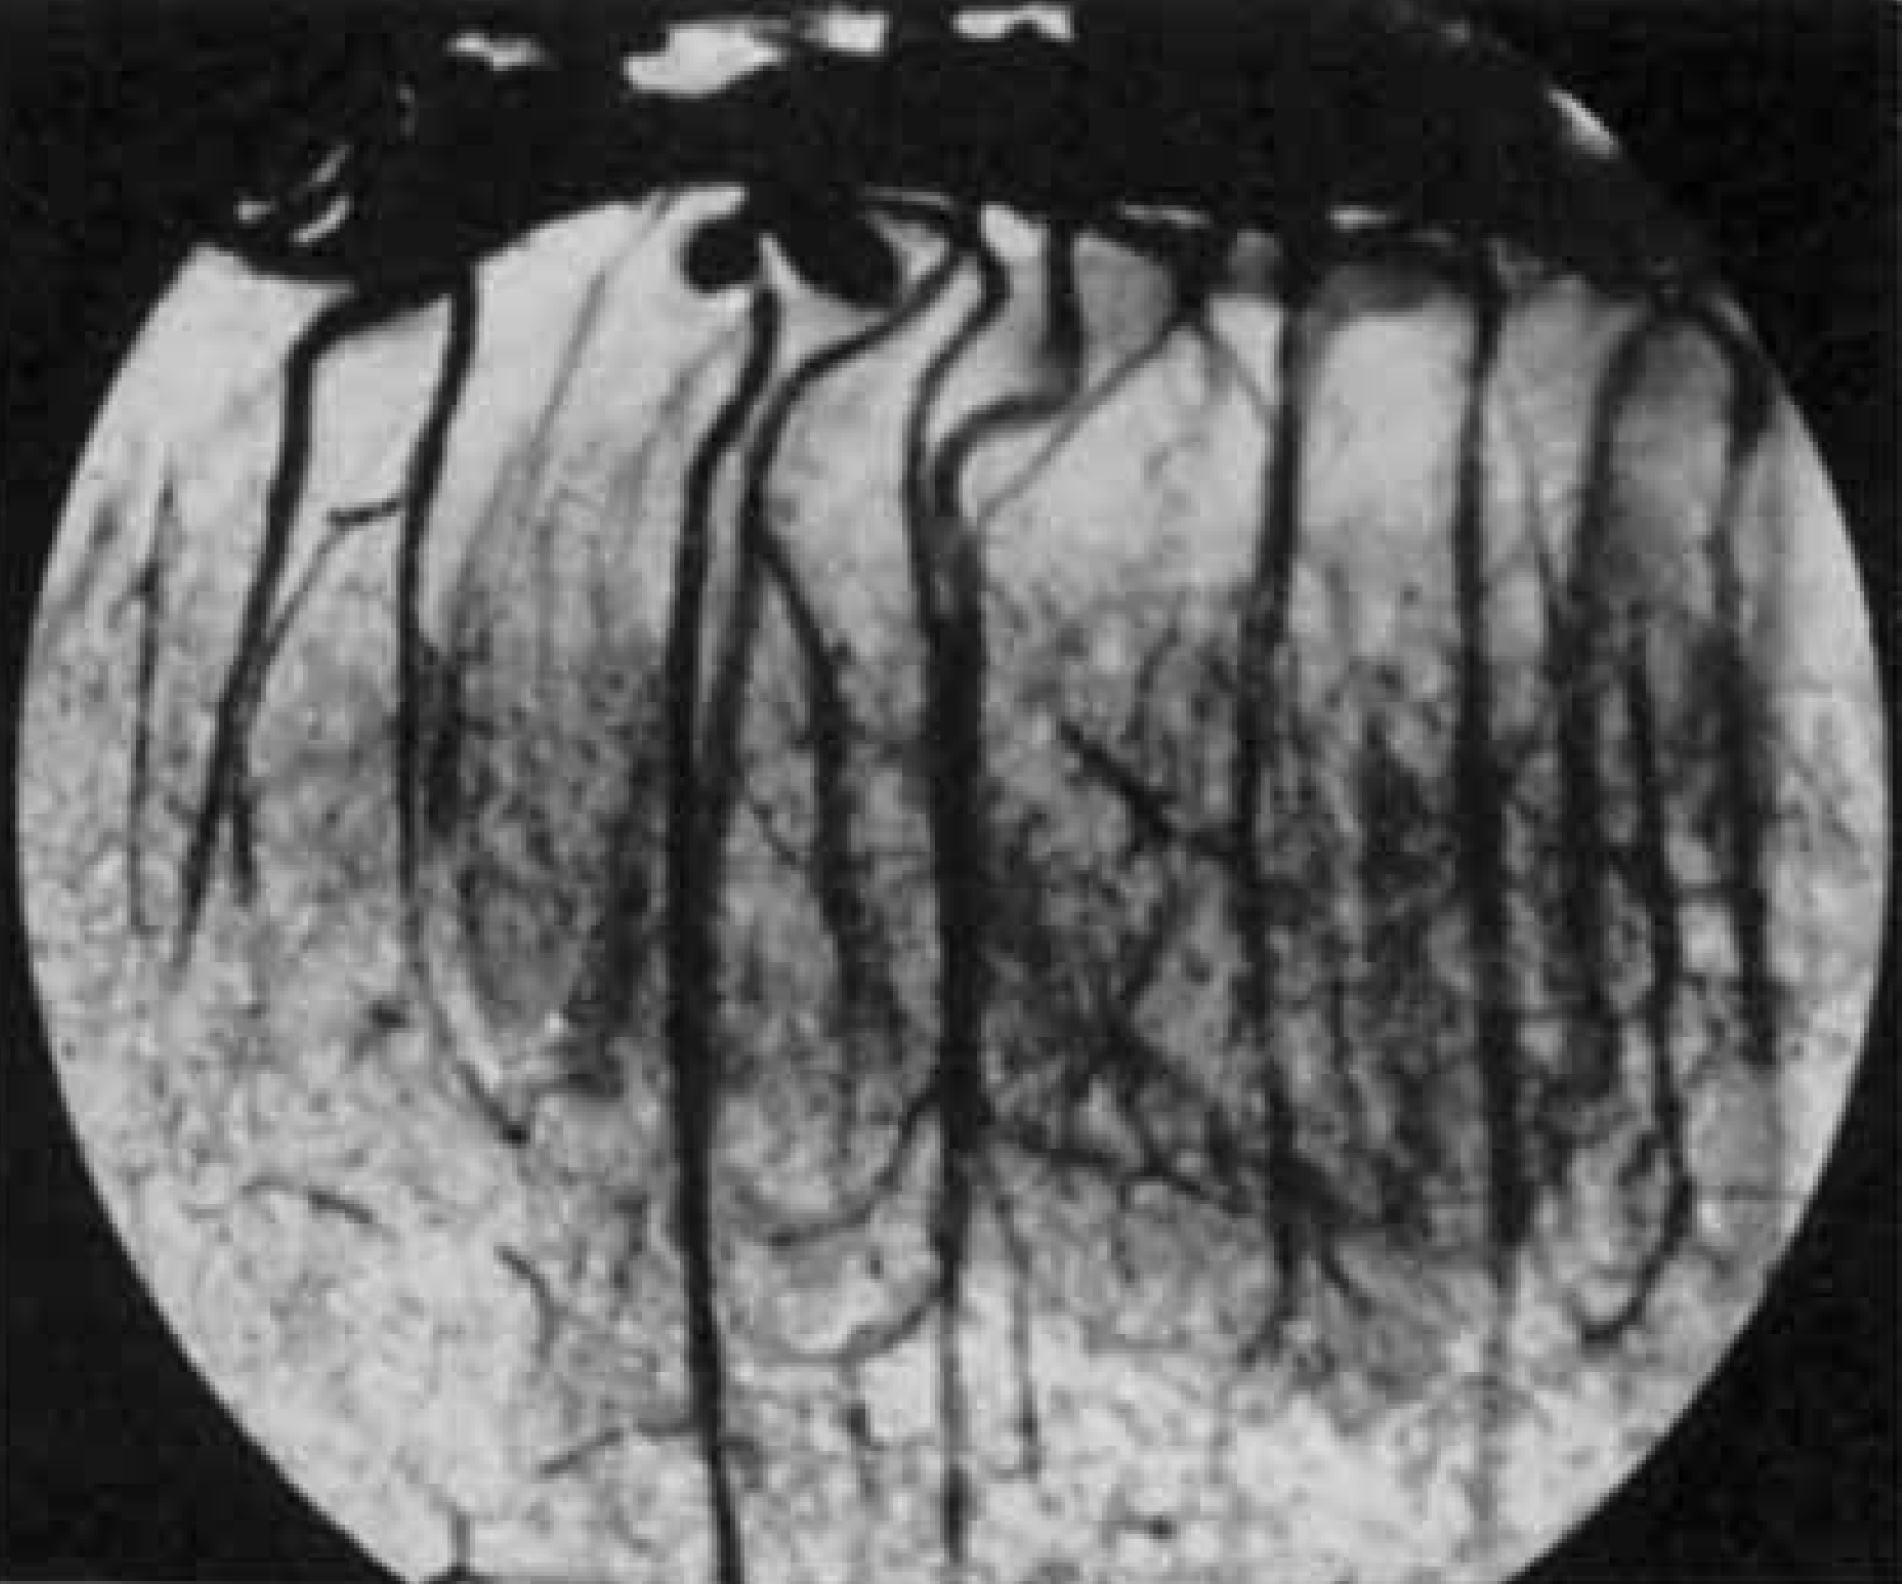
Rowbotham & Little 1963 // FIG 758 // The palisading effect of the intracortical meso-vessels. Also note the greater density of the deeper part of the capillary bed.
doi.org/10.1002/bjs.18005022504
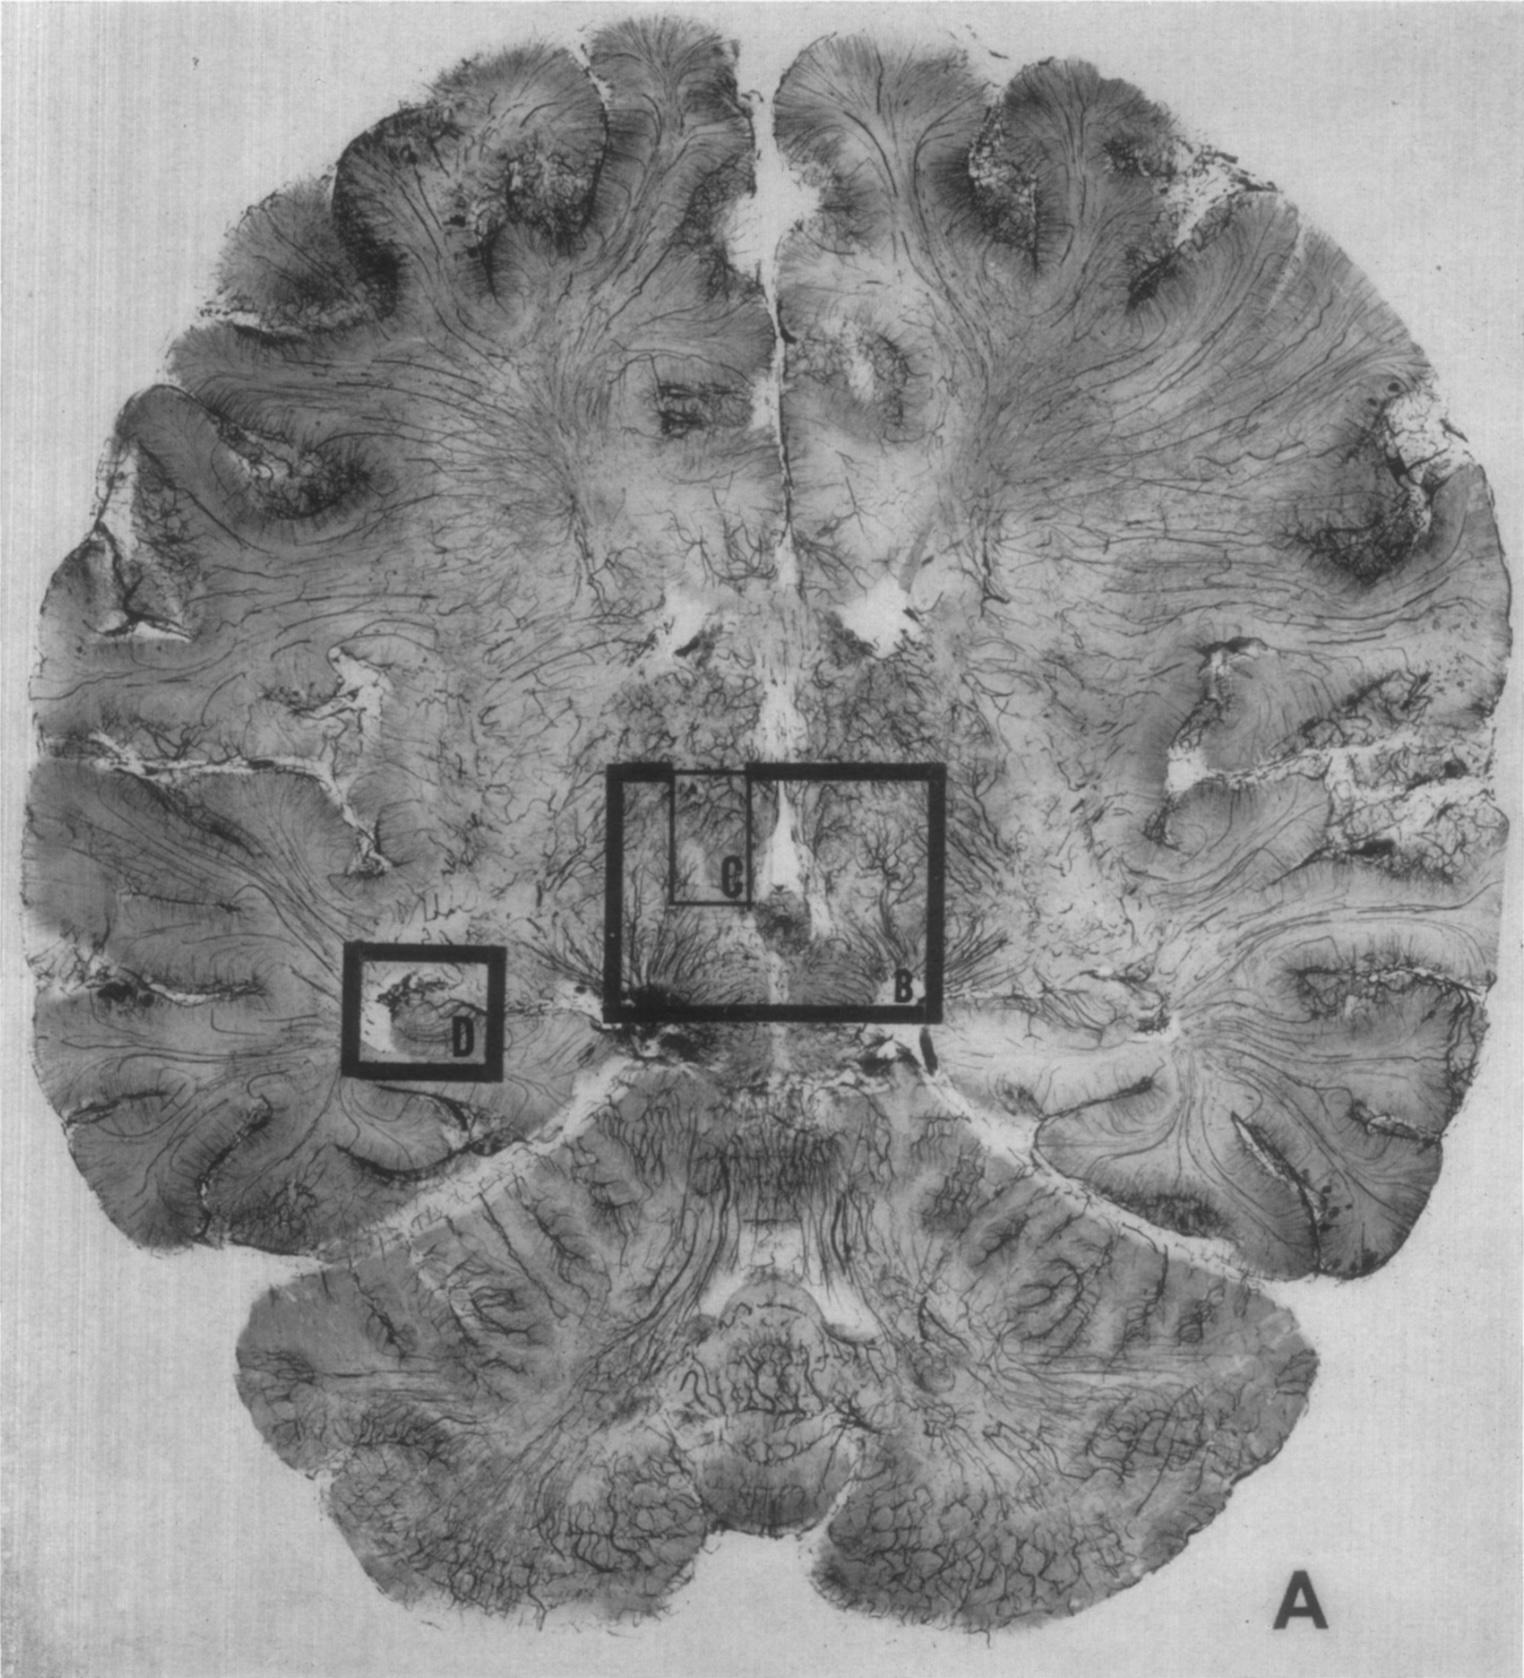
Hale & Reed 1963 // FIG 3 // Meso-vessels of the human brain. Positive print of a contact x-ray film. 4 mm thick paracoronal section.
doi.org/10.1016/0002-8703(63)90039-5
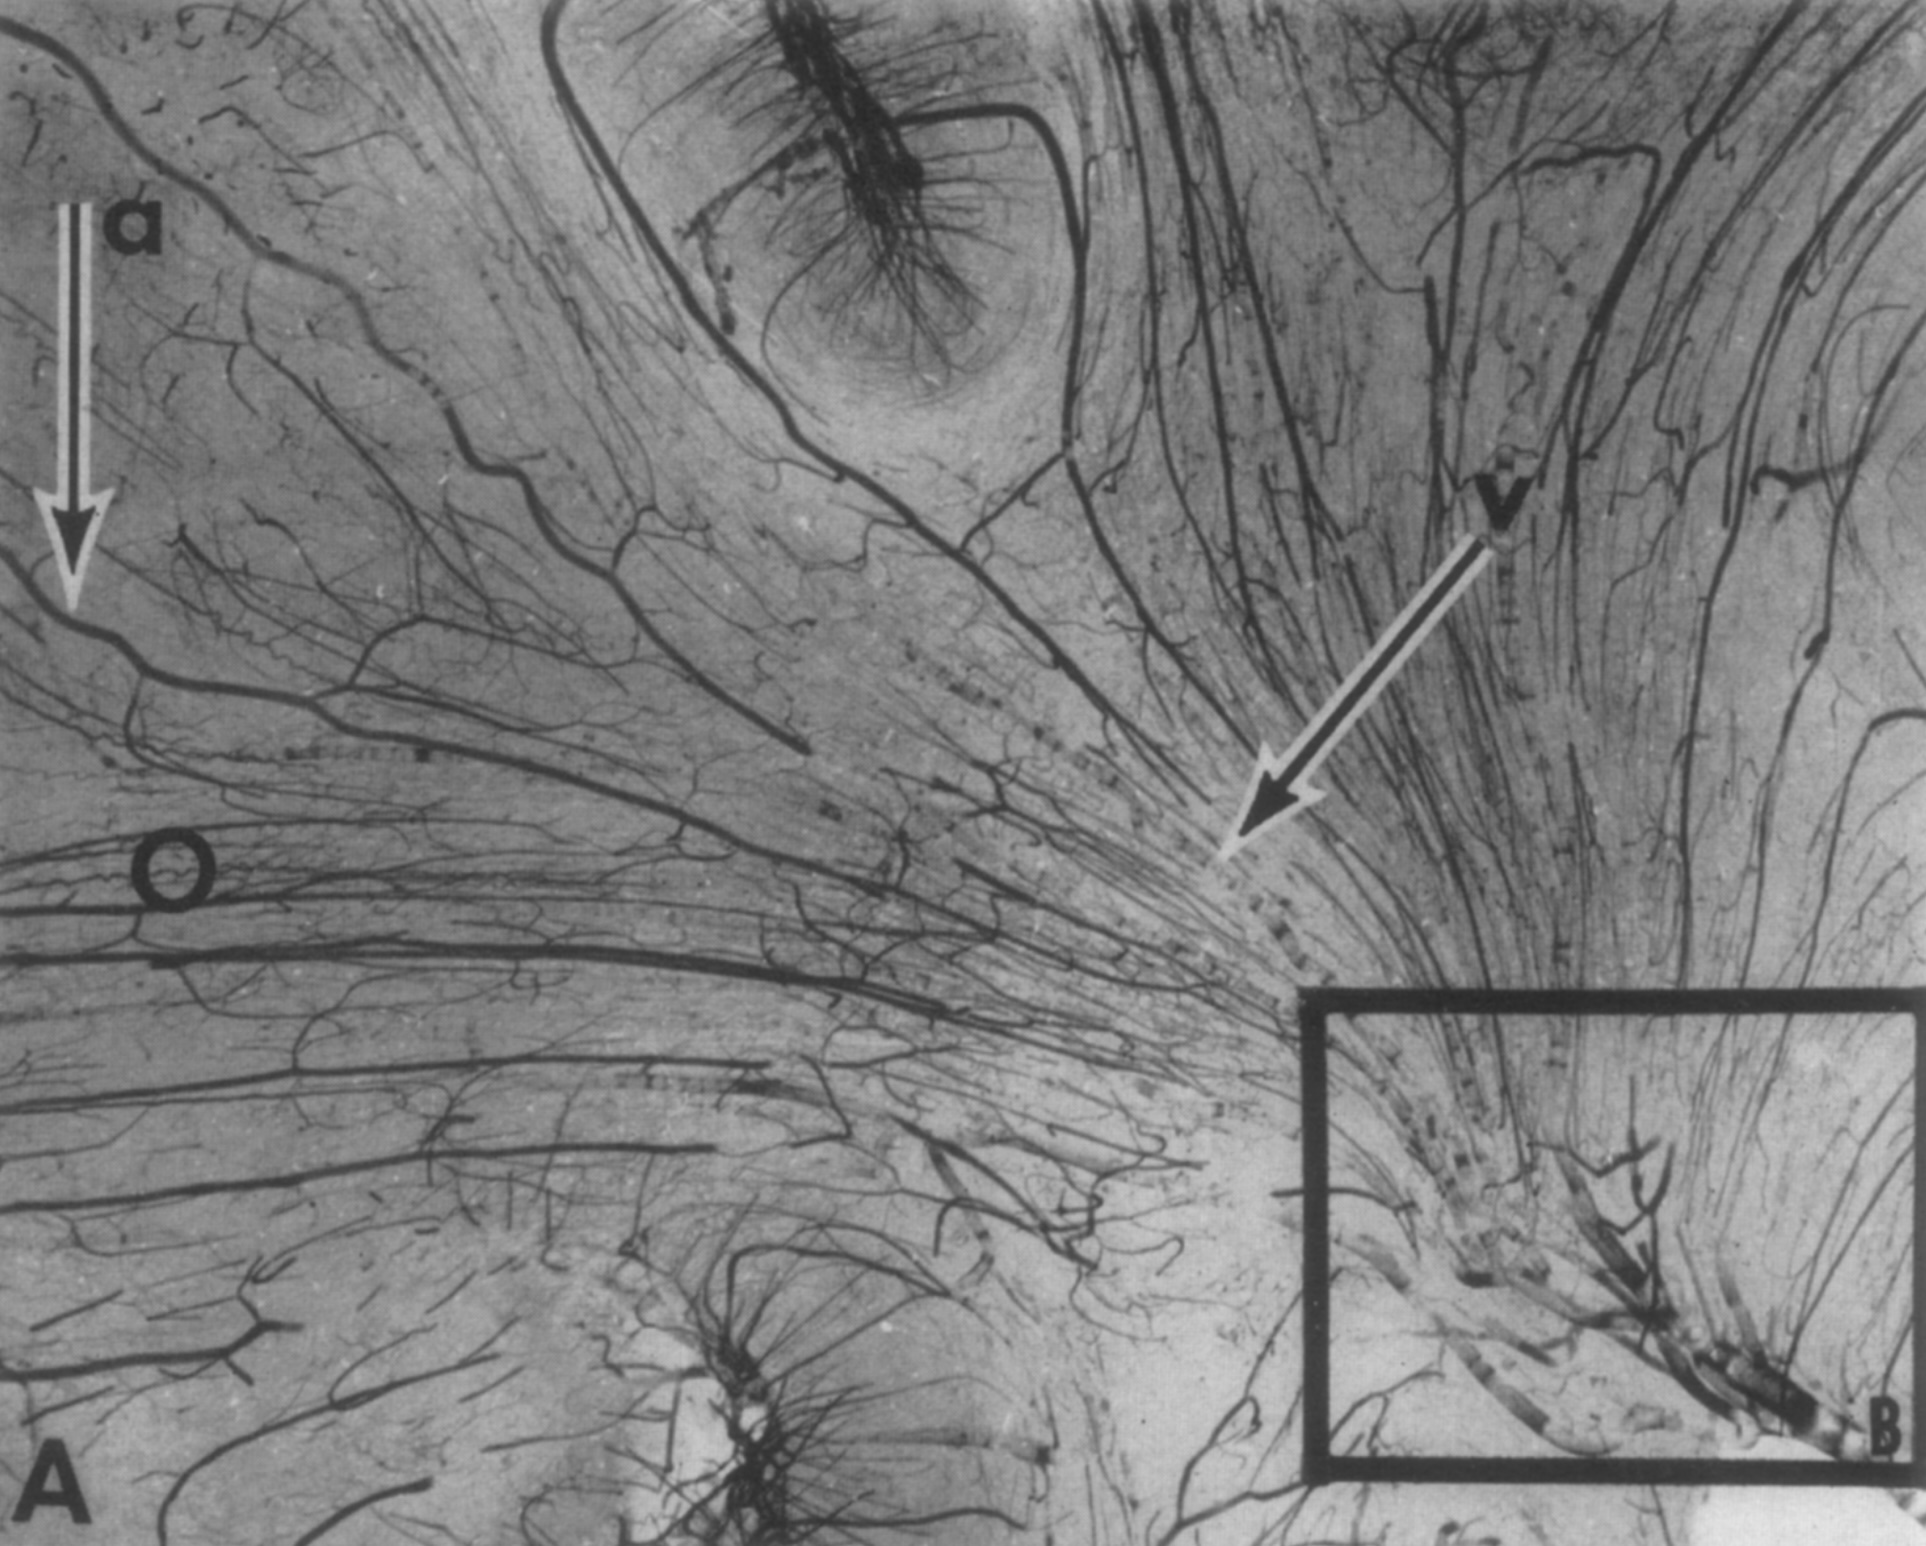
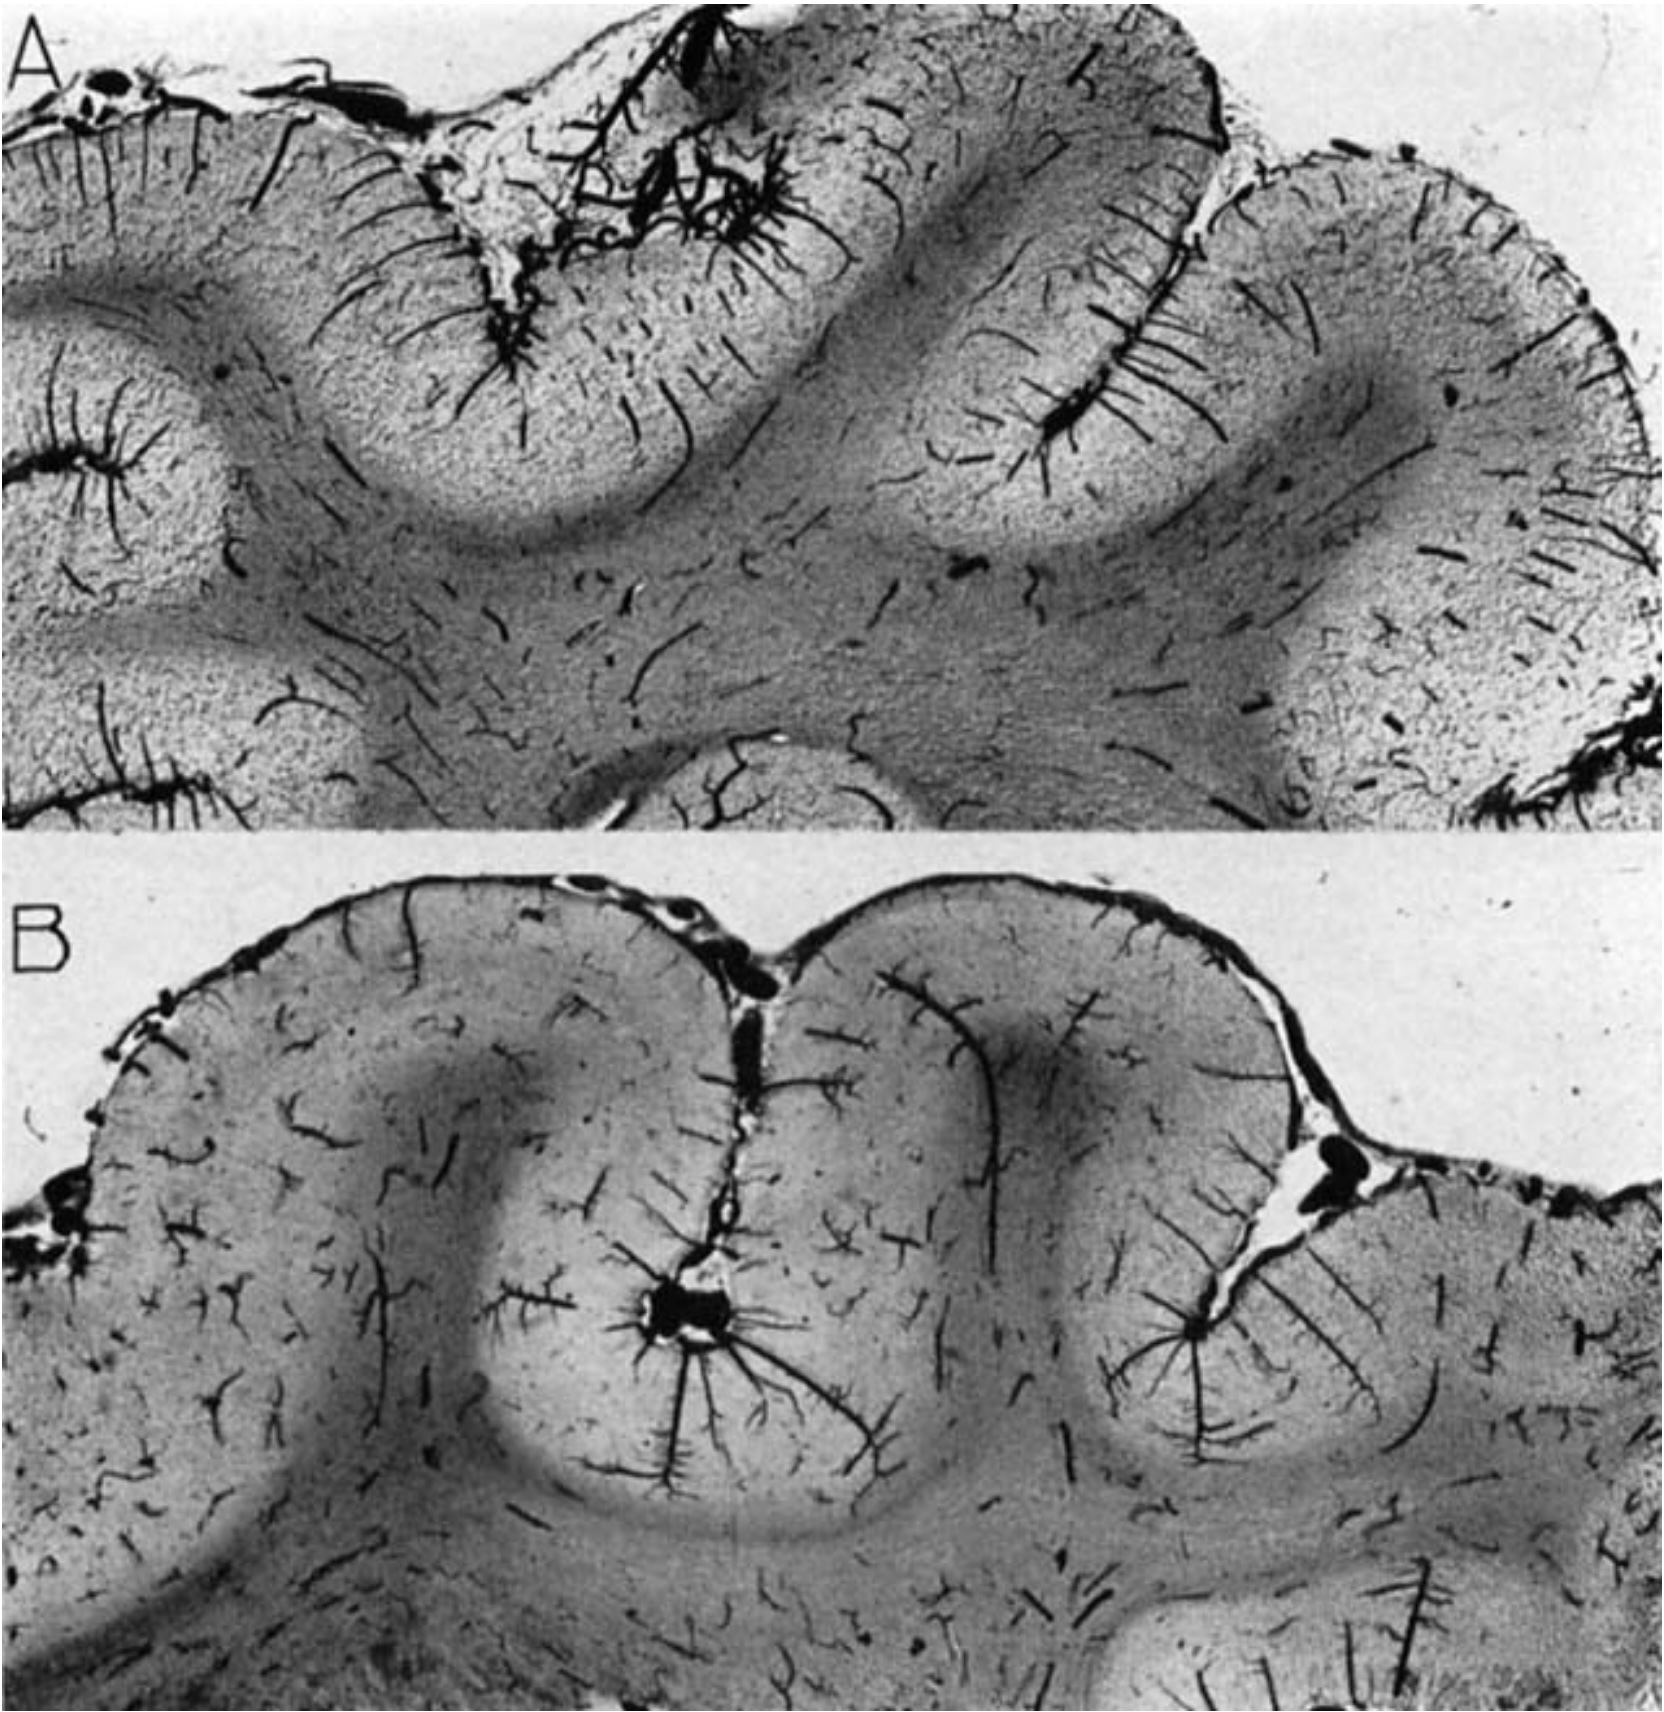
Hale & Reed 1963 // FIG 10 // Meso-arteries and veins of the human brain. At the left, a sulcus shows intracortical meso-arteries passing through it supplying the cortex and sending branches into the underlying white matter. On the right a cortical artery (A) sends right-angled branches into the subcortical fiber tracts.
doi.org/10.1016/0002-8703(63)90039-5
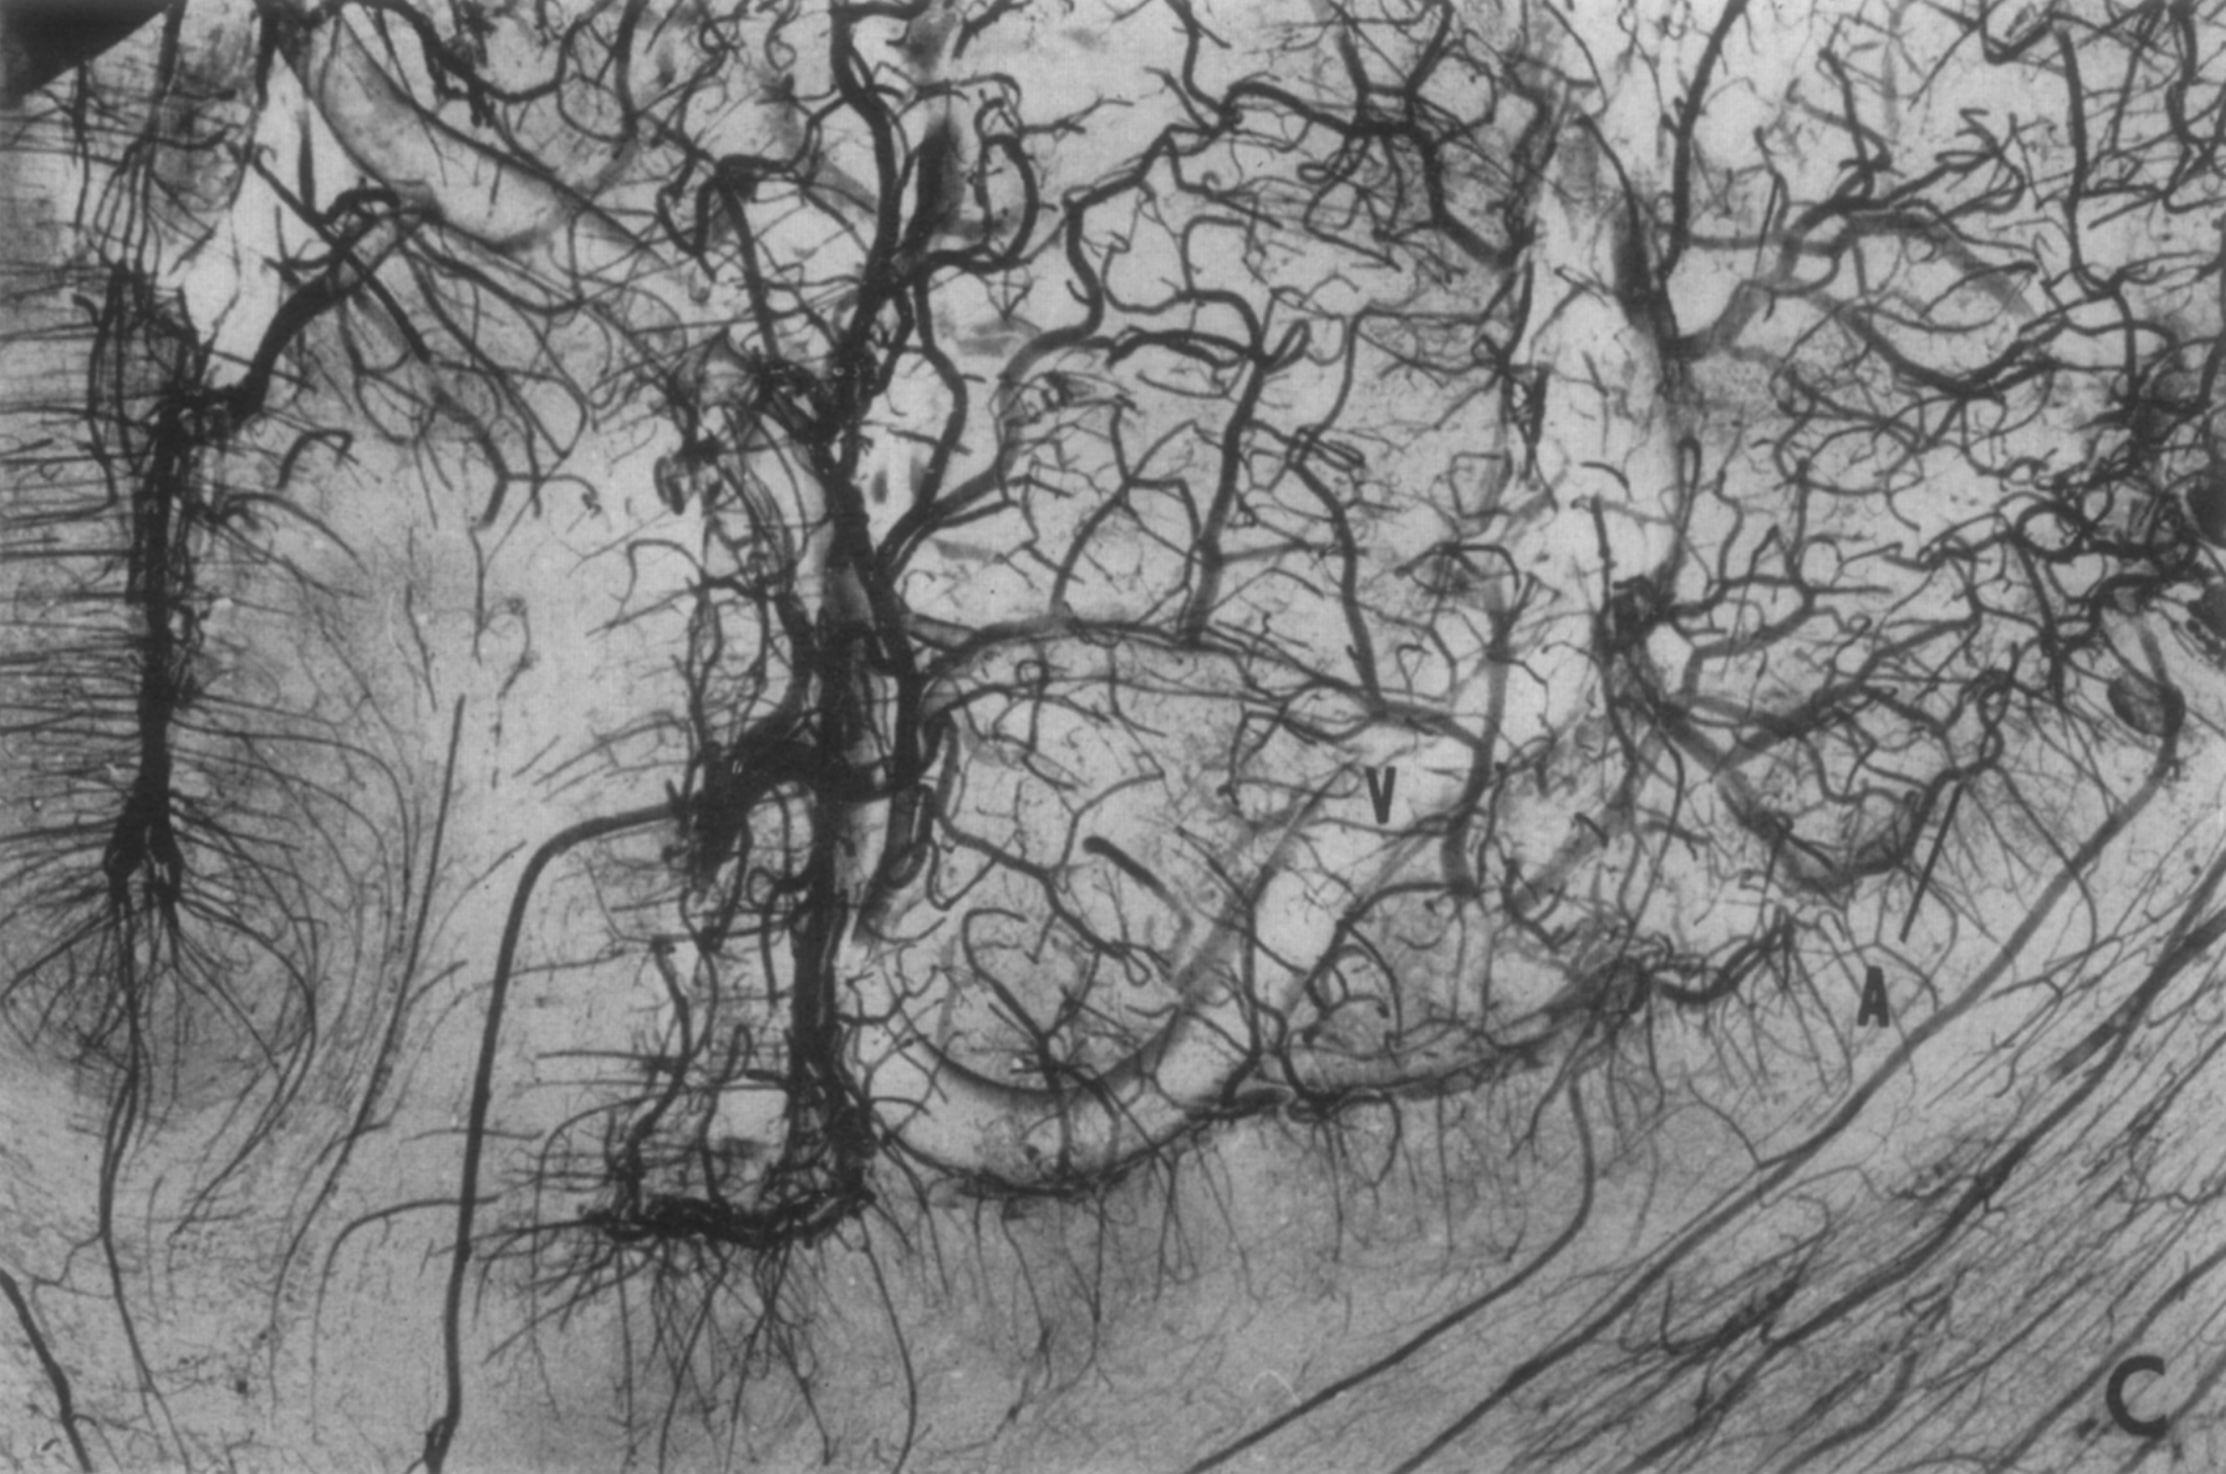
Hale & Reed 1963 // FIG 11 // White matter meso-arteries and veins of the human brain. Cortical arteries (a) and veins (v) converge upon the lateral angle of the lateral ventricle.
doi.org/10.1016/0002-8703(63)90039-5
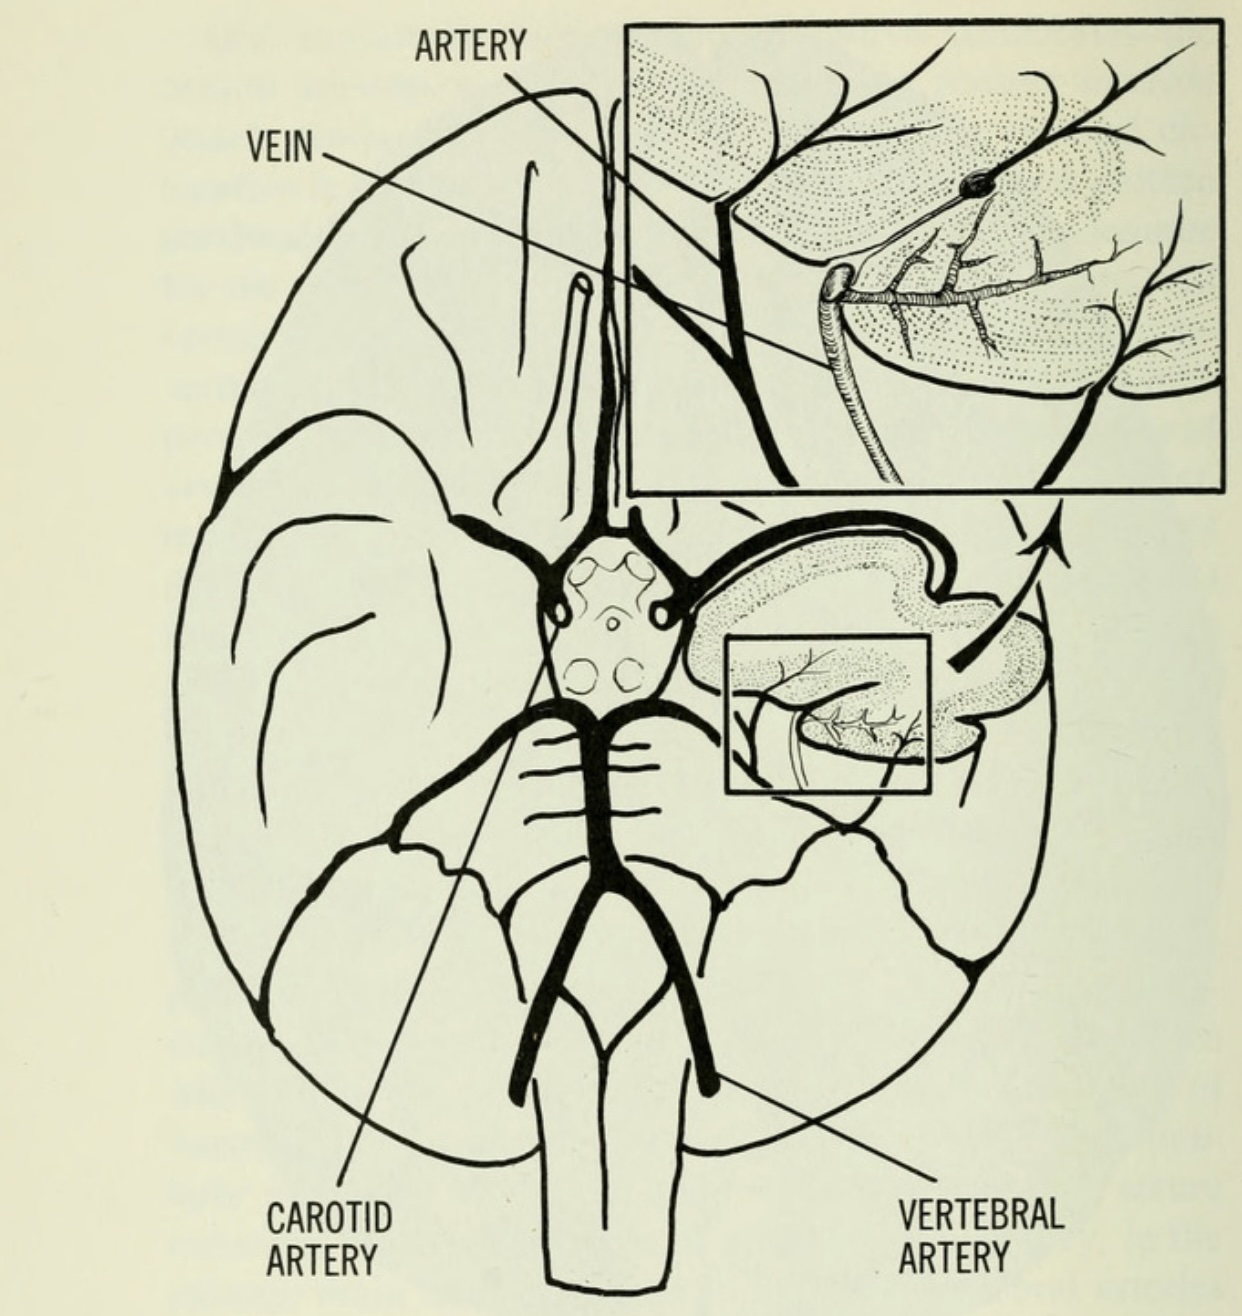
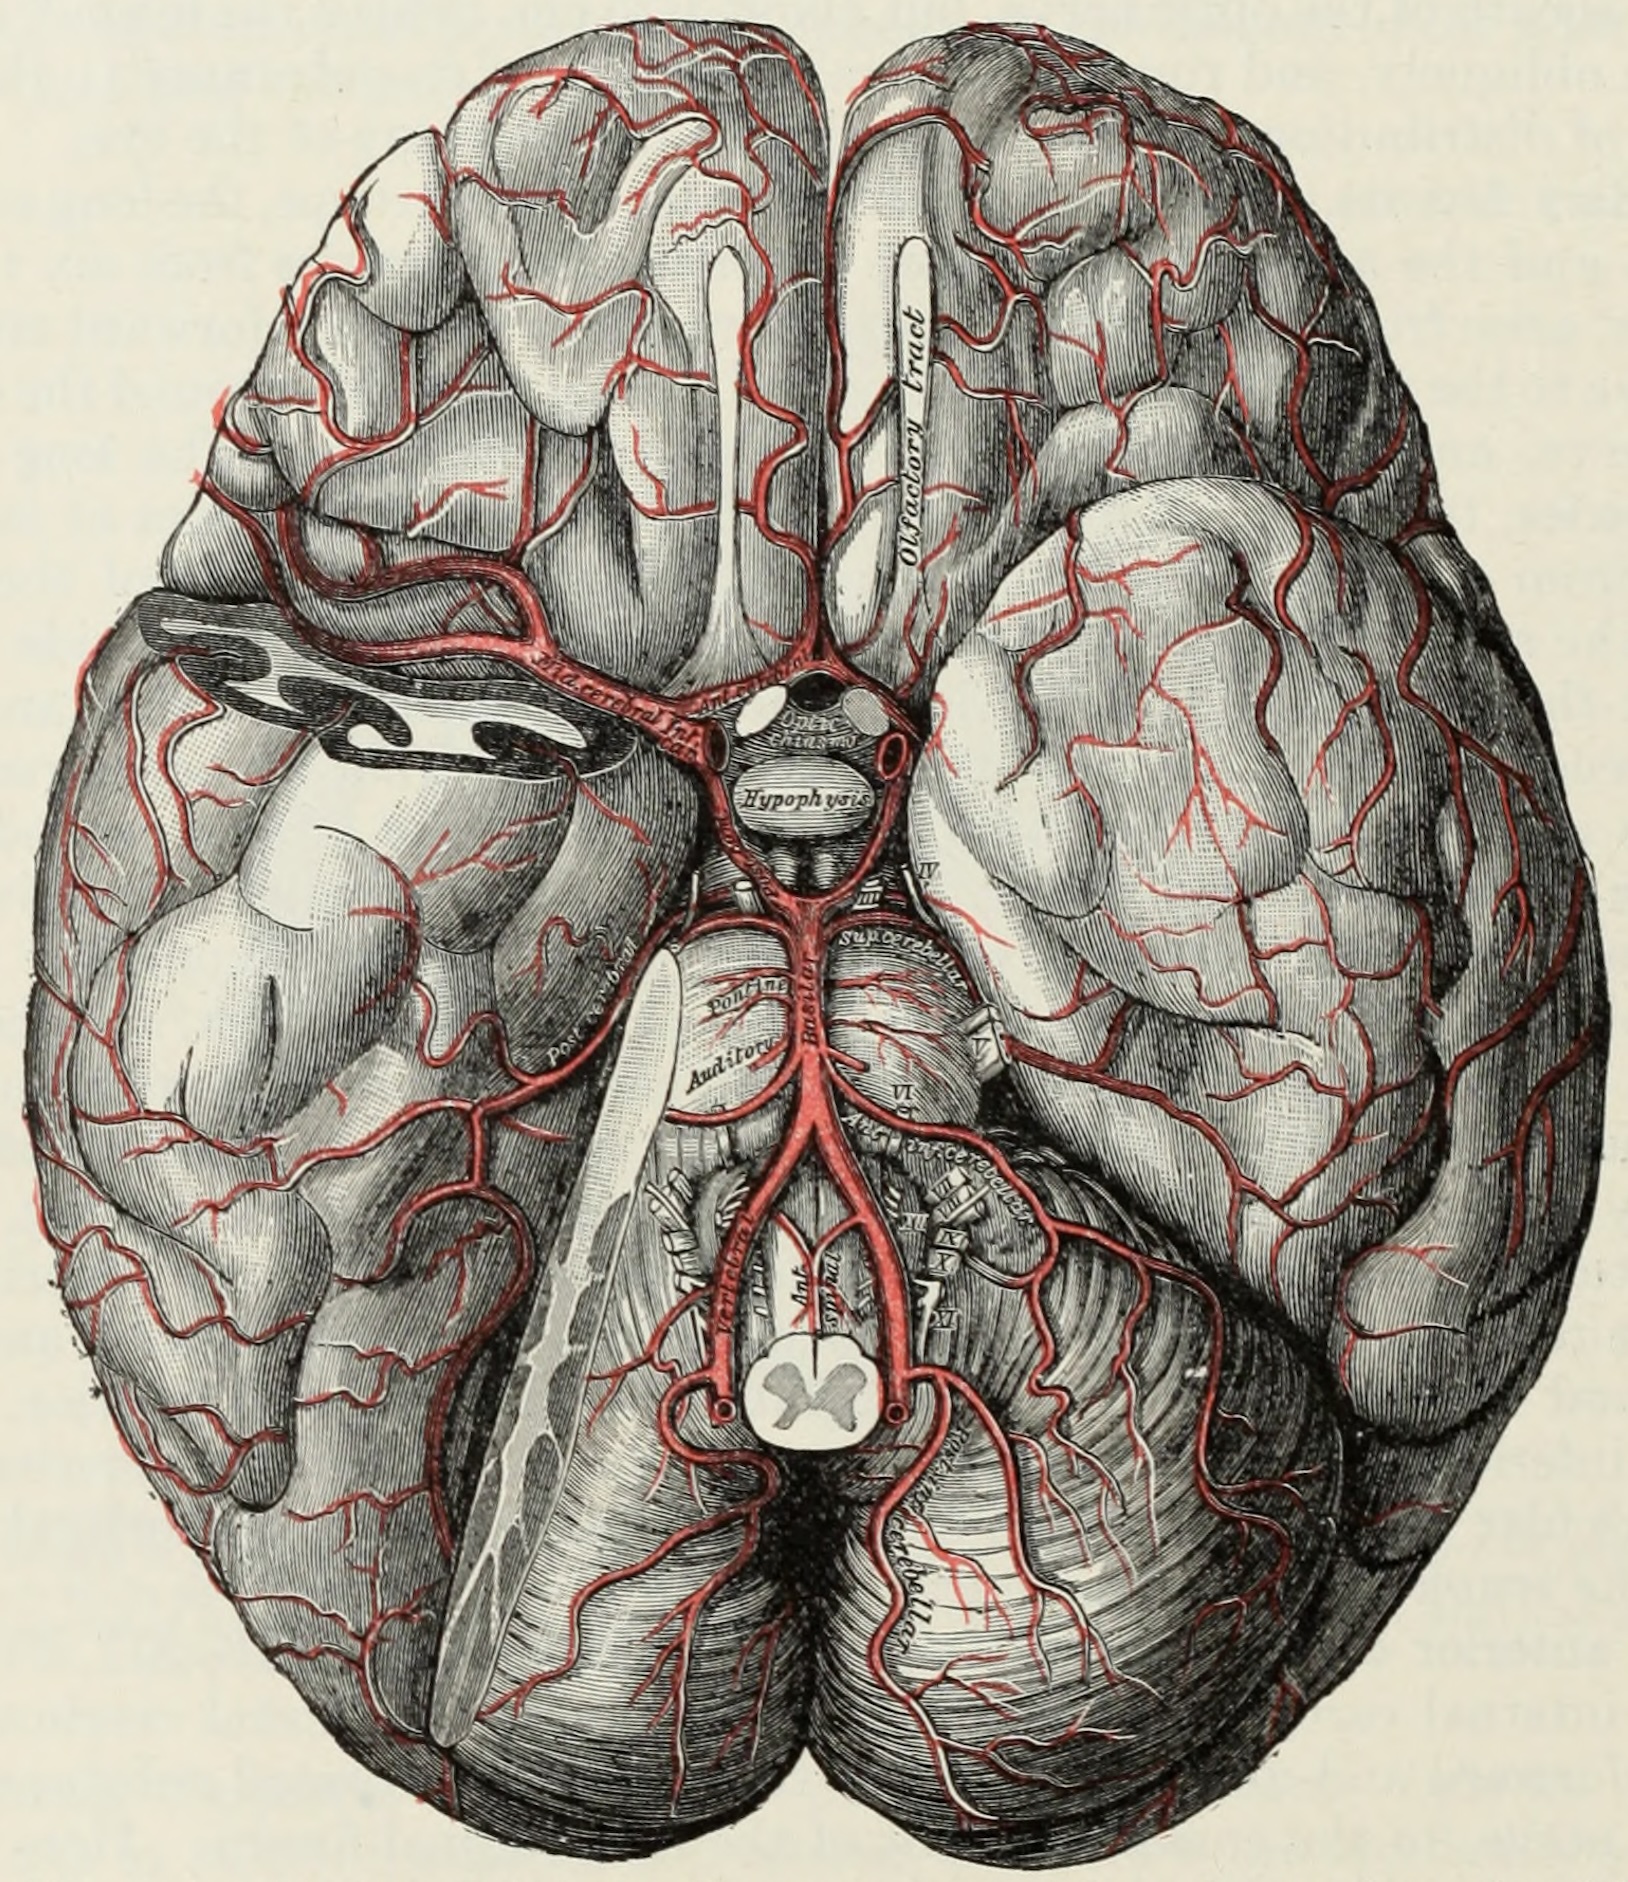
Scharrer, 1960 // Rhesus monkey brain ventral view. The surface vessels are injected with colored gelatine.
Scharrer, 1960 // Rhesus monkey brain ventral view. The anterior pole of the left temporal lobe has been cut off in order to show how blood vessels enter the brain substance.
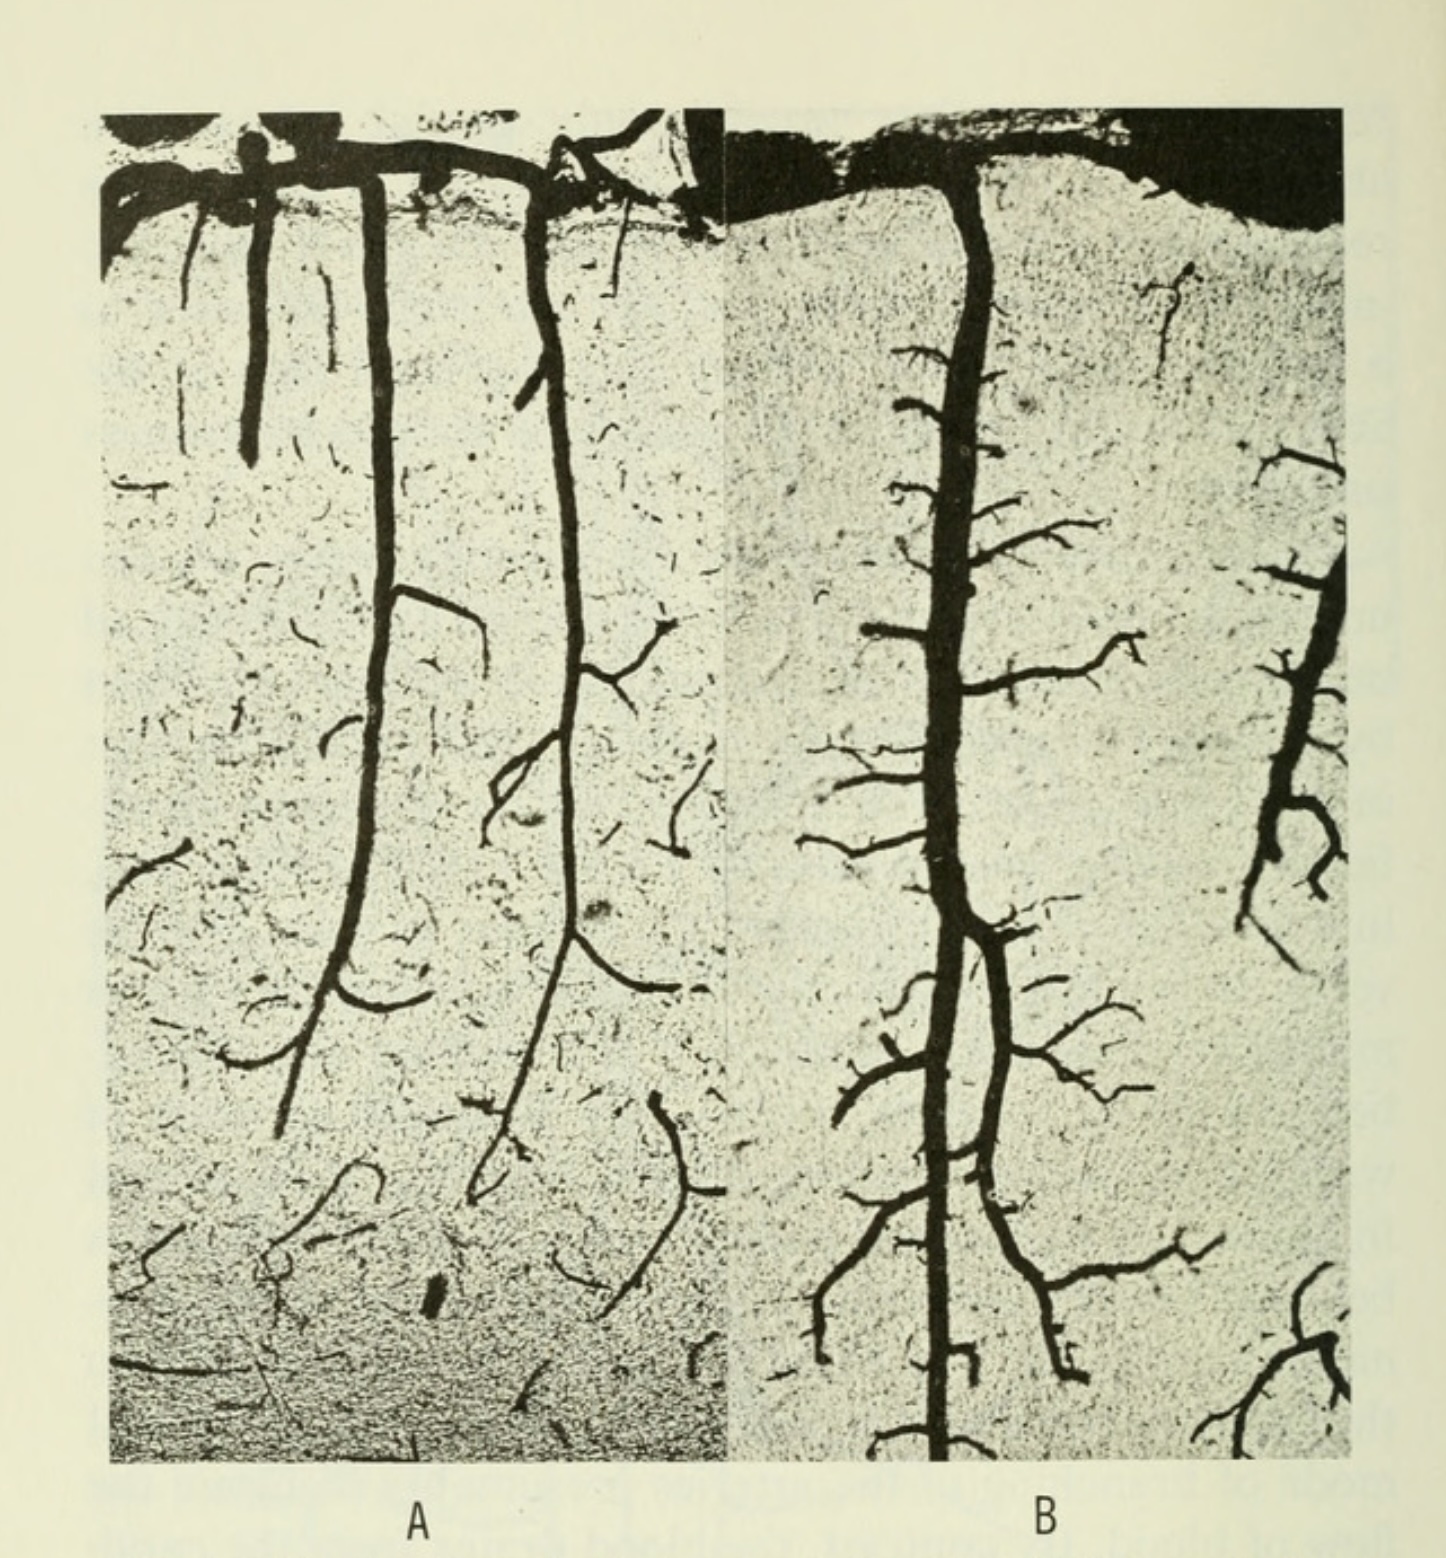
Scharrer, 1960 // Cat brain intracortical arteries (A) and veins (B). Note the difference in the ramification of the two kinds of blood vessels.
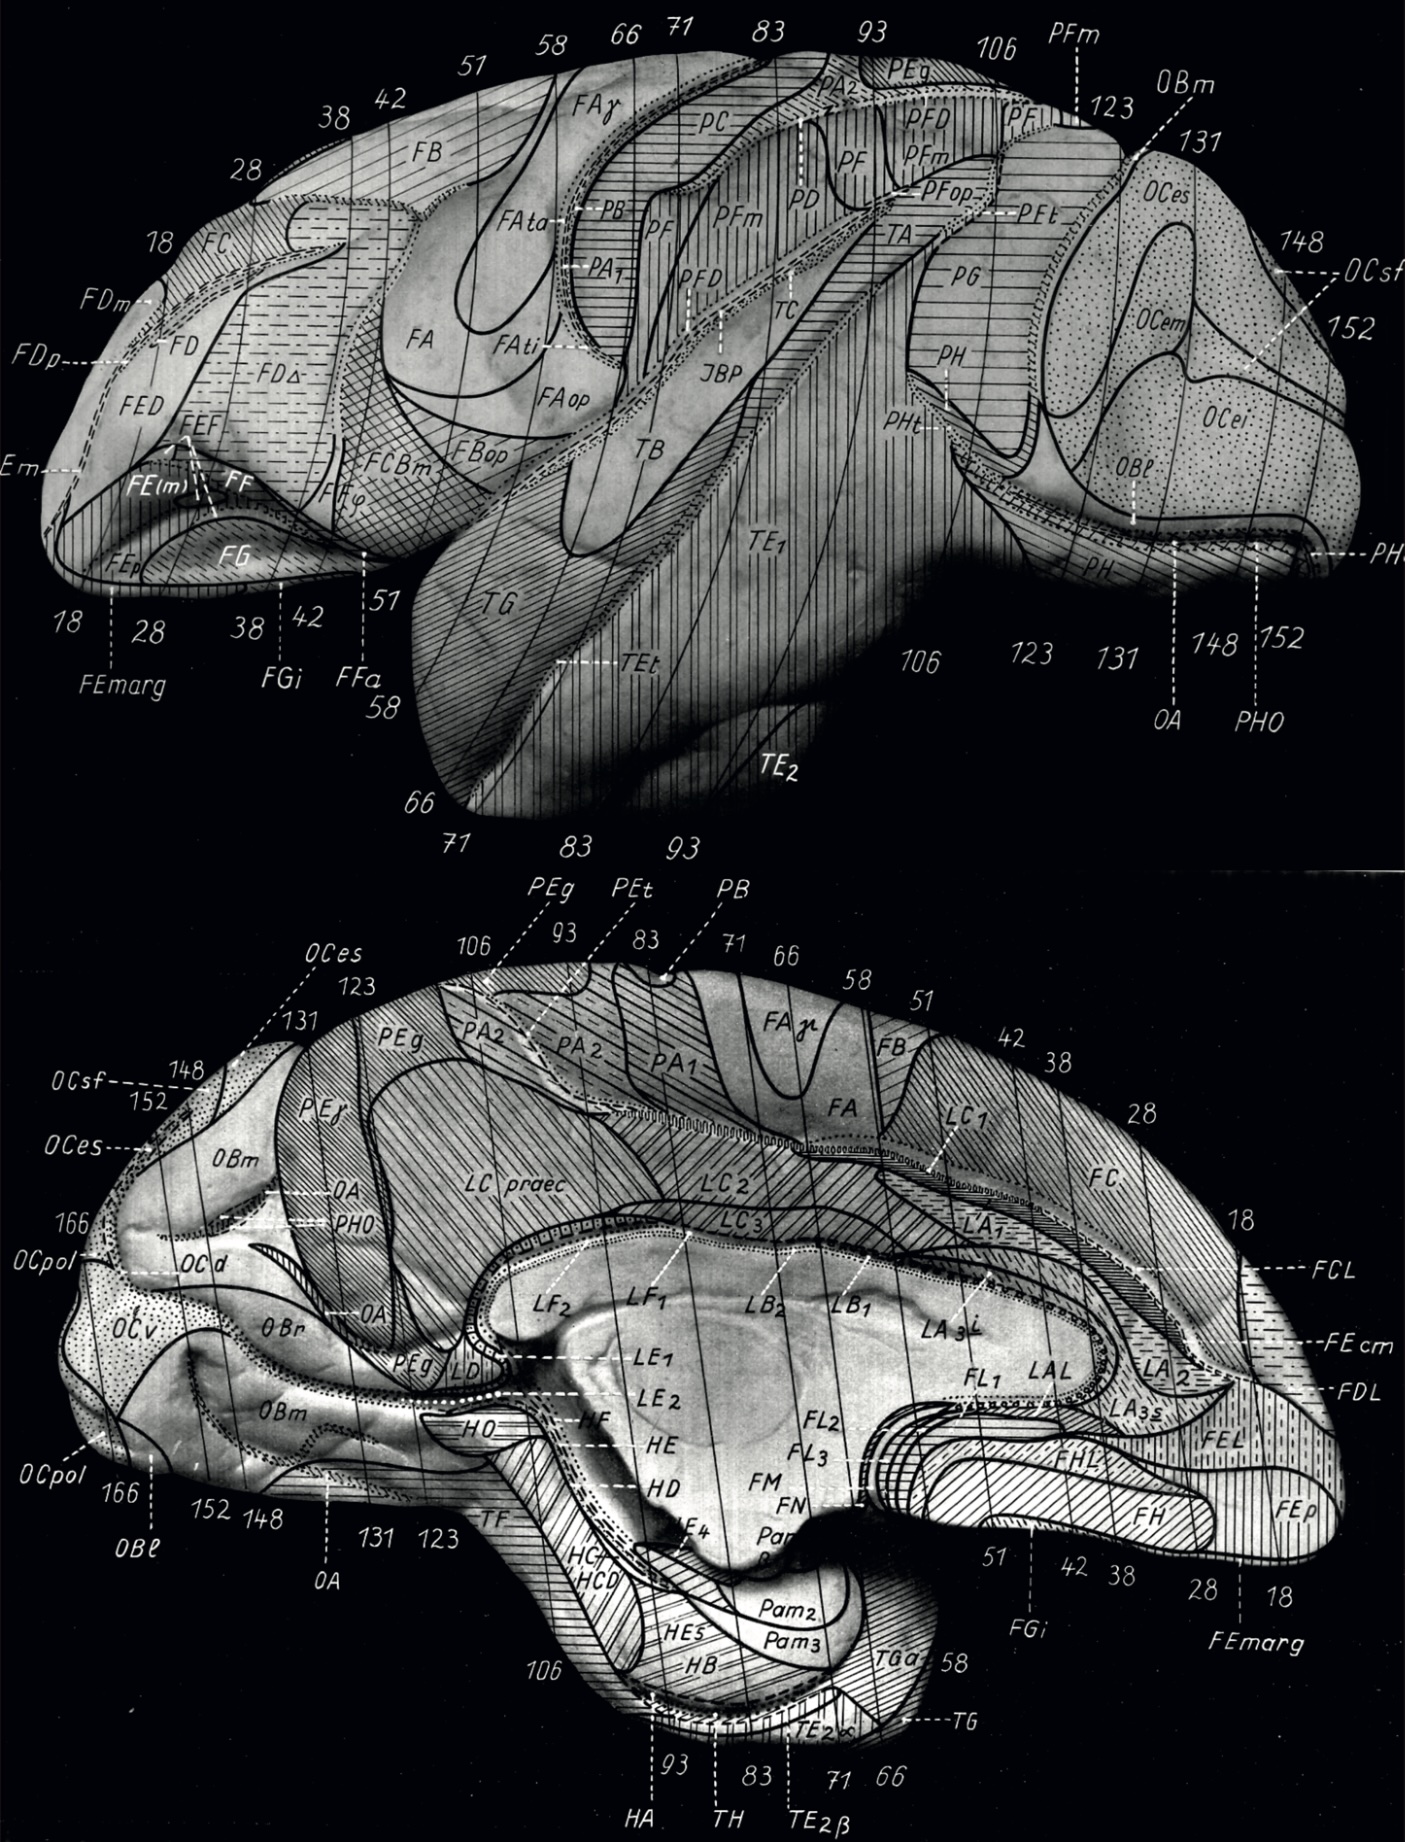
Pfeifer, 1940 // Republised as FIG 7.1 in Gulban, 2020. // Whole brain angio-architectonic (vascular) parcellation of a macaque brain based on cortical laminar patterns. Due to having no online record at the time, I have scanned and republished this figure within my PhD thesis.
doi.org/10.26481/dis.20201006og
Pfeifer, 1940 // Republised as FIG 7.1 in Gulban, 2020. // Angio-architectonic cortical laminar details across different brain areas in macaque. Due to having no online record at the time, I have scanned and republished this figure within my PhD thesis.
doi.org/10.26481/dis.20201006og
Scharrer, 1940 // FIG 1 // Brain of Rhesus monkey. Double injection with carmine gelatine and rice starch.
doi.org/10.1002/ar.1090780204
Scharrer, 1940 // FIG 4 // Cortex of Cat. A shows arteries, B shows veins. Note the greater number of arteries compared to veins. Starch injection.
doi.org/10.1002/ar.1090780204
Scharrer, 1940 // FIG 14 // Illustration of the vascular pattern of the brain of the Placentalia. Note tlat the vessels enter the brain singly. Arteries (A) and veins (V) are morphologically different in that the arteries give off their branches at narrow angles and in curved lines, whereas the veins receive their tributaries, whieh are more numerous than the branches originating from the arteries, more or less at right angles.
doi.org/10.1002/ar.1090780204
Abbie, 1933 // FIG 3 // Meso-vessels of the human lateral geniculate nucleus (LGN).
PMID: 17104443
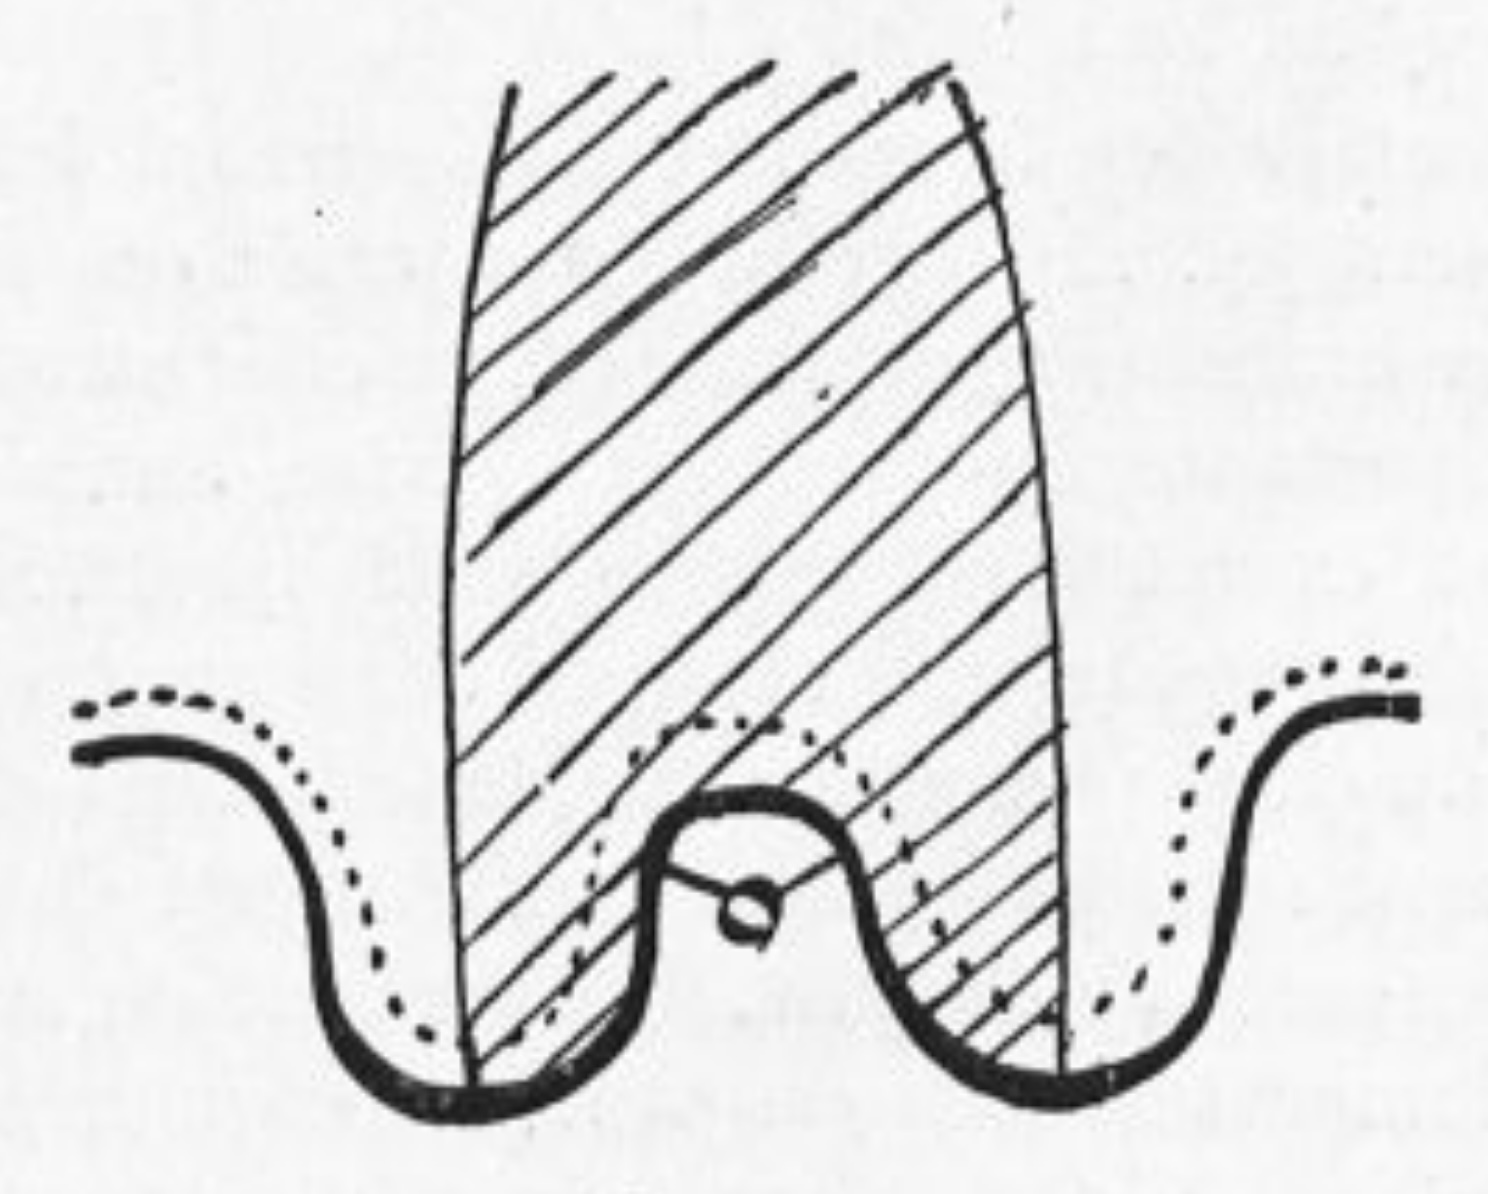
Foix, Levy, 1927 // FIG 5 // Diagram of a human cortex sulcal artery and its supply area.
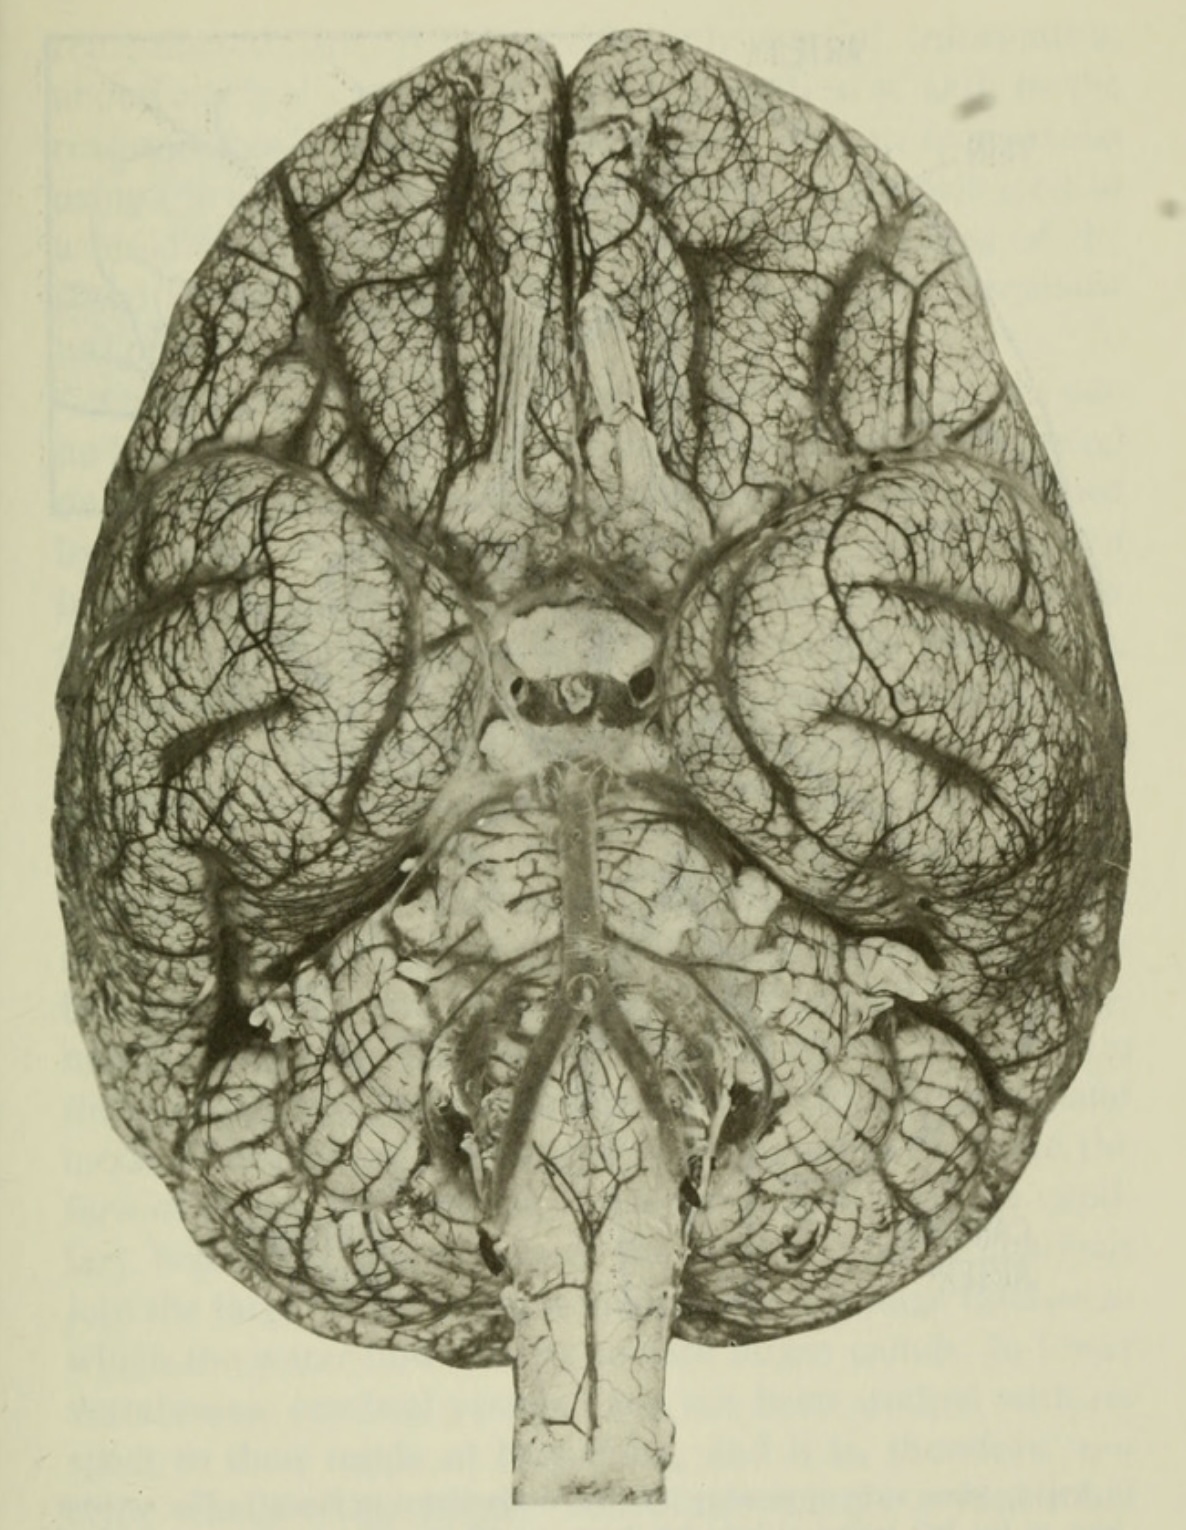
Gray, Lewis, 1918 // FIG 516 // The arteries of the base of the human brain.
Sobotta, McMurrich, Thomas, 1914 // FIG 548 // The cerebral branches of the internal carotid artery in humans. Immediately after piercing the dura mater at the base of the brain the internal carotid artery divides into four branches: (1) The posterior communicaling artery, (2) the chorioid artery, (3) the anterior cerebral artery, (4) the middle cerebral artery.
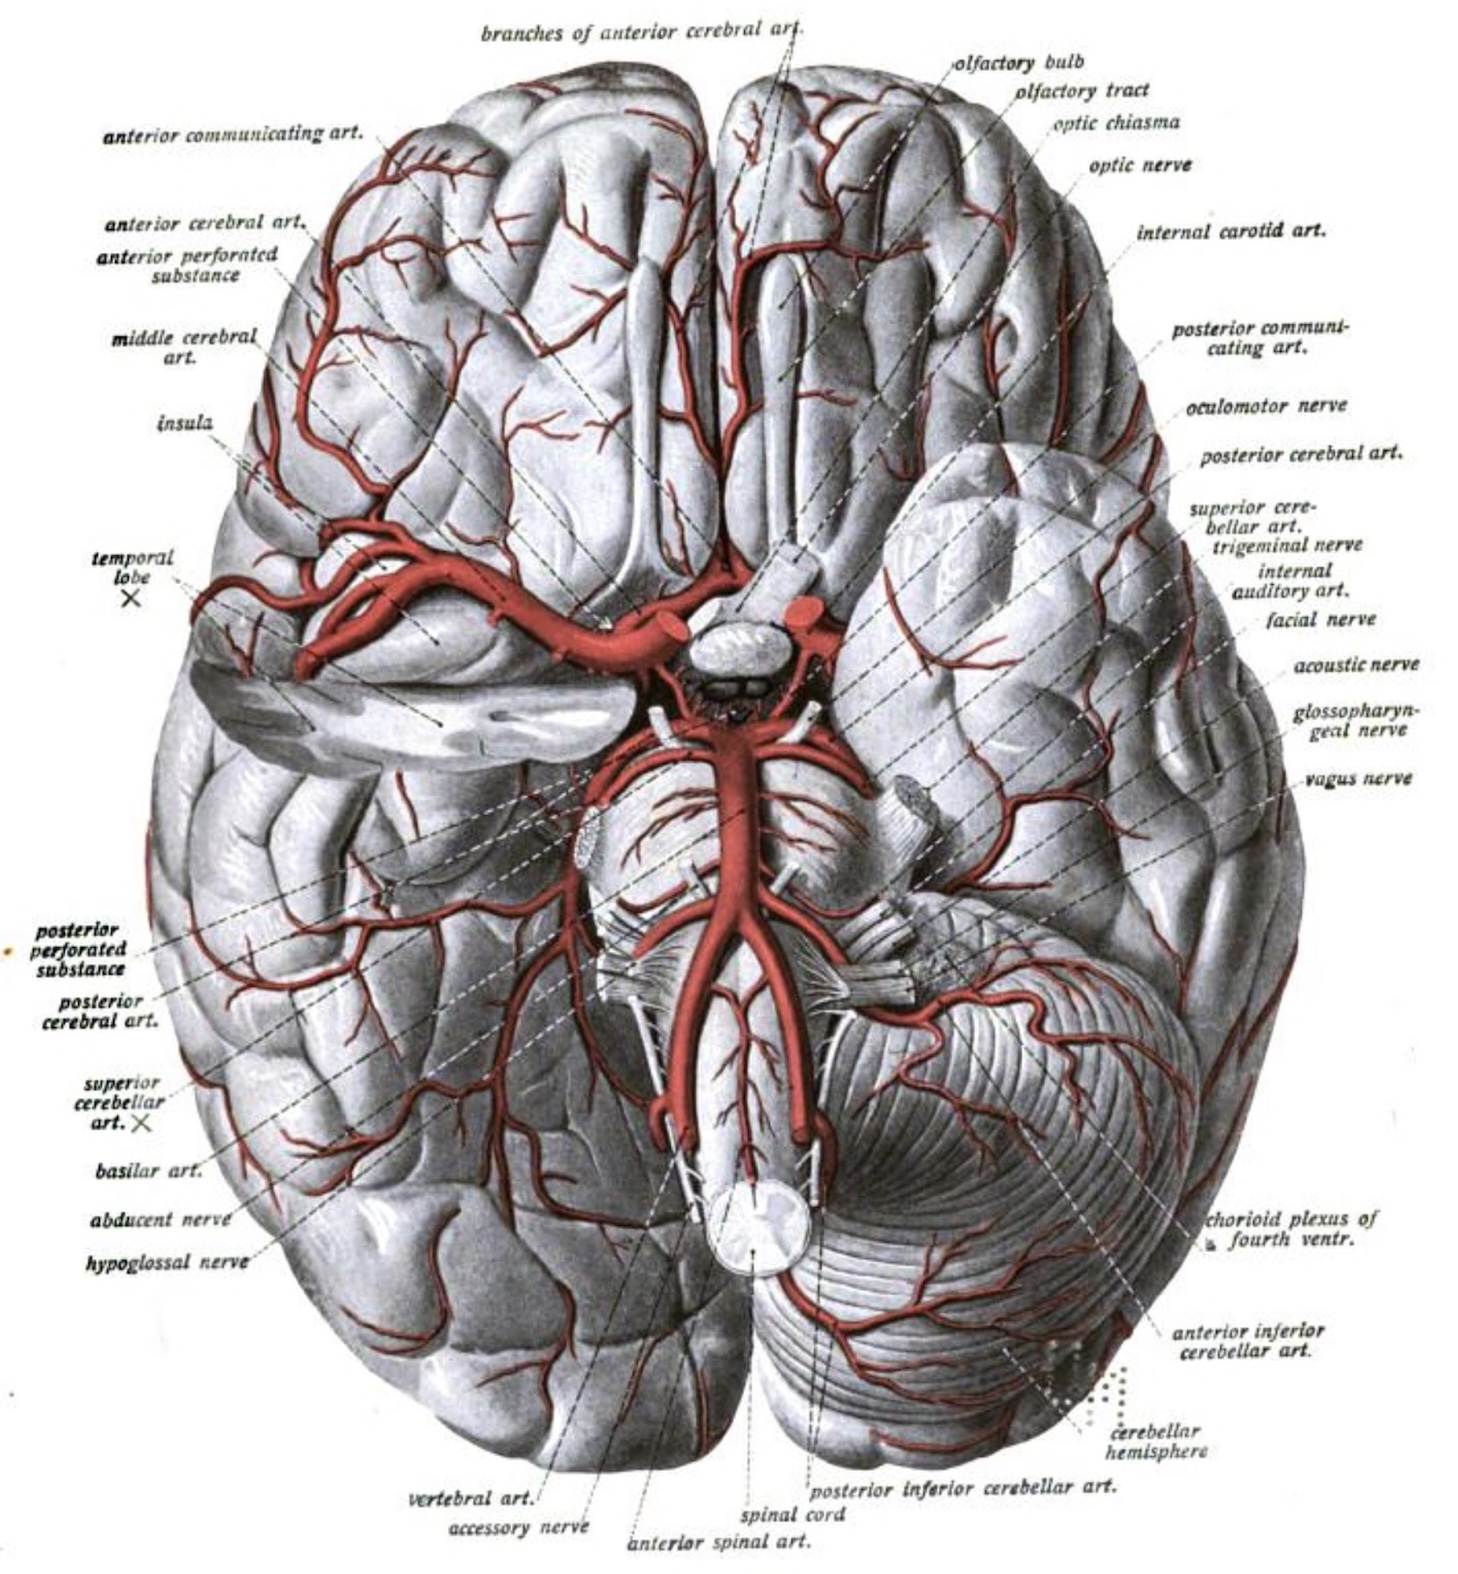
Sobotta, McMurrich, Thomas, 1914 // FIG 549 // The cerebral branches of the internal carotid artery in humans. Immediately after piercing the dura mater at the base of the brain the internal carotid artery divides into four branches: [1] The posterior communicaling artery, [2] the chorioid artery (not visible here), [3] the anterior cerebral artery, (4) the middle cerebral artery.
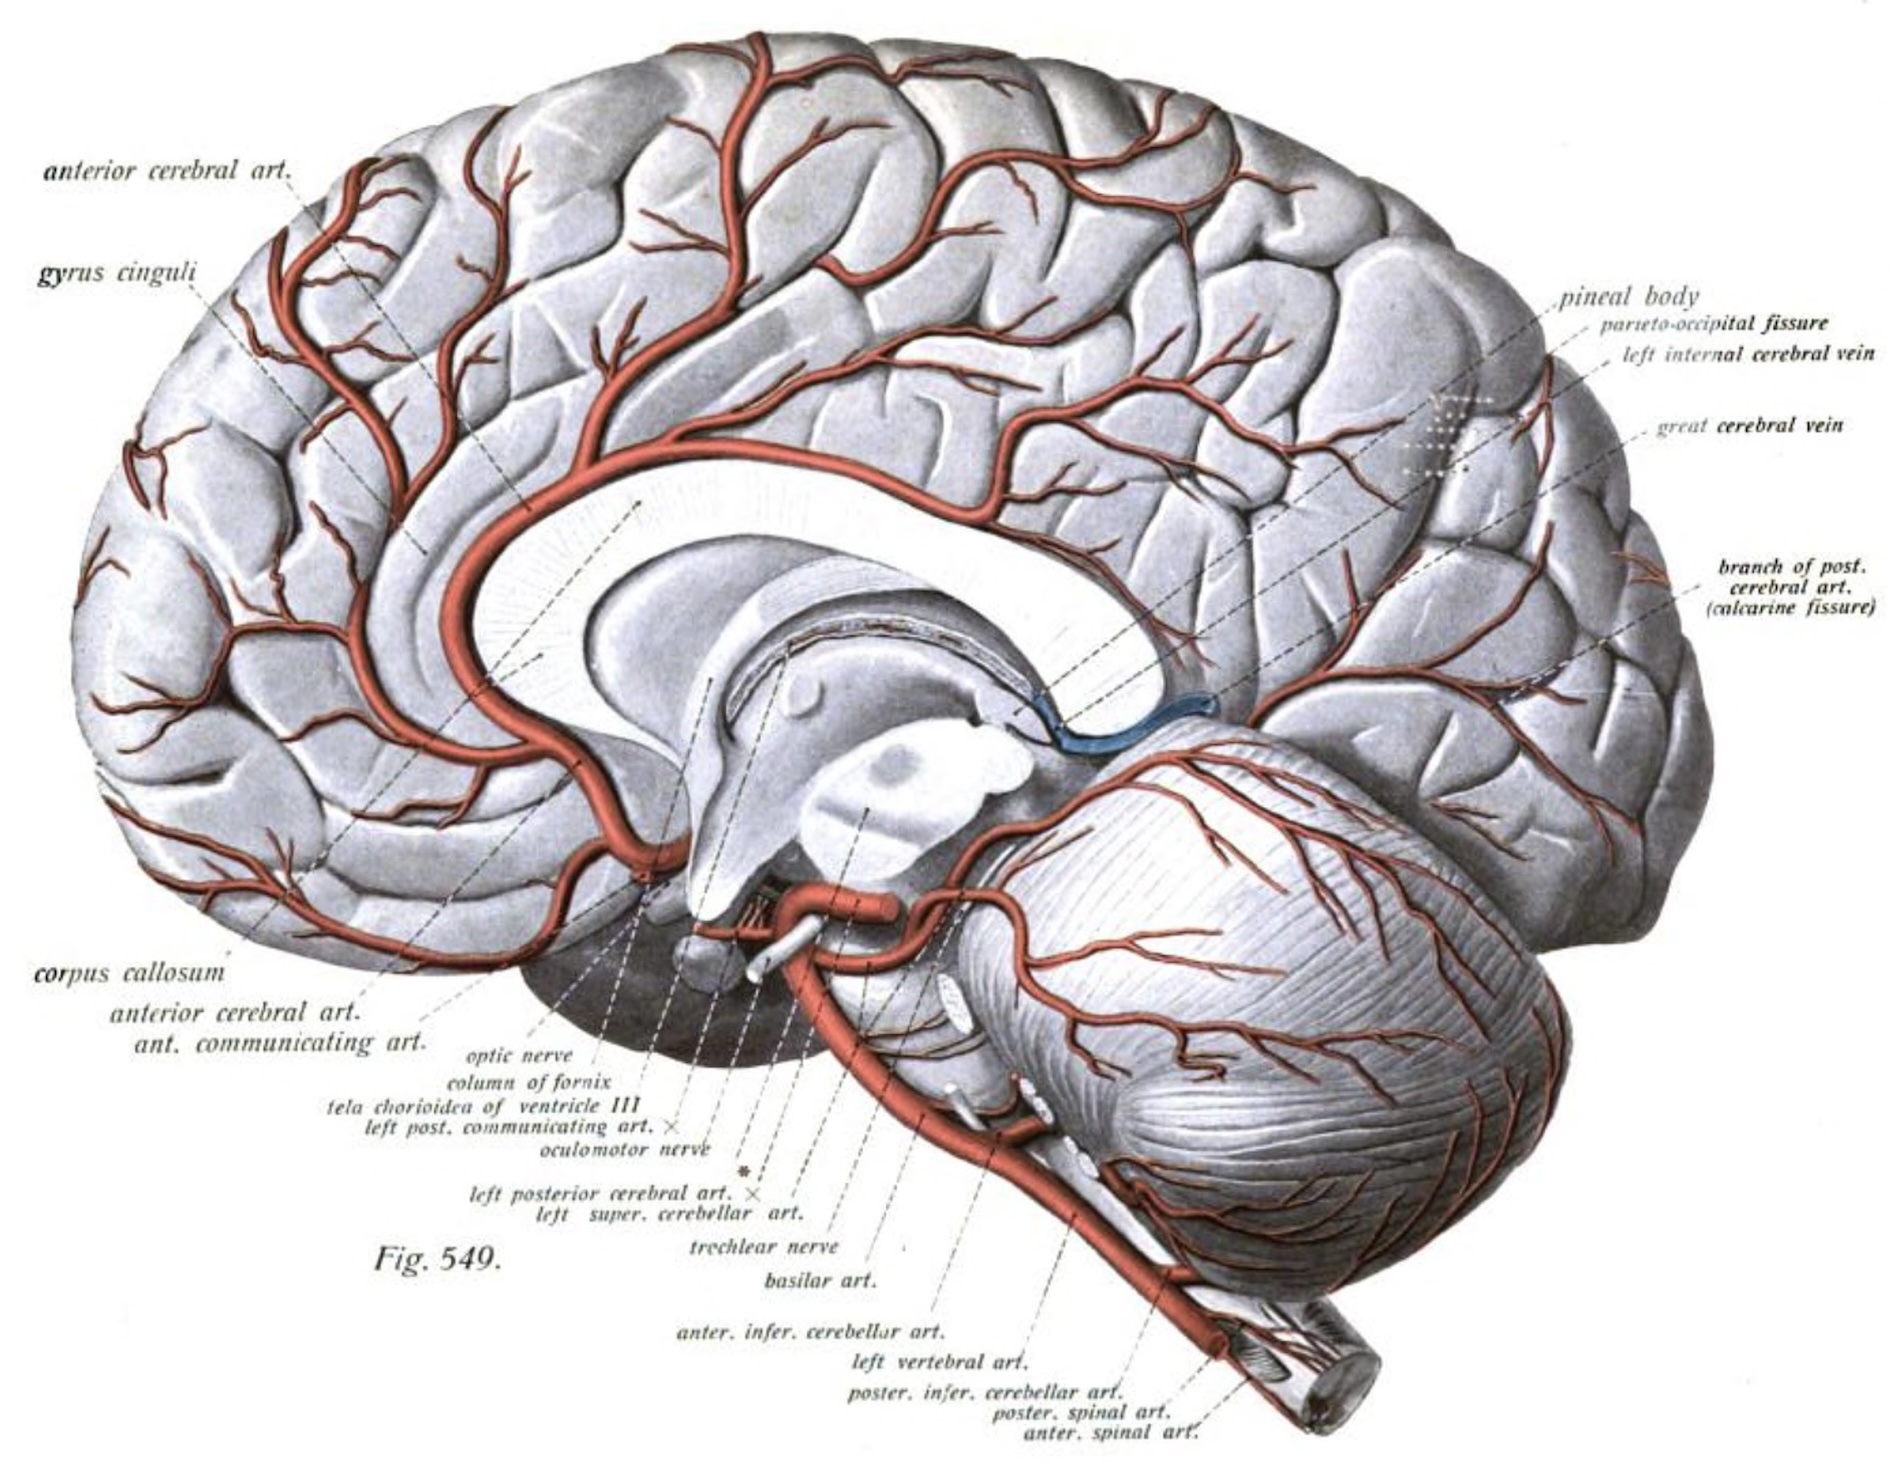
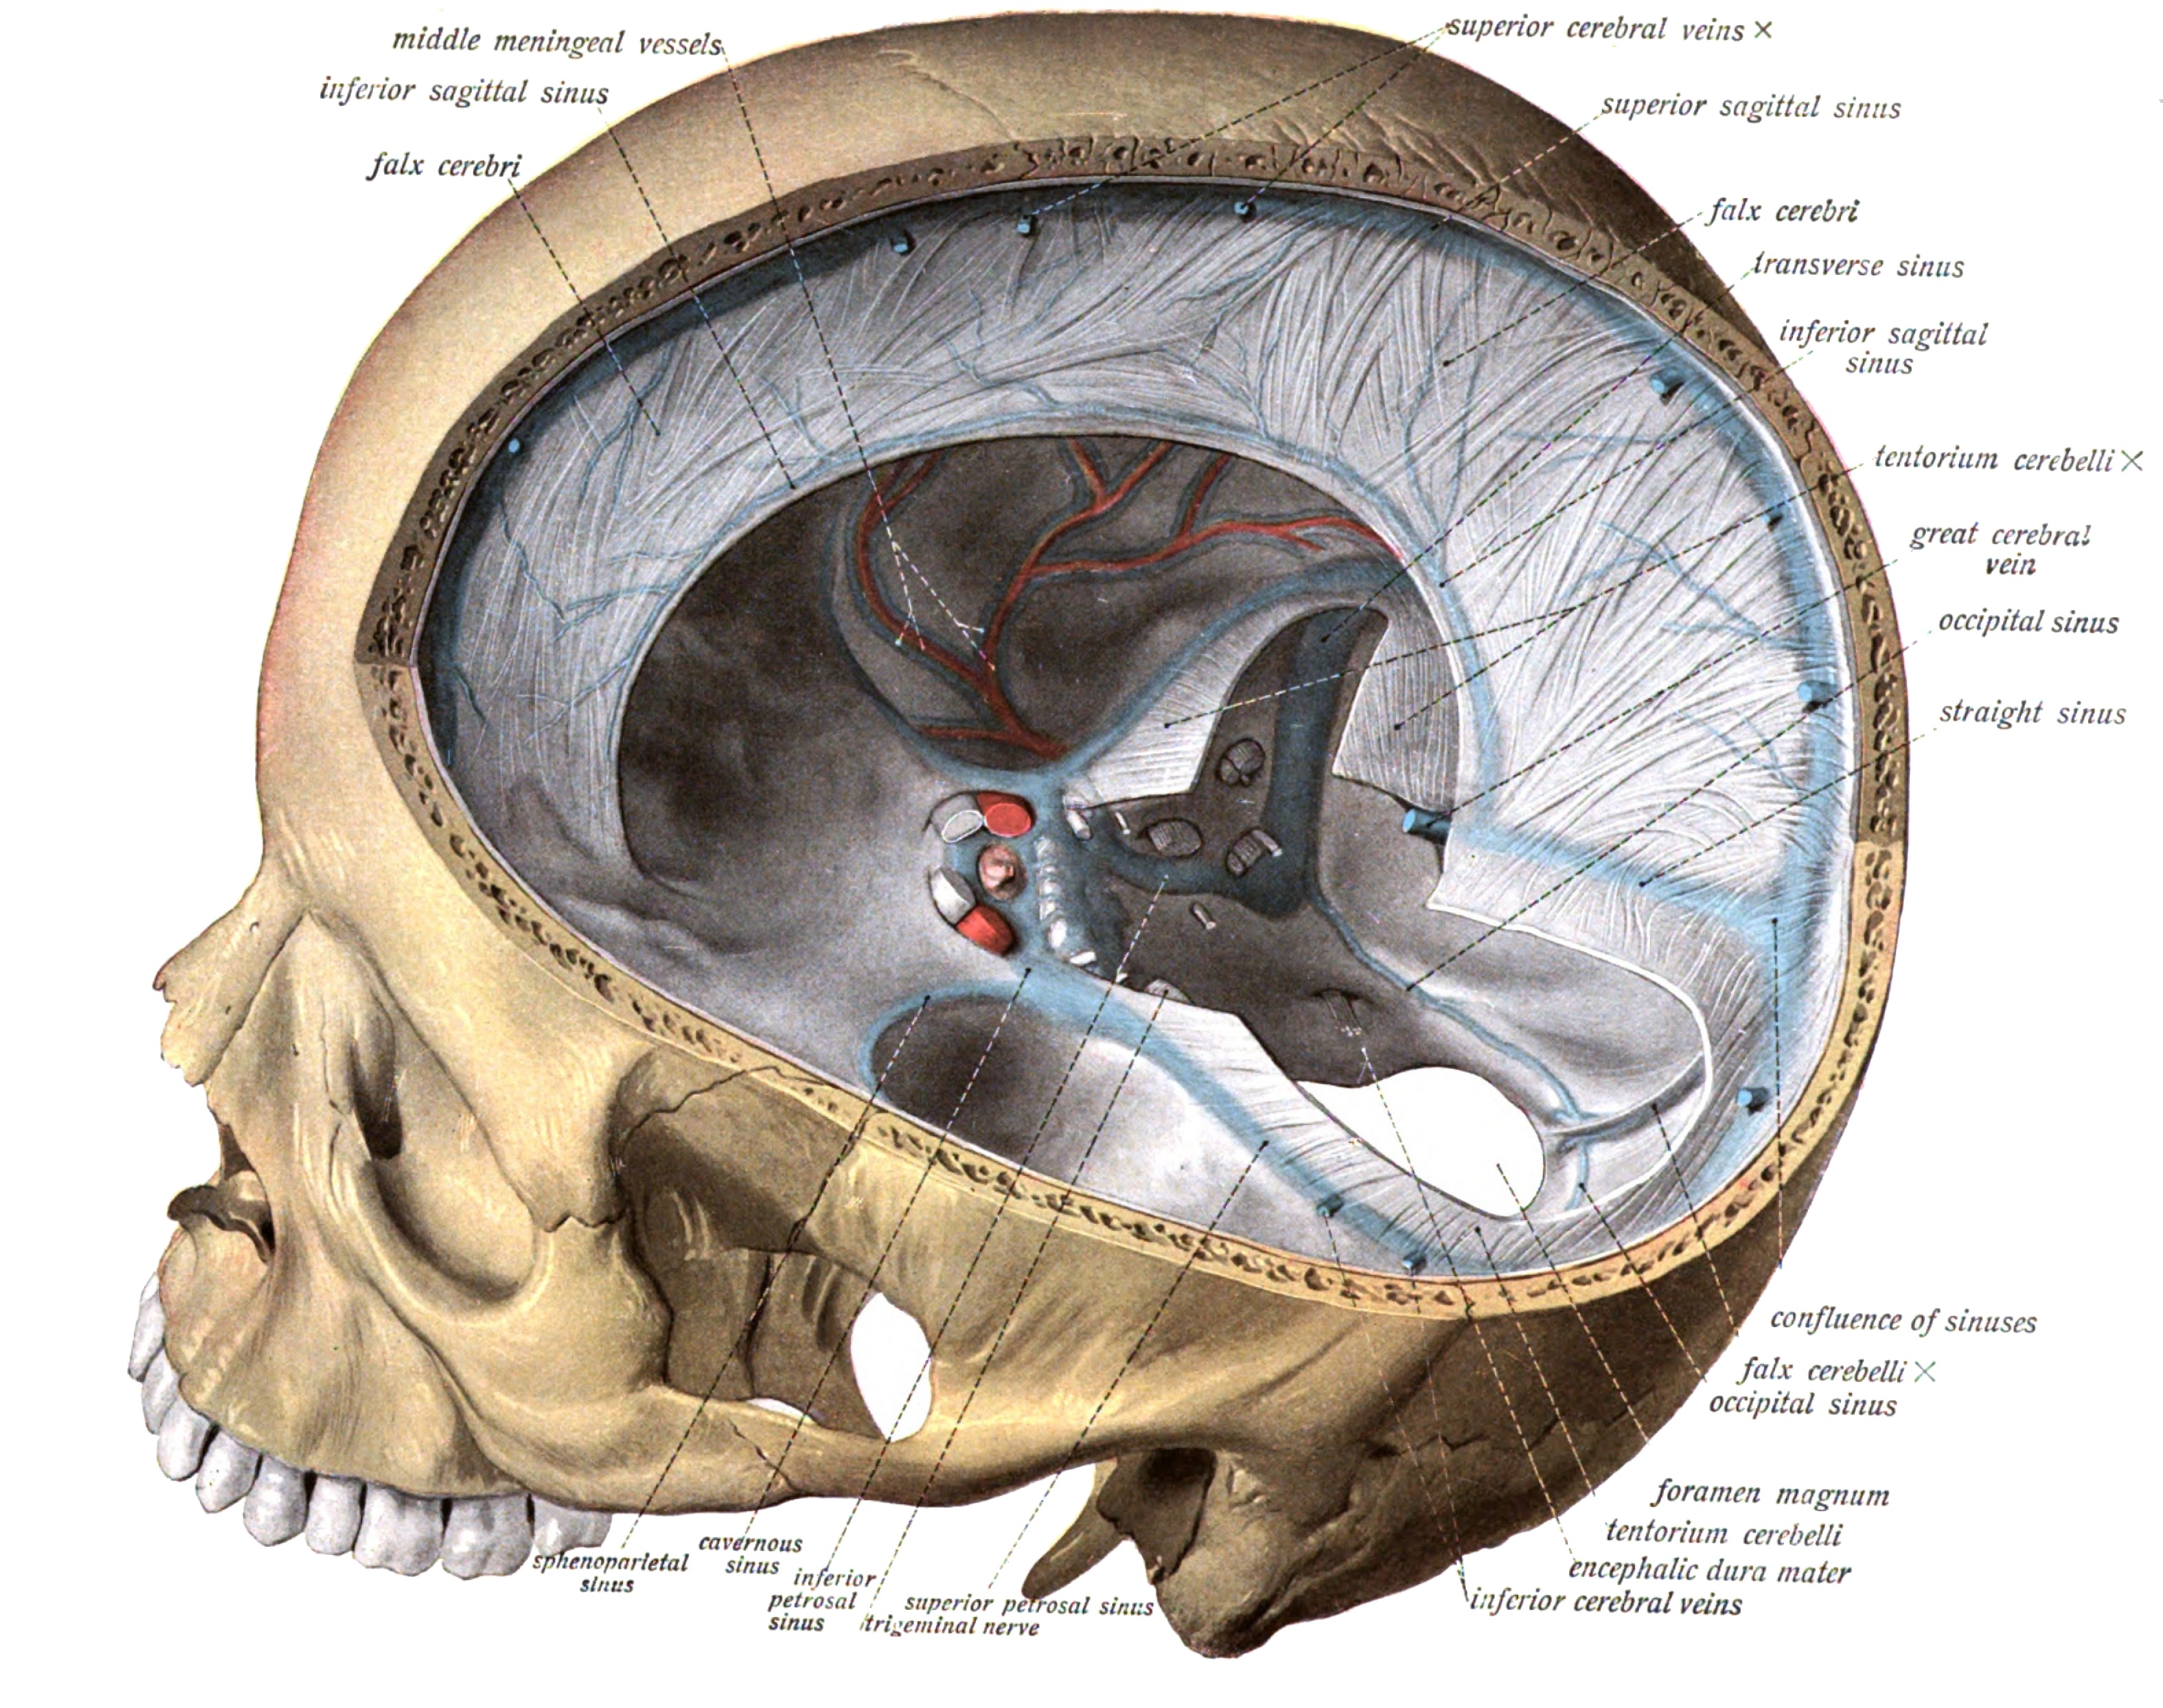
Sobotta, McMurrich, Thomas, 1914 // FIG 549 // The human dura mater and its sinuses as seen from the left and from above.
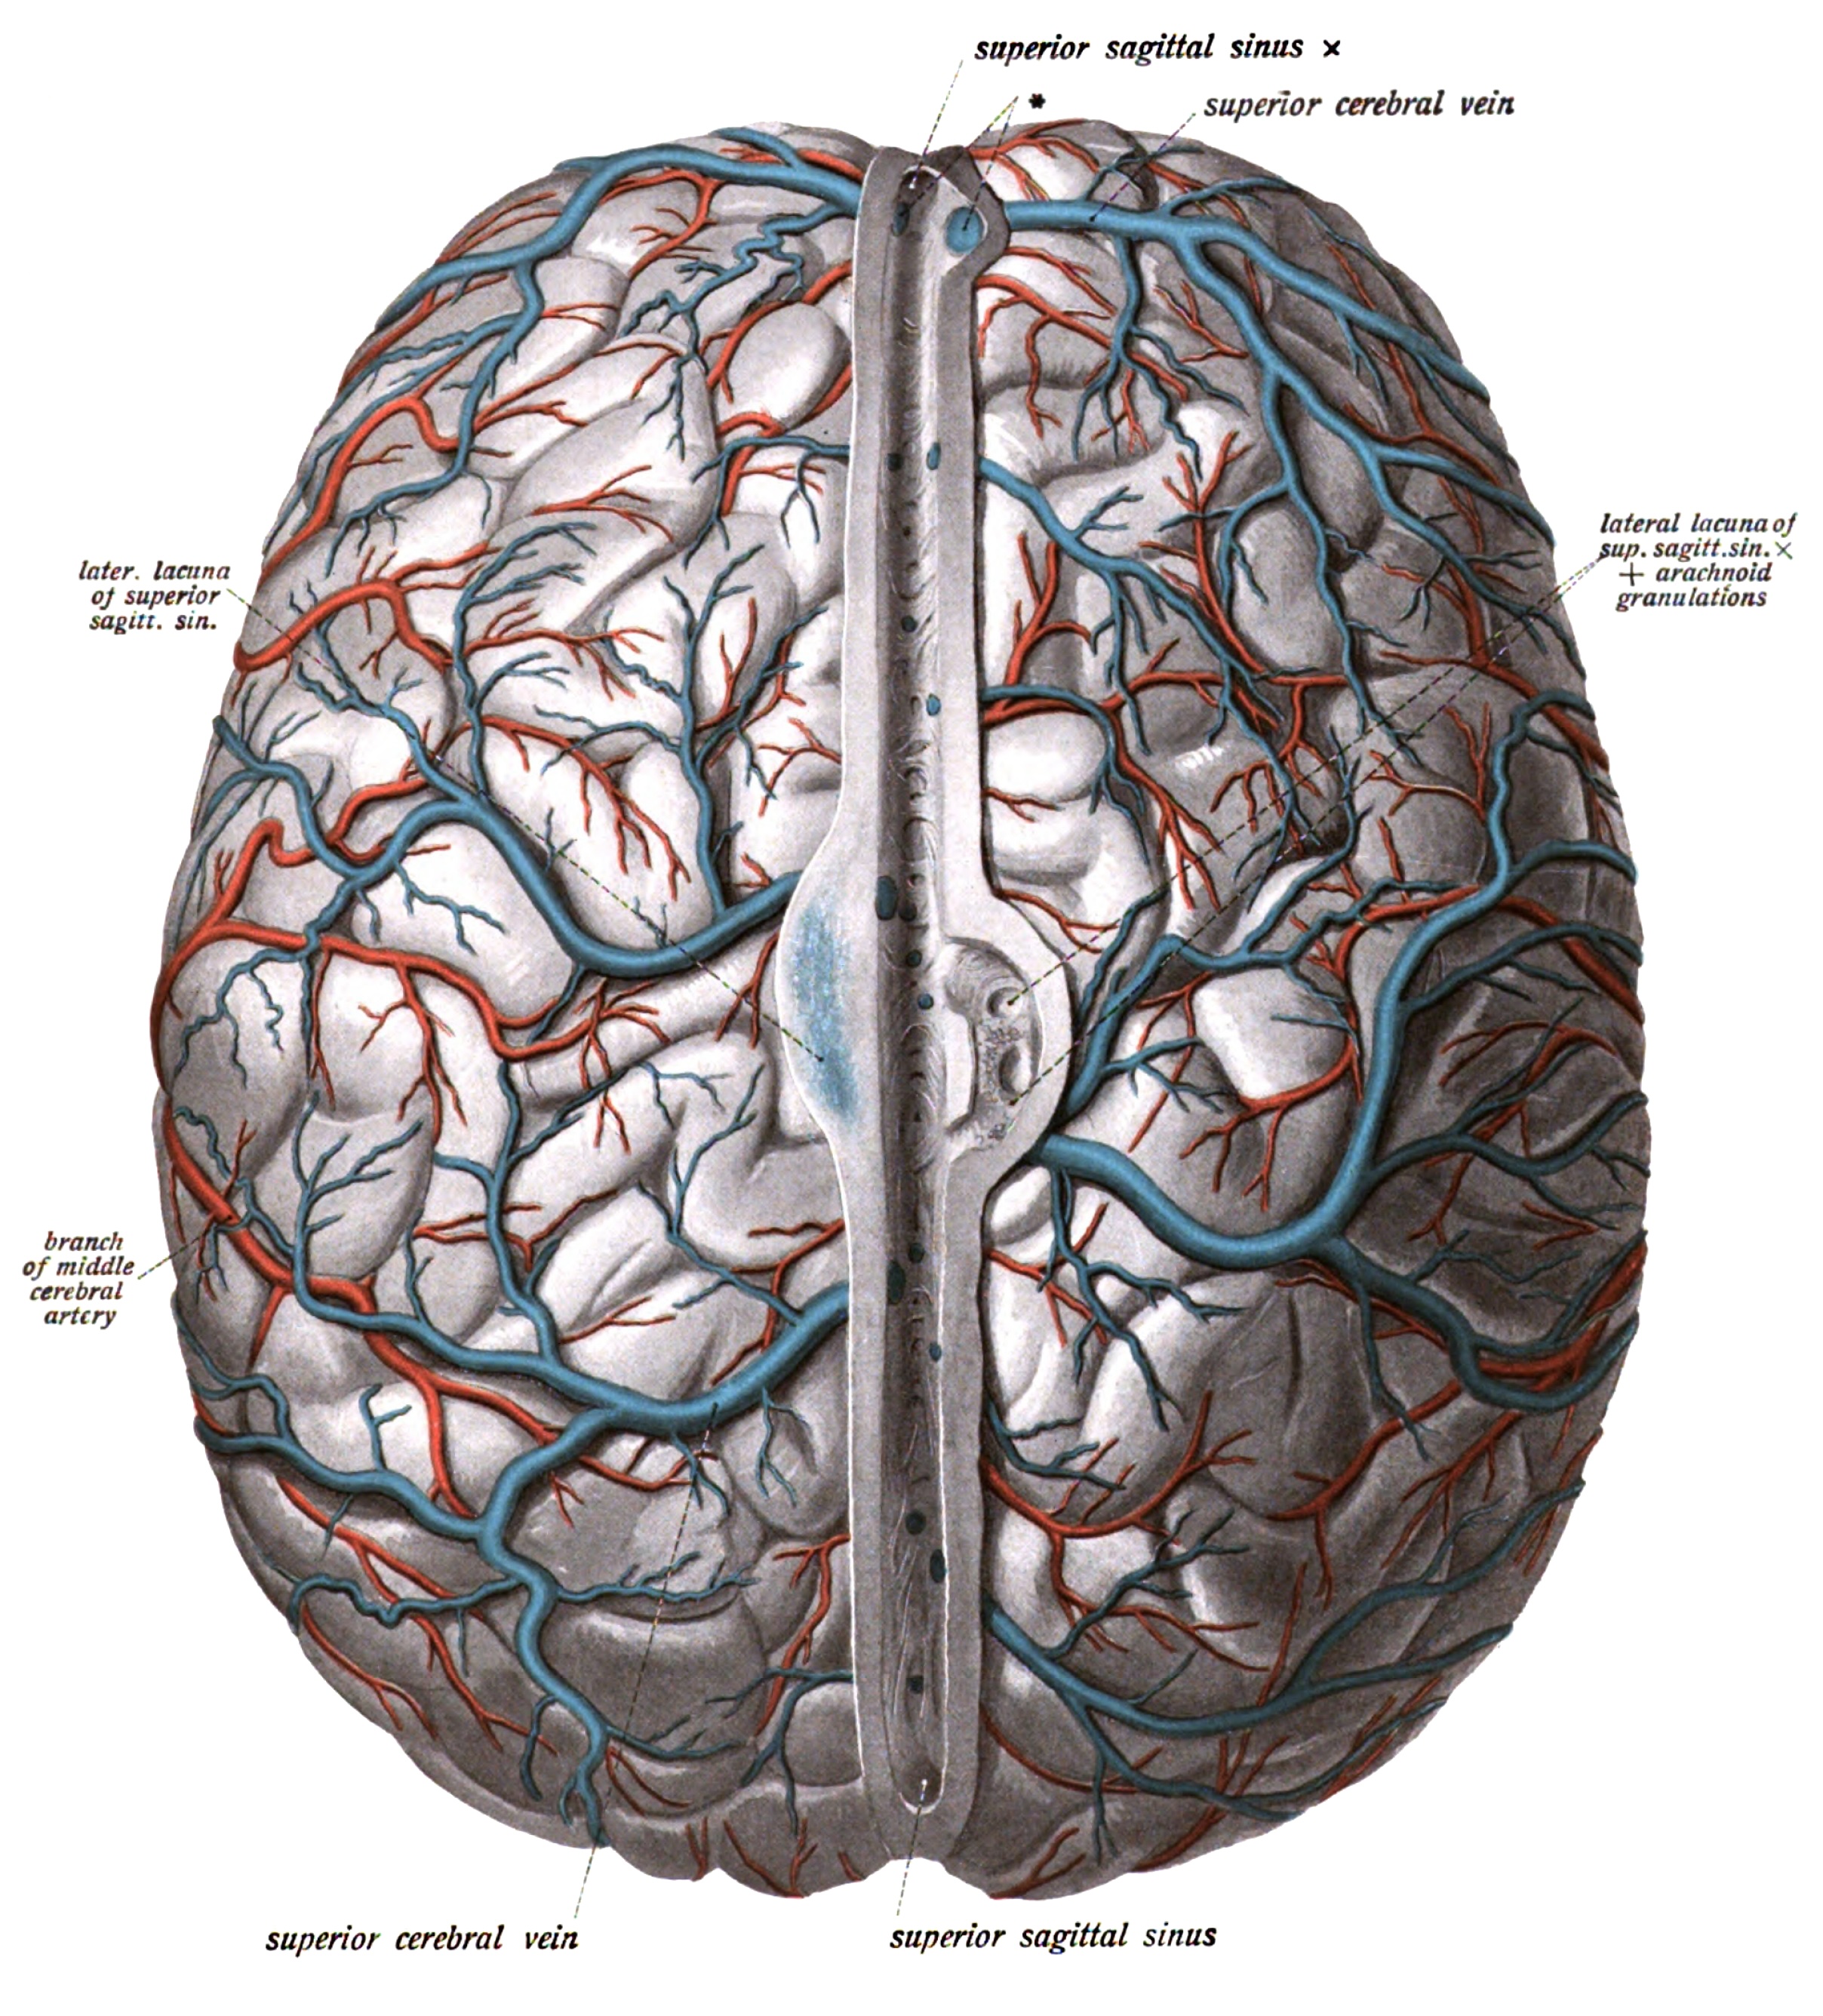
Sobotta, McMurrich, Thomas, 1914 // FIG 549 // The arteries and veins of the human brain as seen from above.
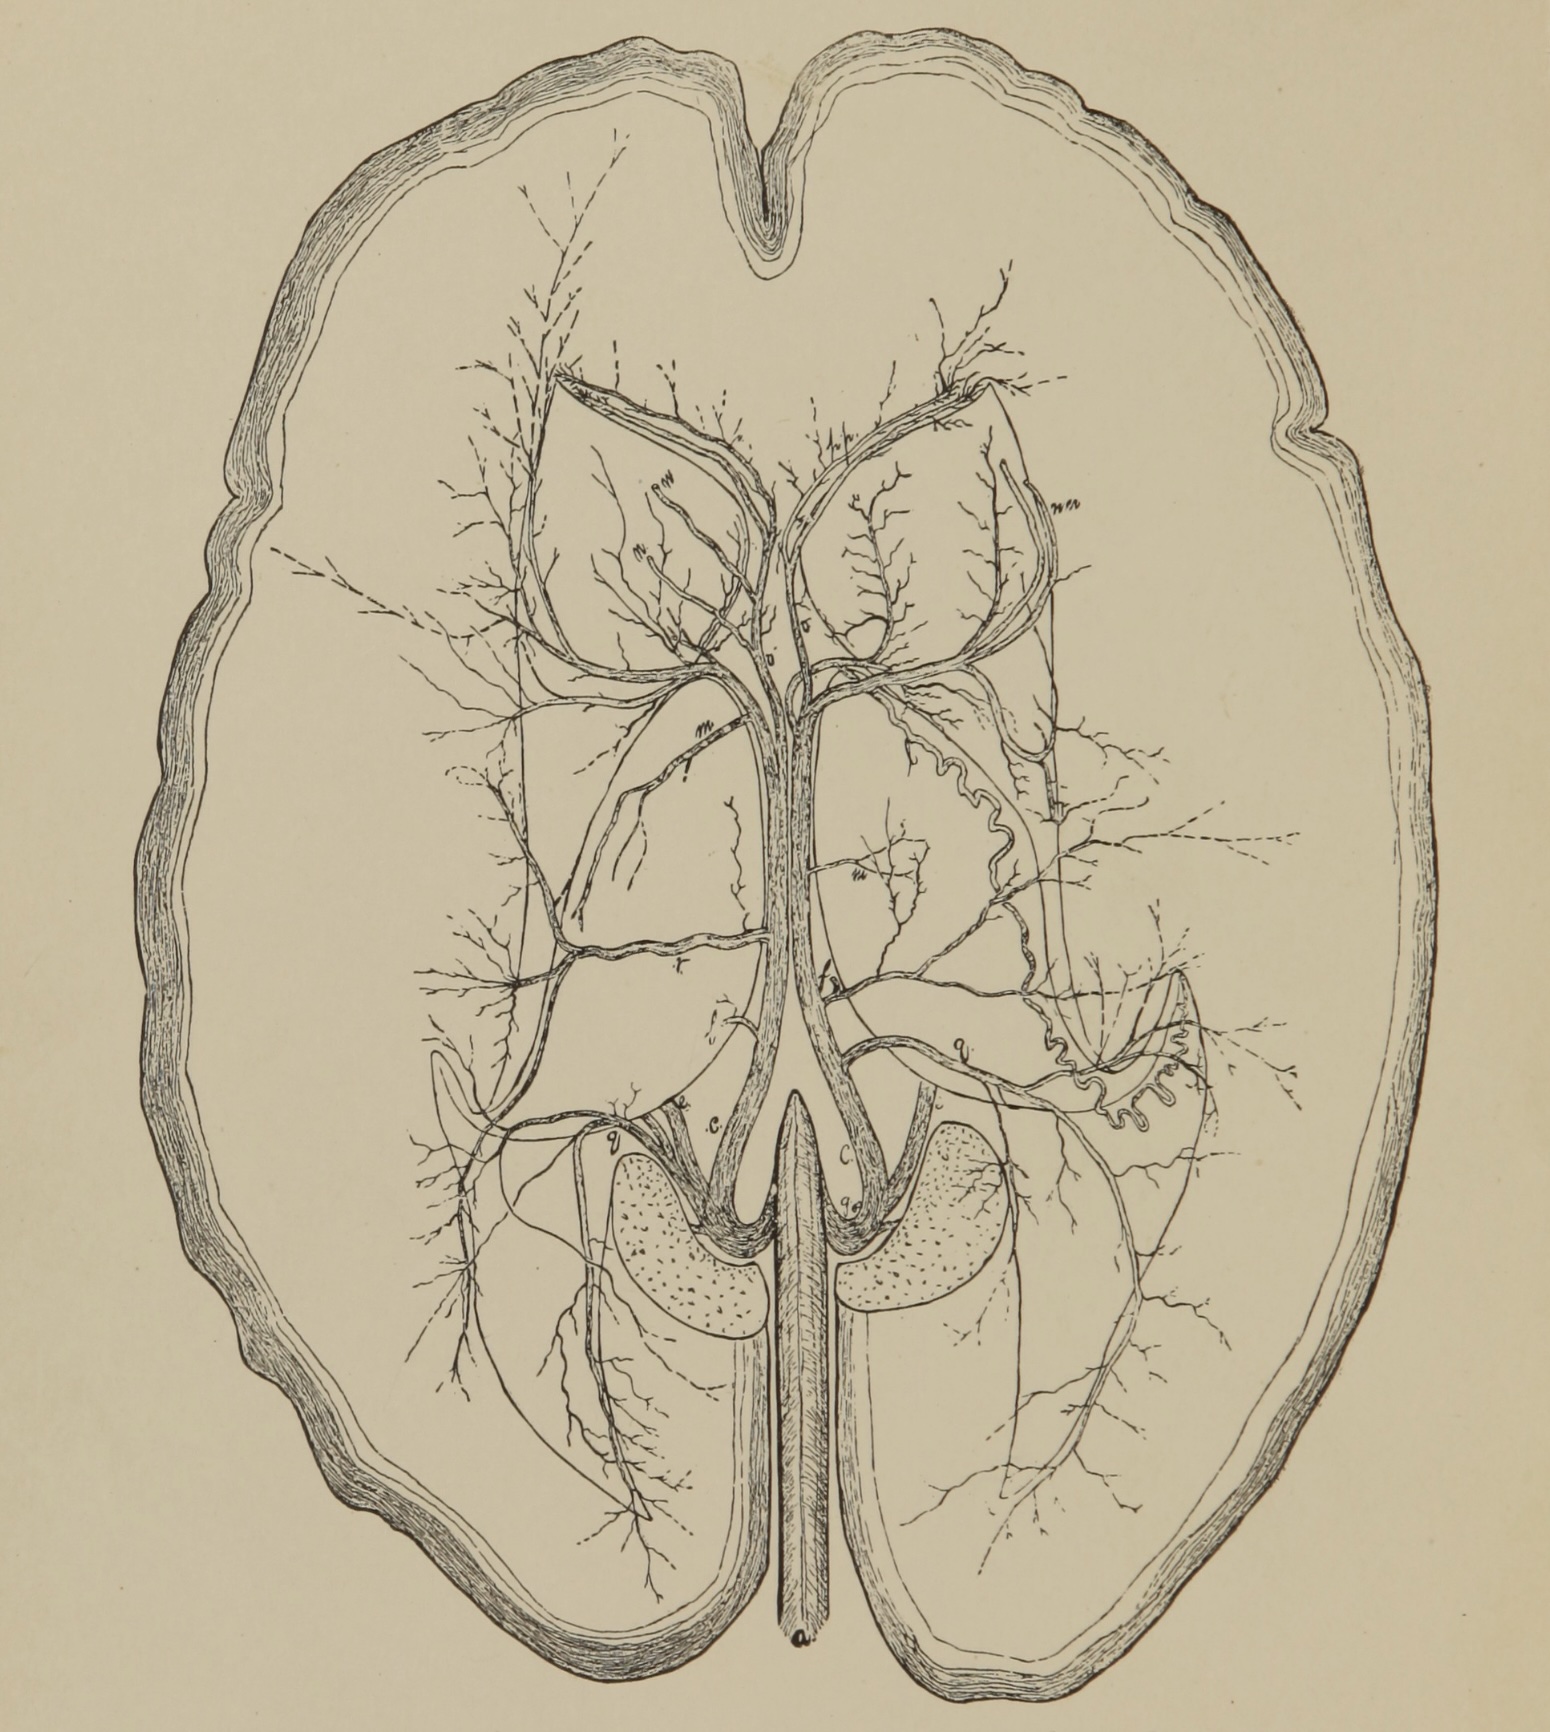
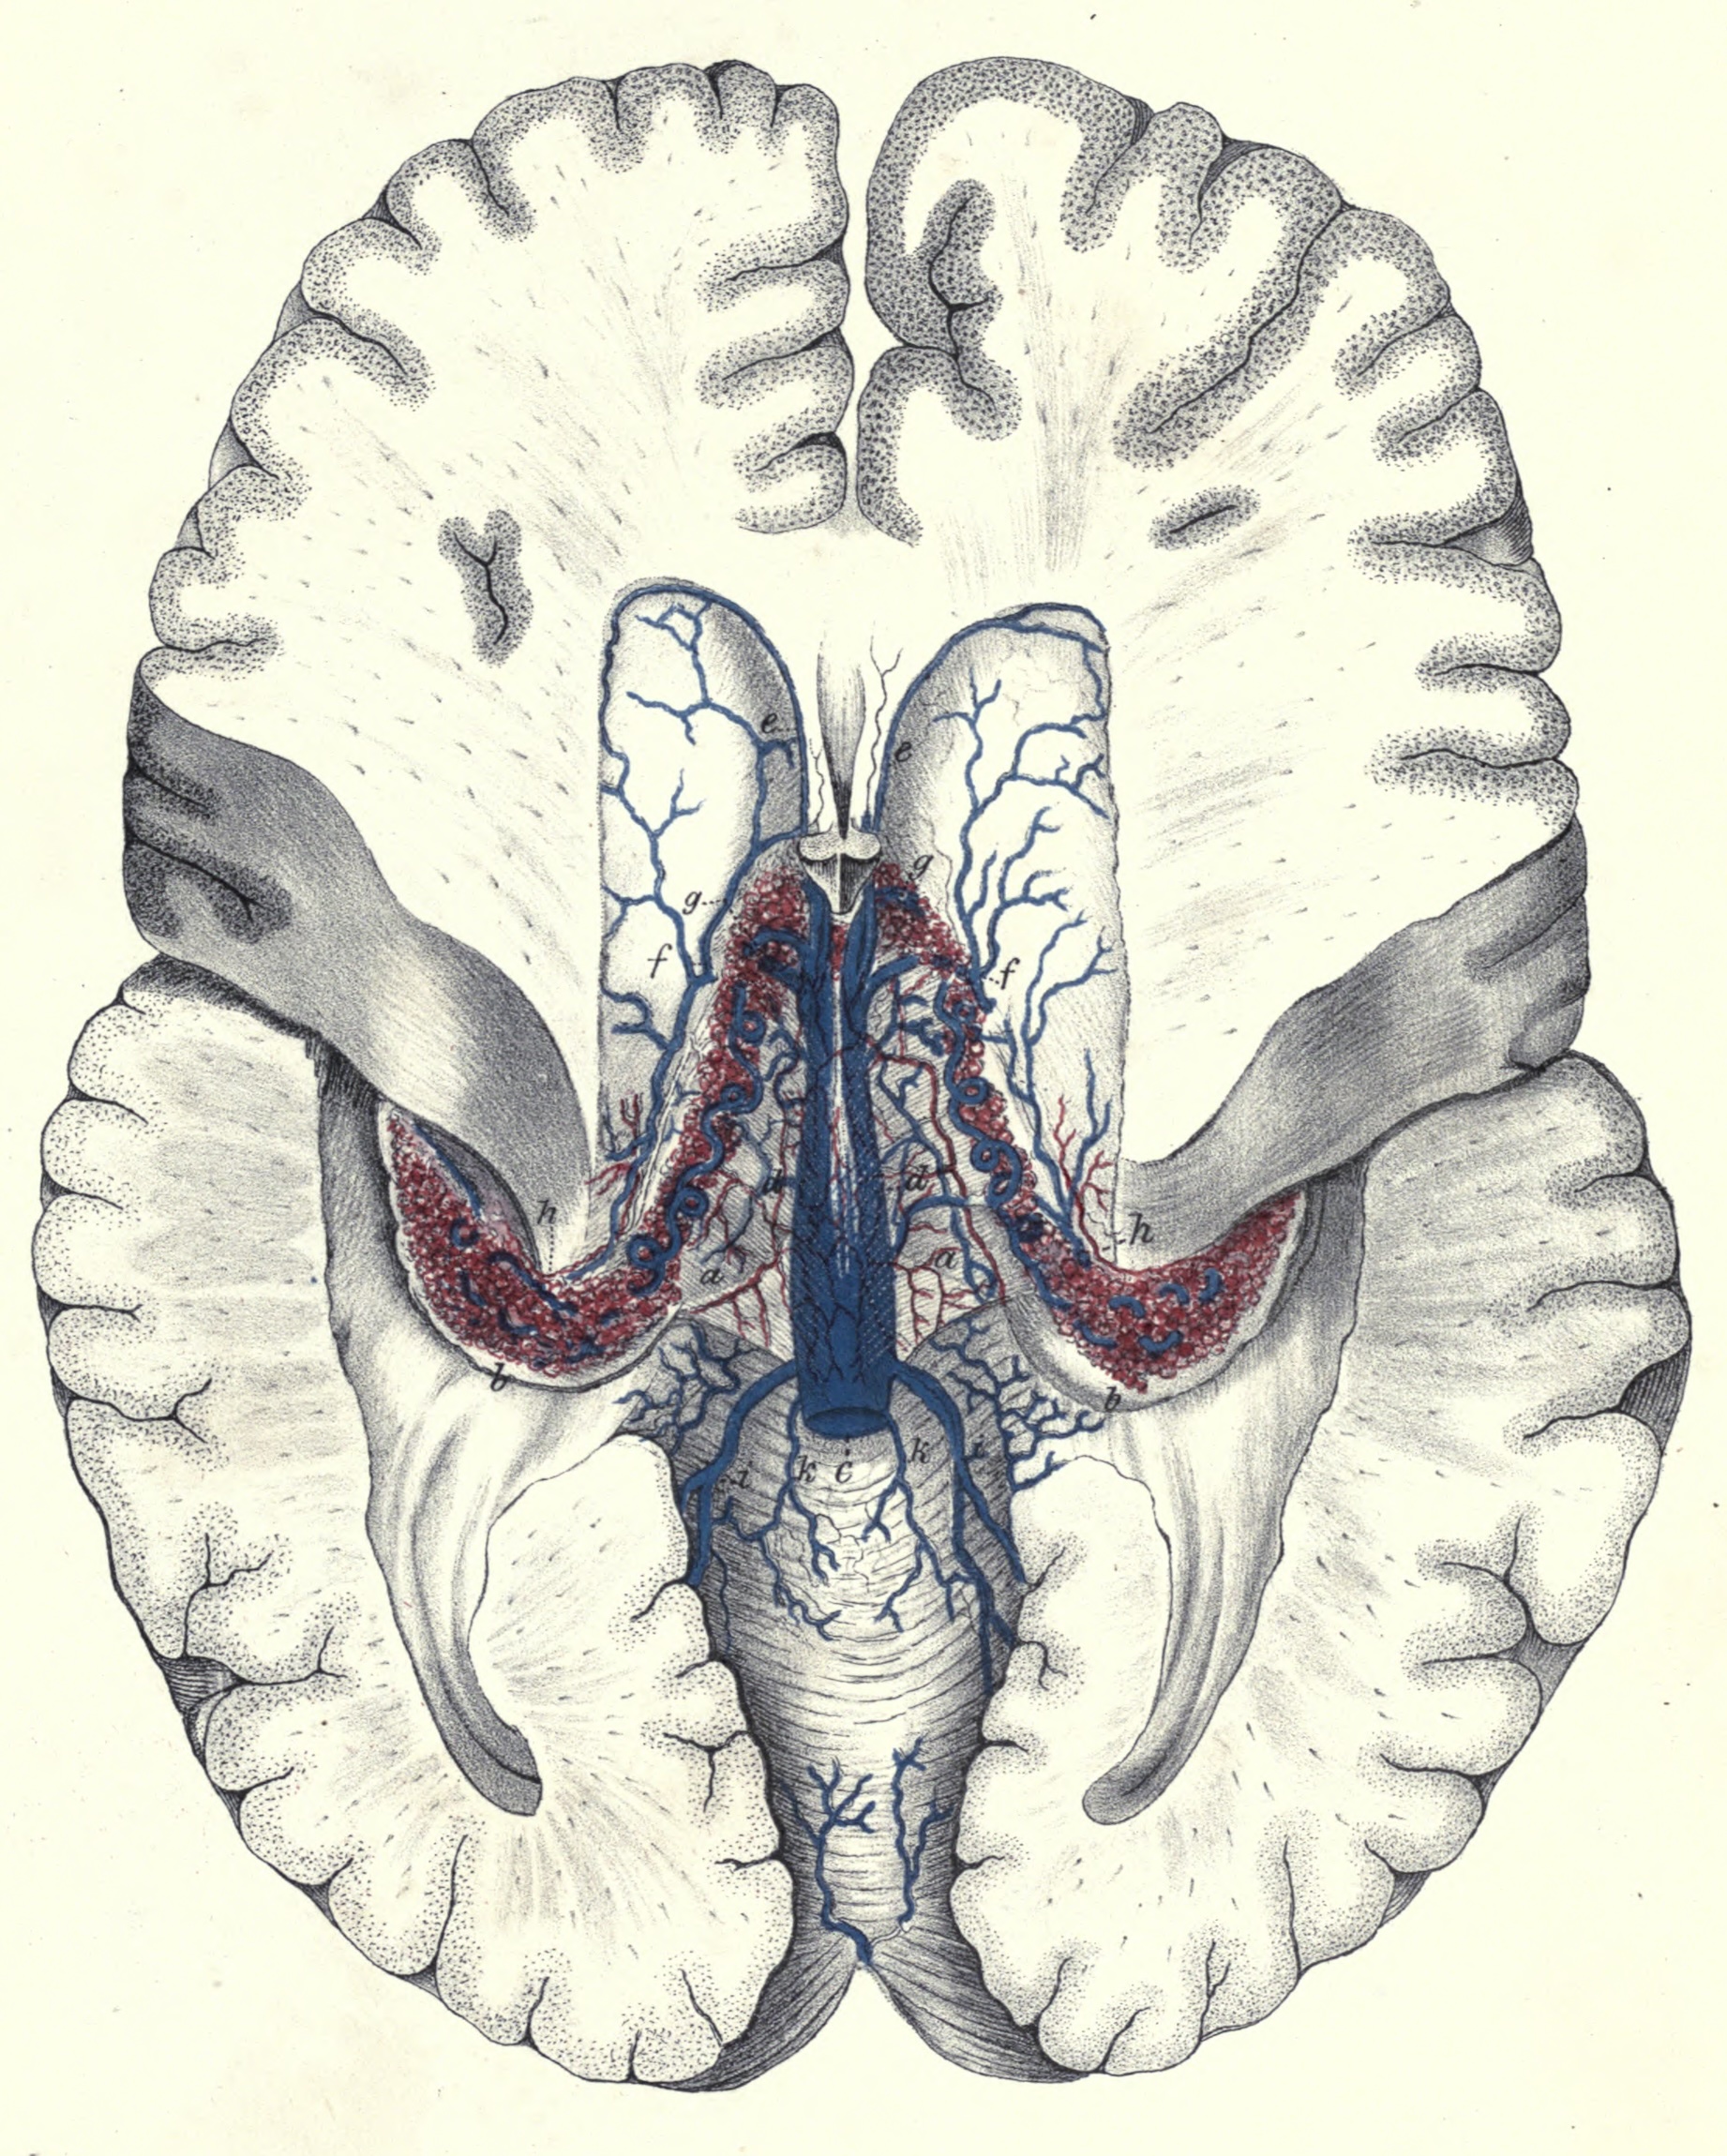
Browning, 1884 // FIG 1 // The white matter and ventricular veins in the human brain.
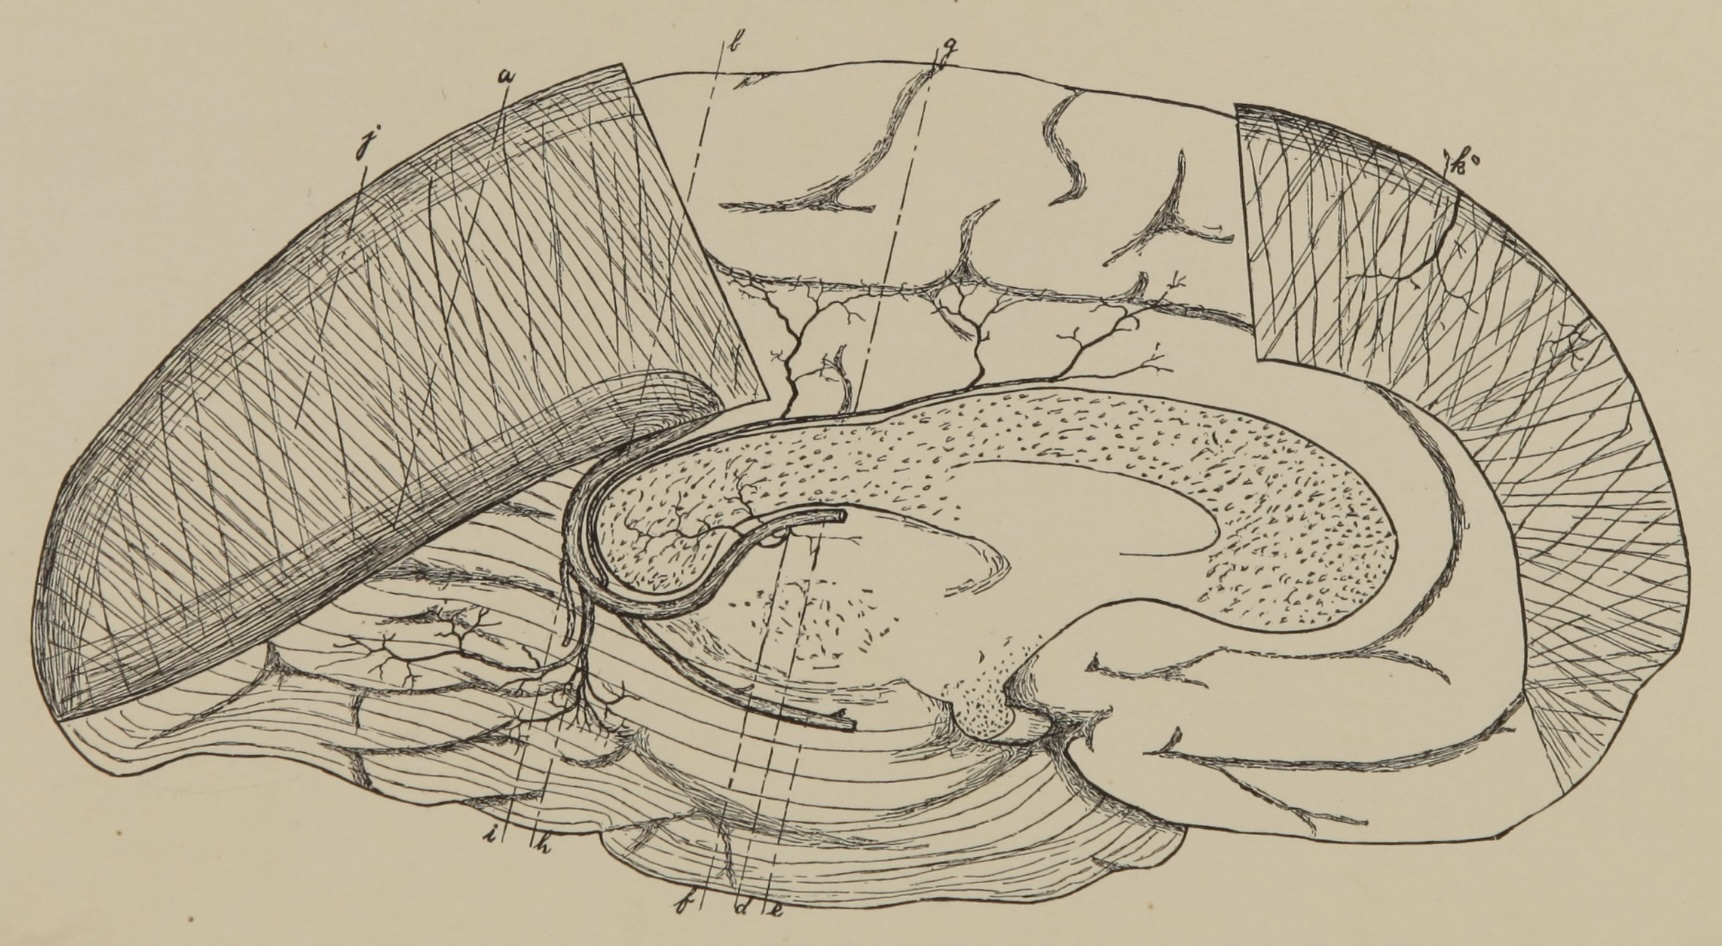
Browning, 1884 // FIG 2 // The great cerebral vein (vein of Galen, vena magna Galen) and its smaller branches in the human brain.
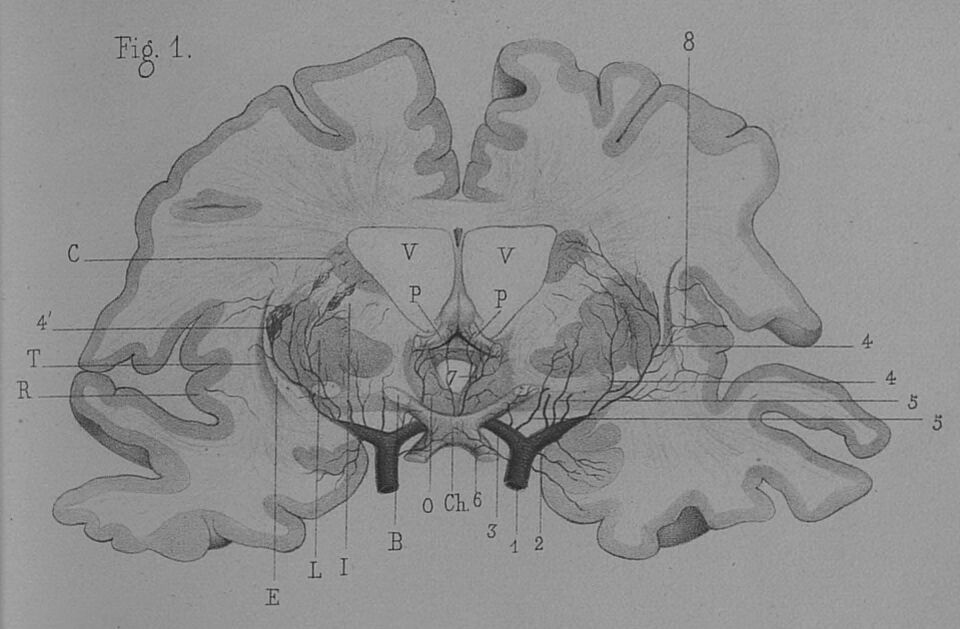
Duret, 1874 // TOME VI PL 4 FIG 1 // Meso-arteries of the human subcortex. Transverse section made 1 centimeter behind the optic chiasm.
Duret, 1874 // TOME VI PL 4 FIG 2 // Meso-arteries of the human subcortex. Transverse section at the level of the optic chiasm.
Duret, 1874 // TOME VI PL 5 FIG 1 // Arteries of the human brain.
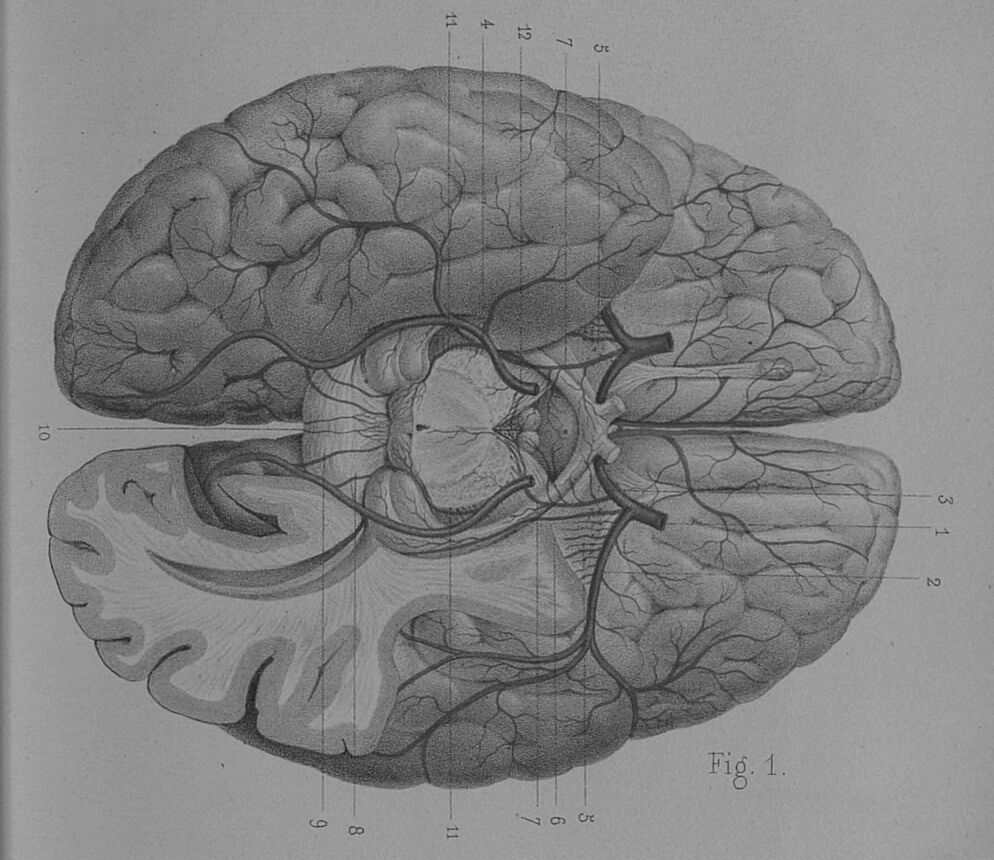
Luschka, 1855 // TAF IV // Human subcortical macro- and meso-veins. Internal cerebral veins and the external veins emptying into the Vein of Galen (c) can bee seen.
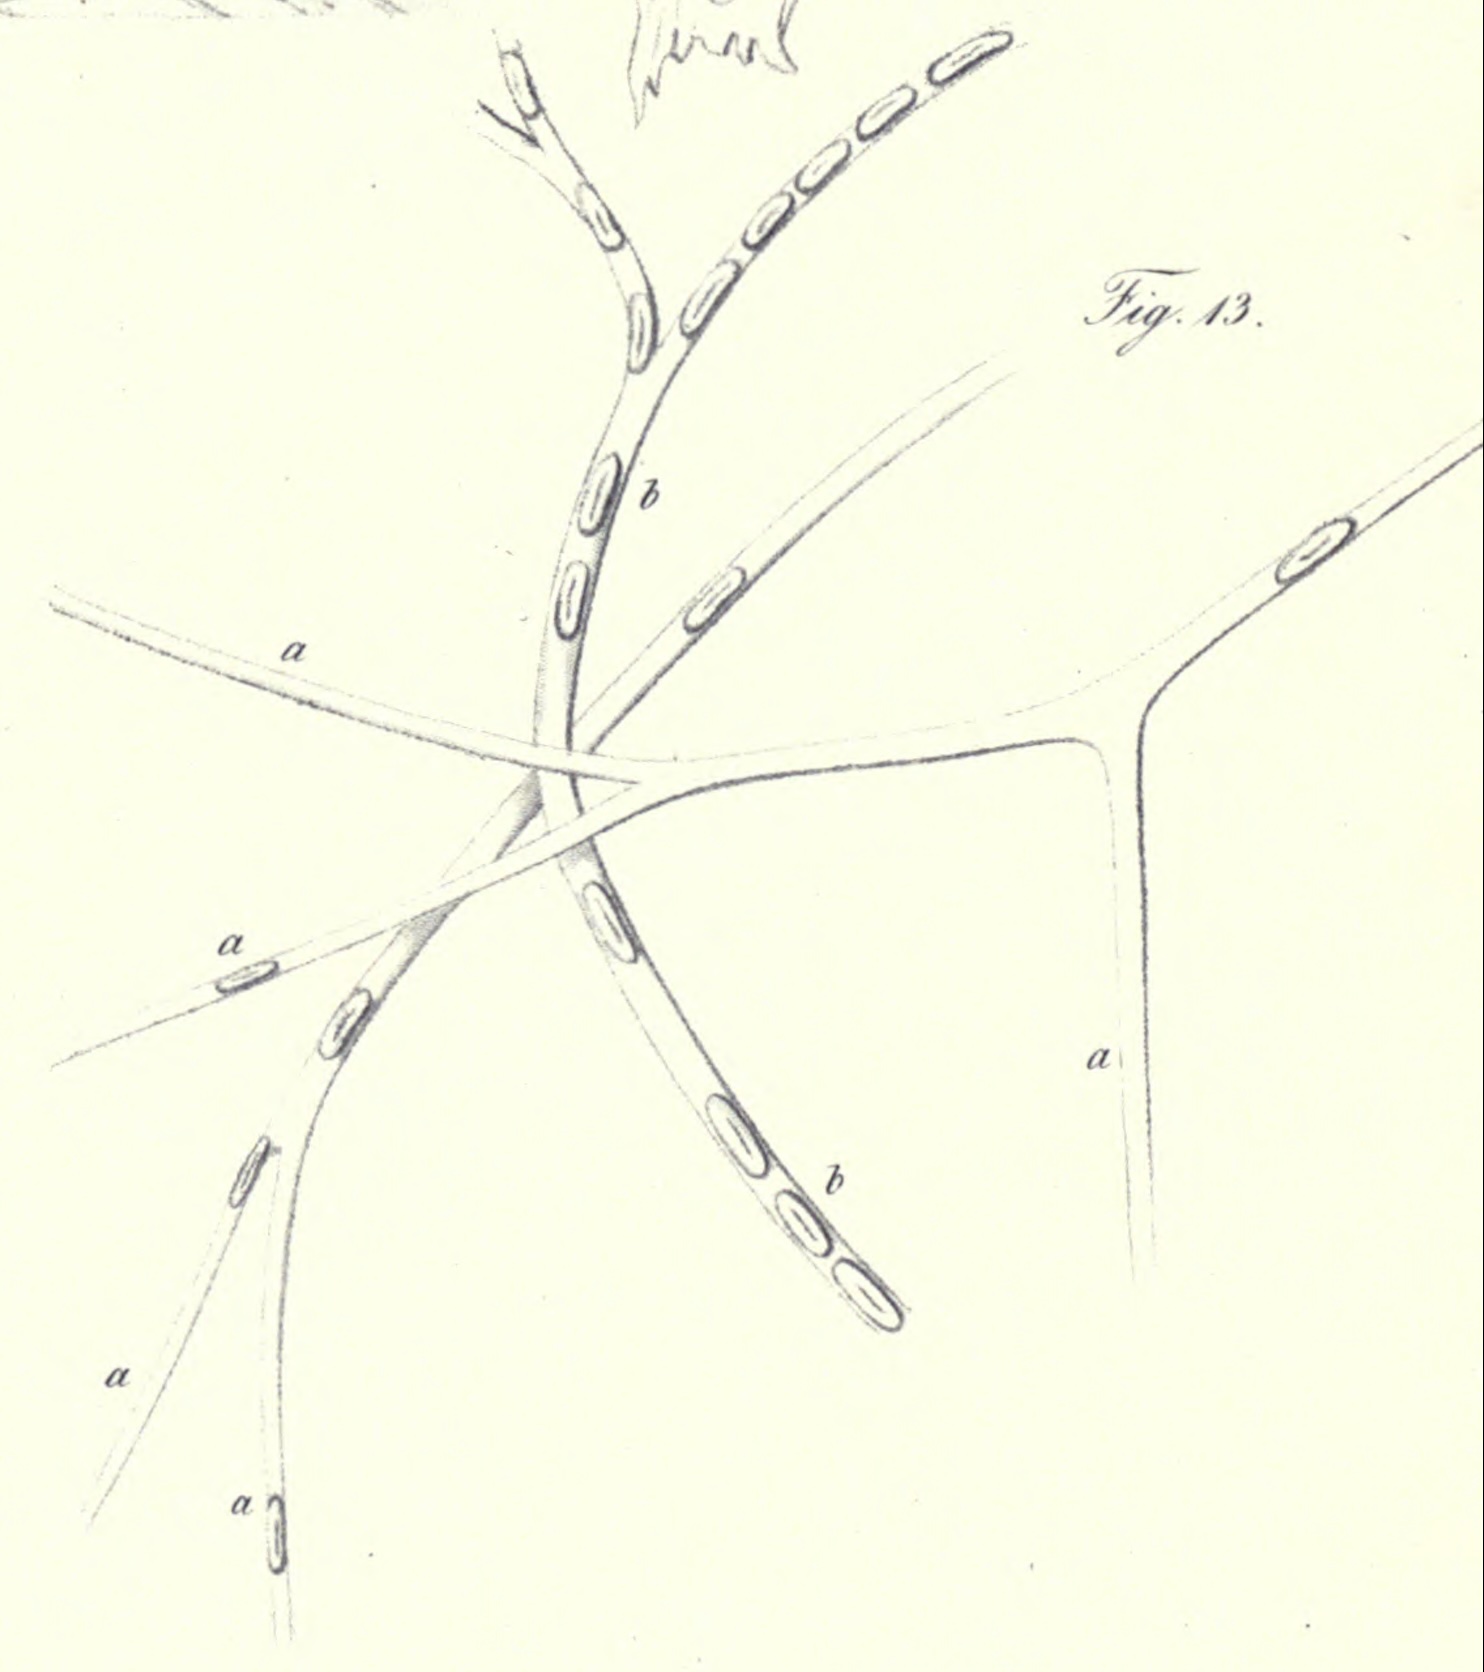
Luschka, 1855 // TAF I FIG 13 // Human capillaries with red blood cells inside.
Bourgery, Jacob, 1844 // TOME 3 PL 27 // Human brain arteries and veins from sagittal viewpoint.
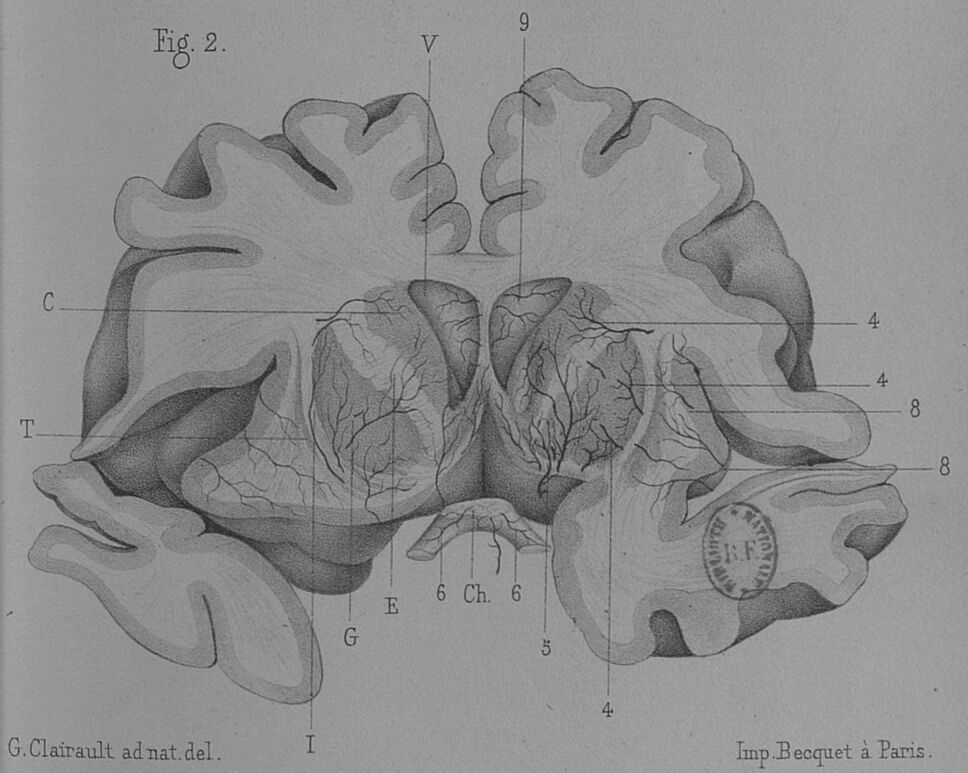
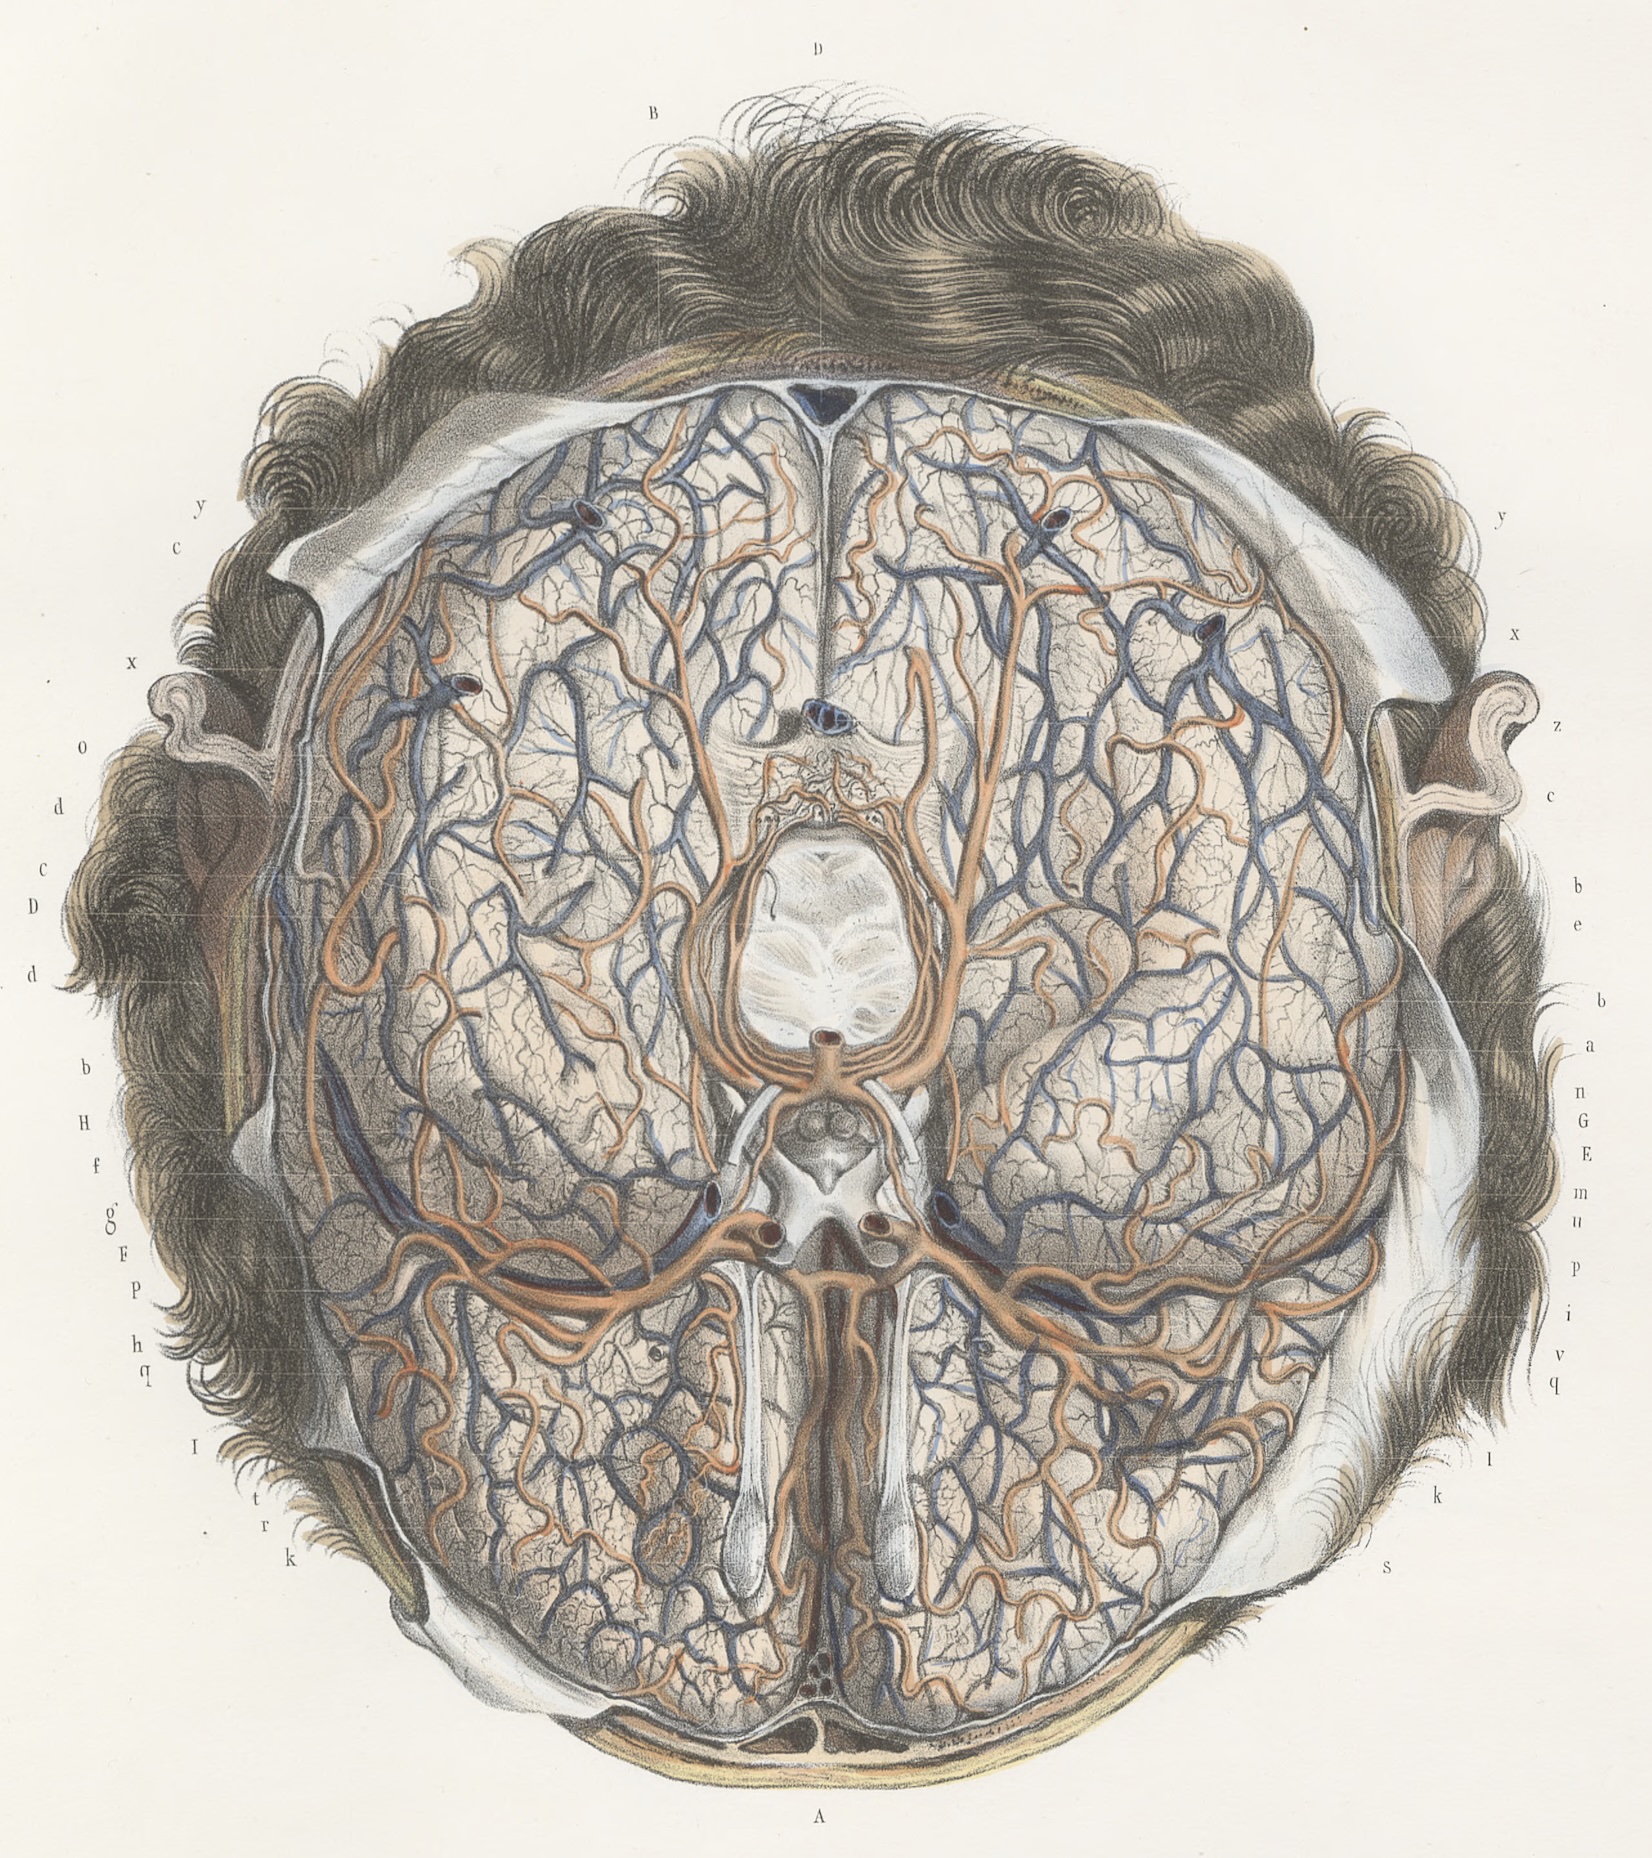
Bourgery, Jacob, 1844 // TOME 3 PL 29 // Human brain arteries and veins from inferior viewpoint.
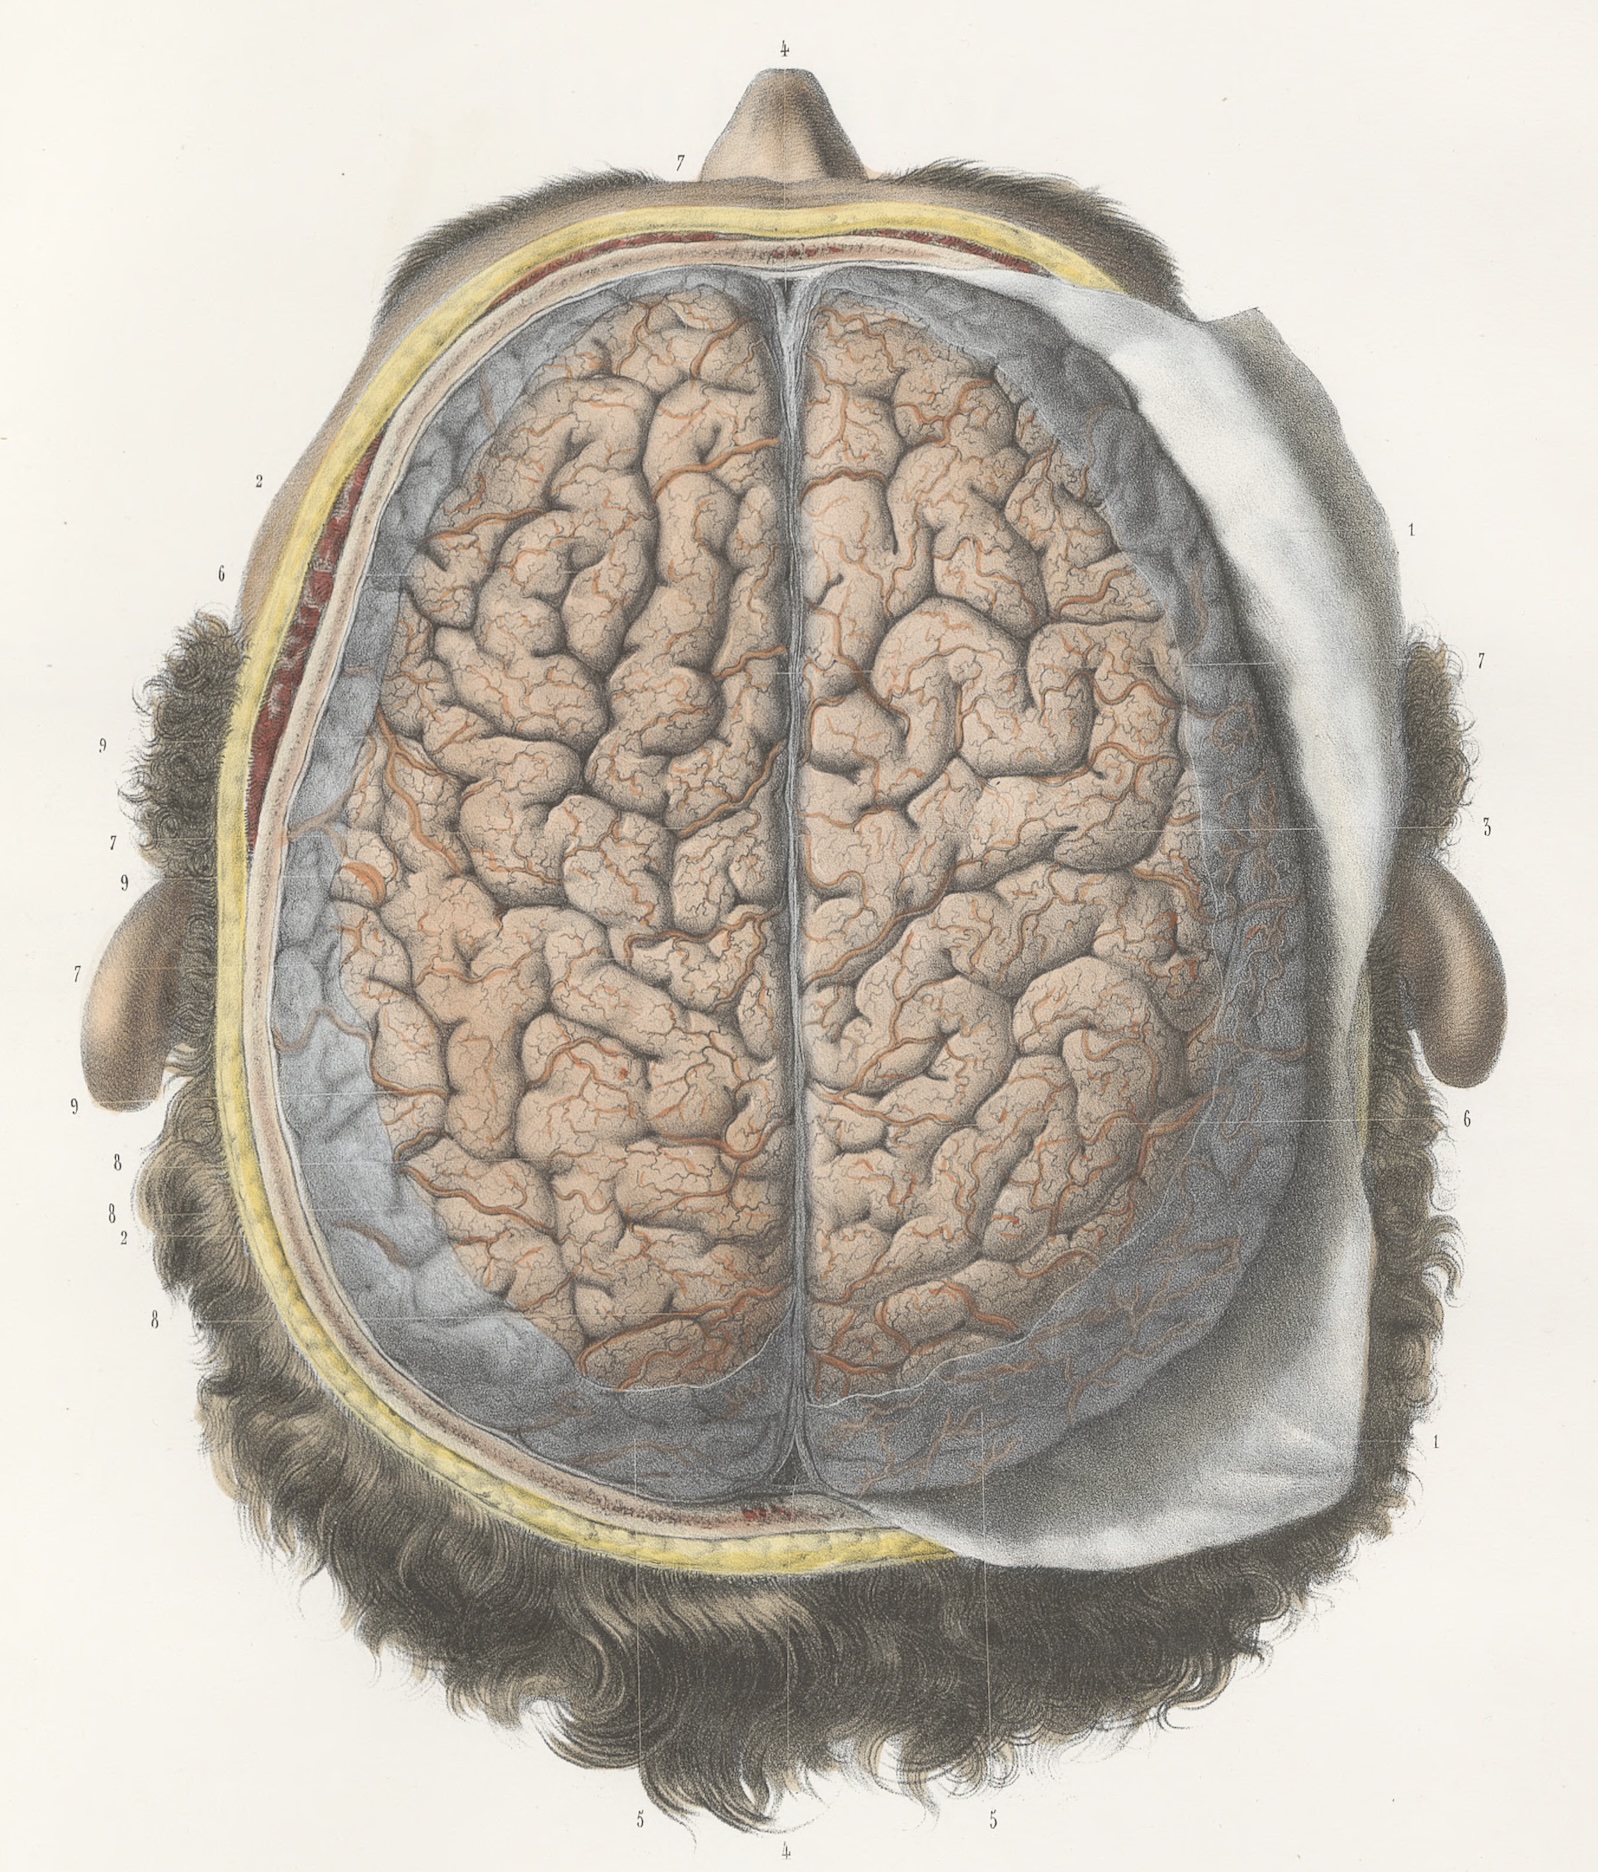
Bourgery, Jacob, 1844 // TOME 3 PL 30 // Human brain arteries from superior viewpoint.
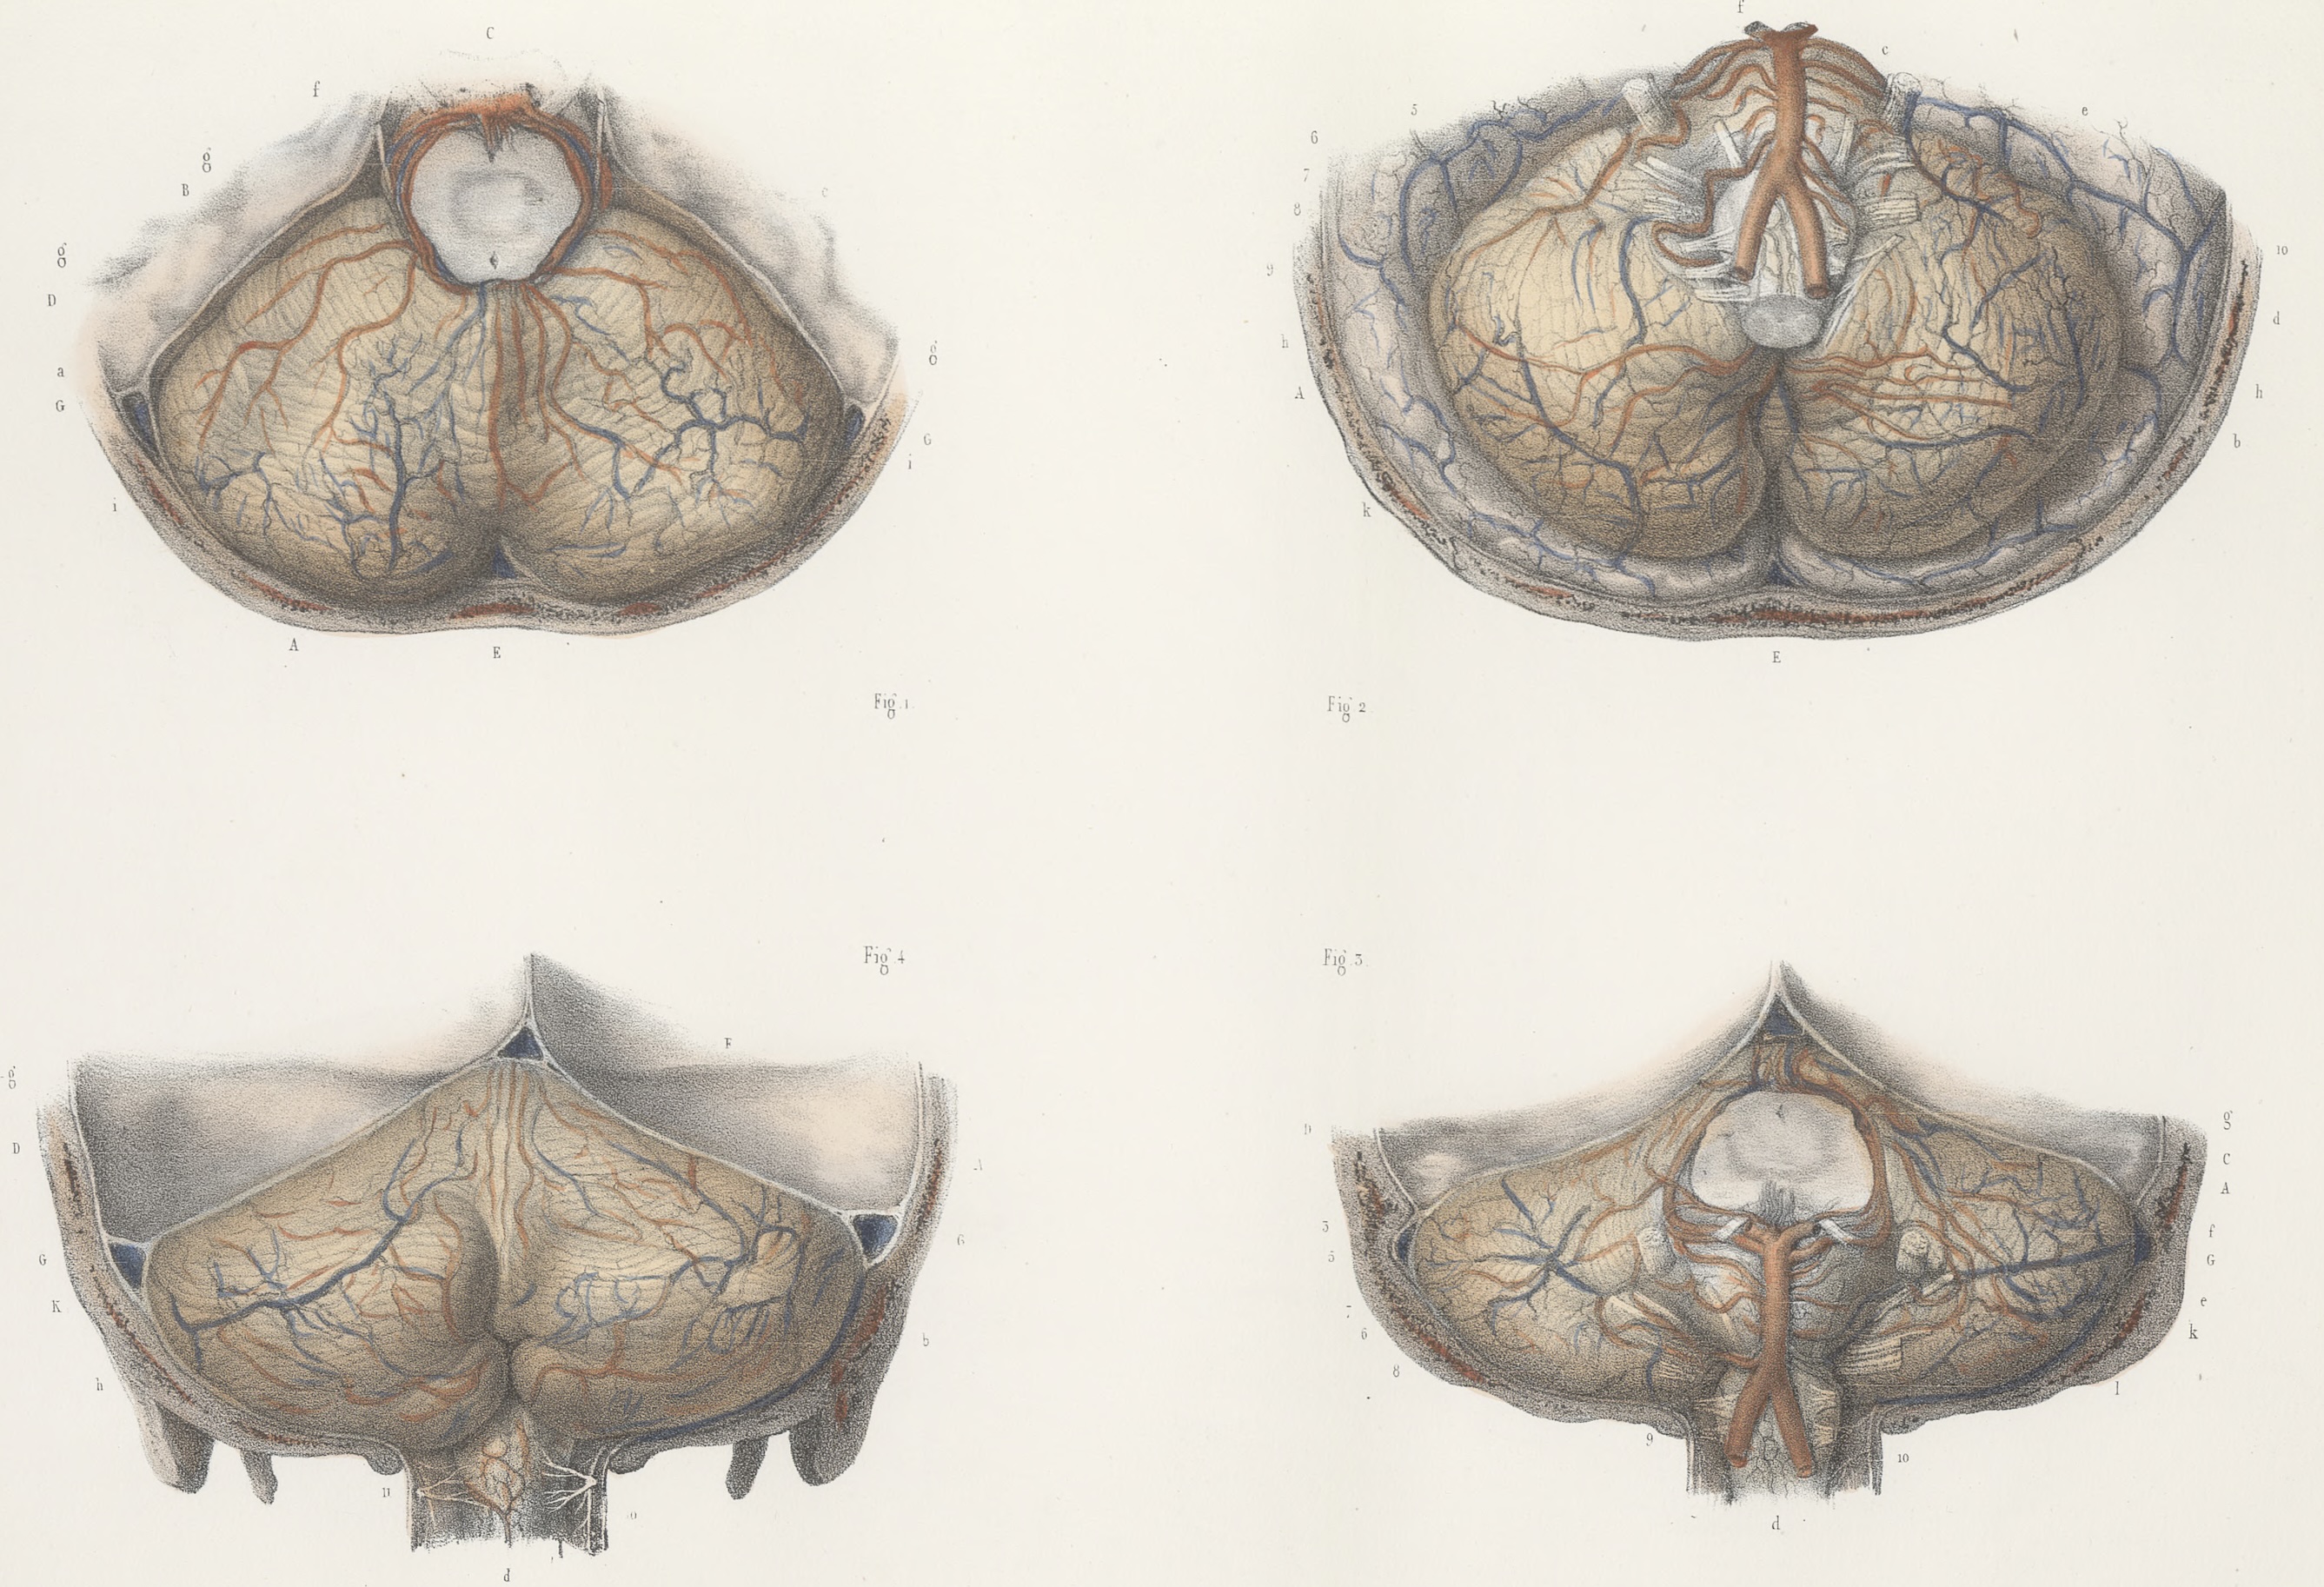
Bourgery, Jacob, 1844 // TOME 3 PL 35 // Human cerebellum arteries and veins from multiple viewpoints.
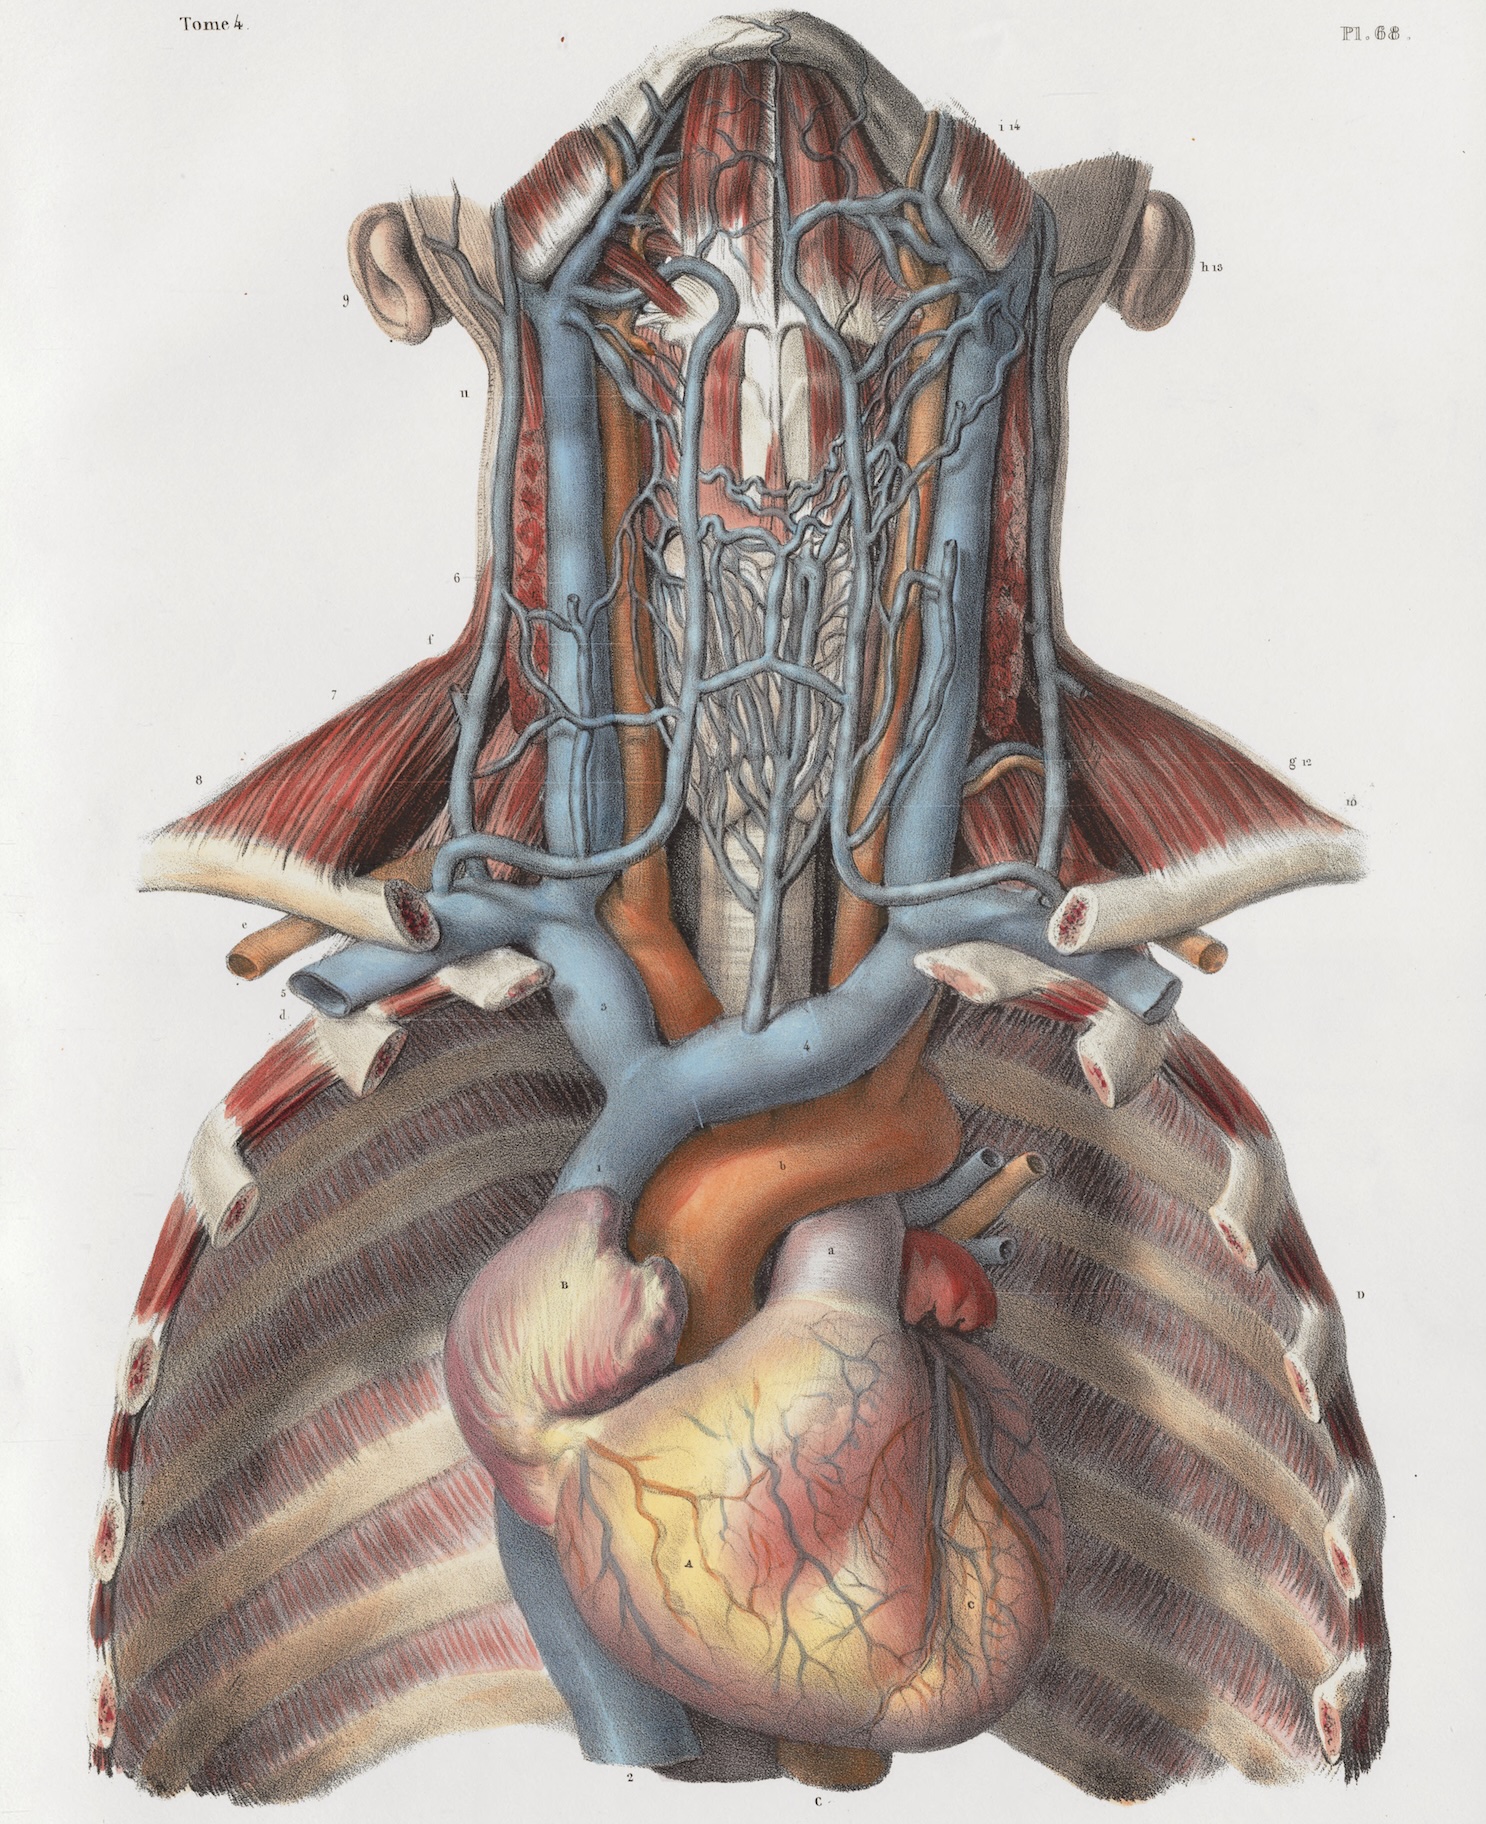
Bourgery, Jacob, 1844 // TOME 4 PL 68 // Human arteries and veins that connect the head to the heart.
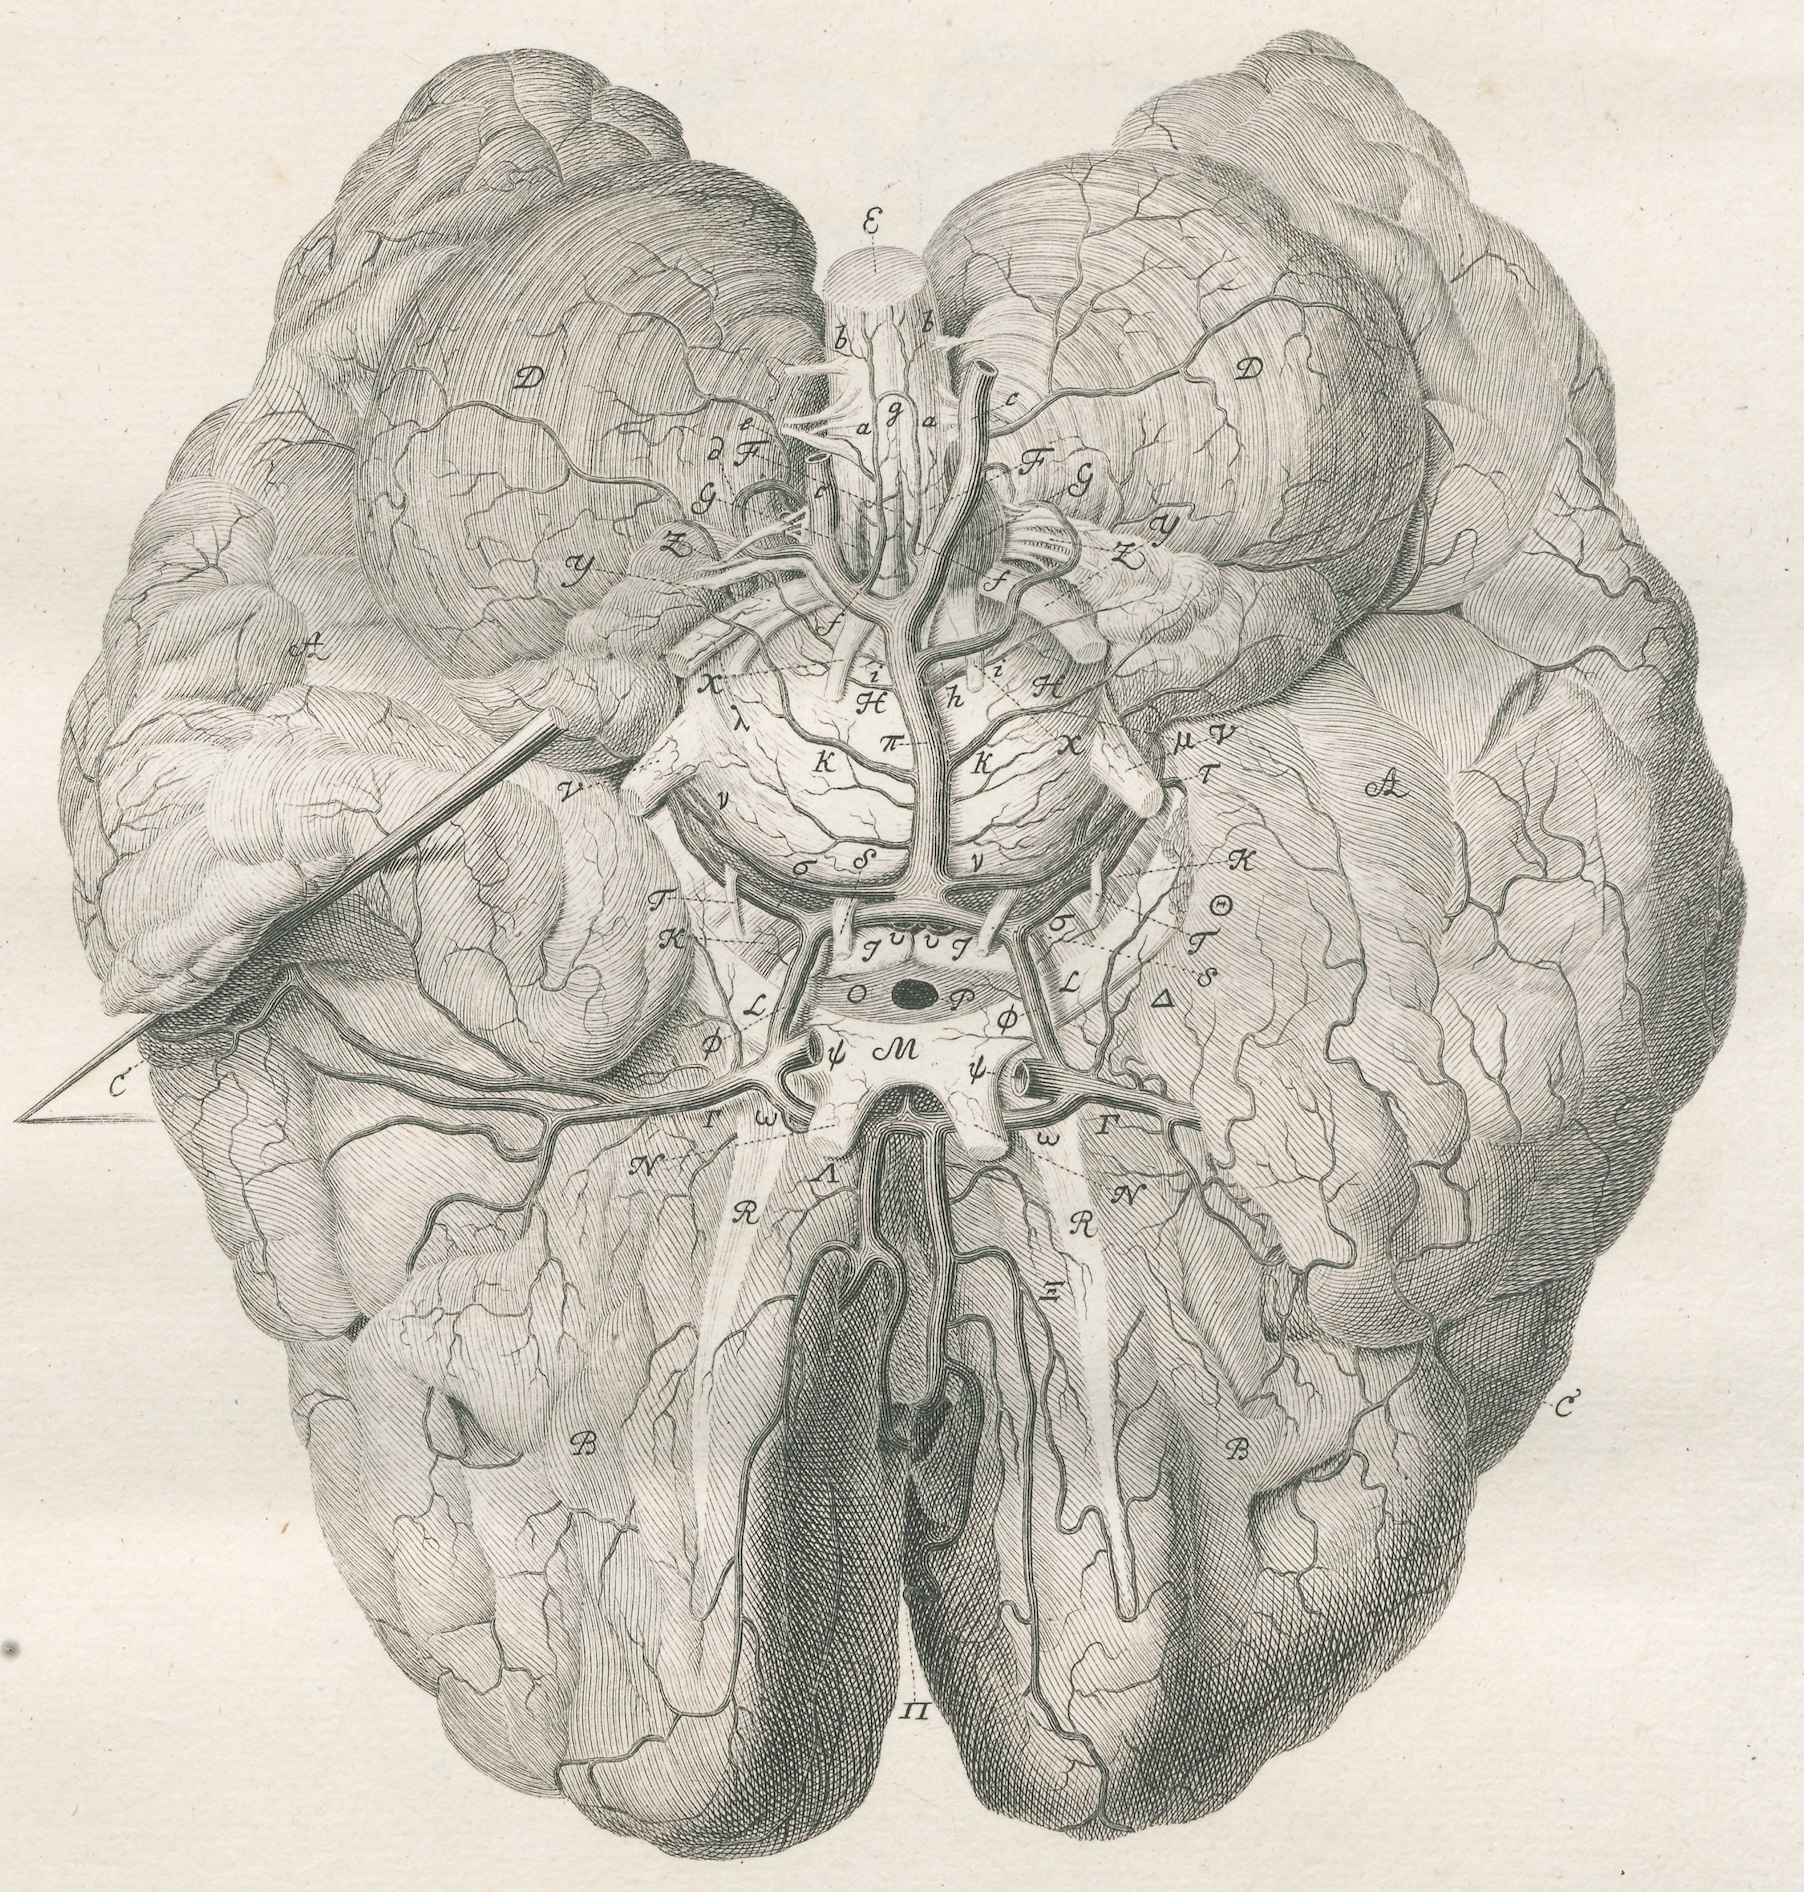
Haller, 1781 // TAB I // Human macro- and meso-vessels at the base of the brain.
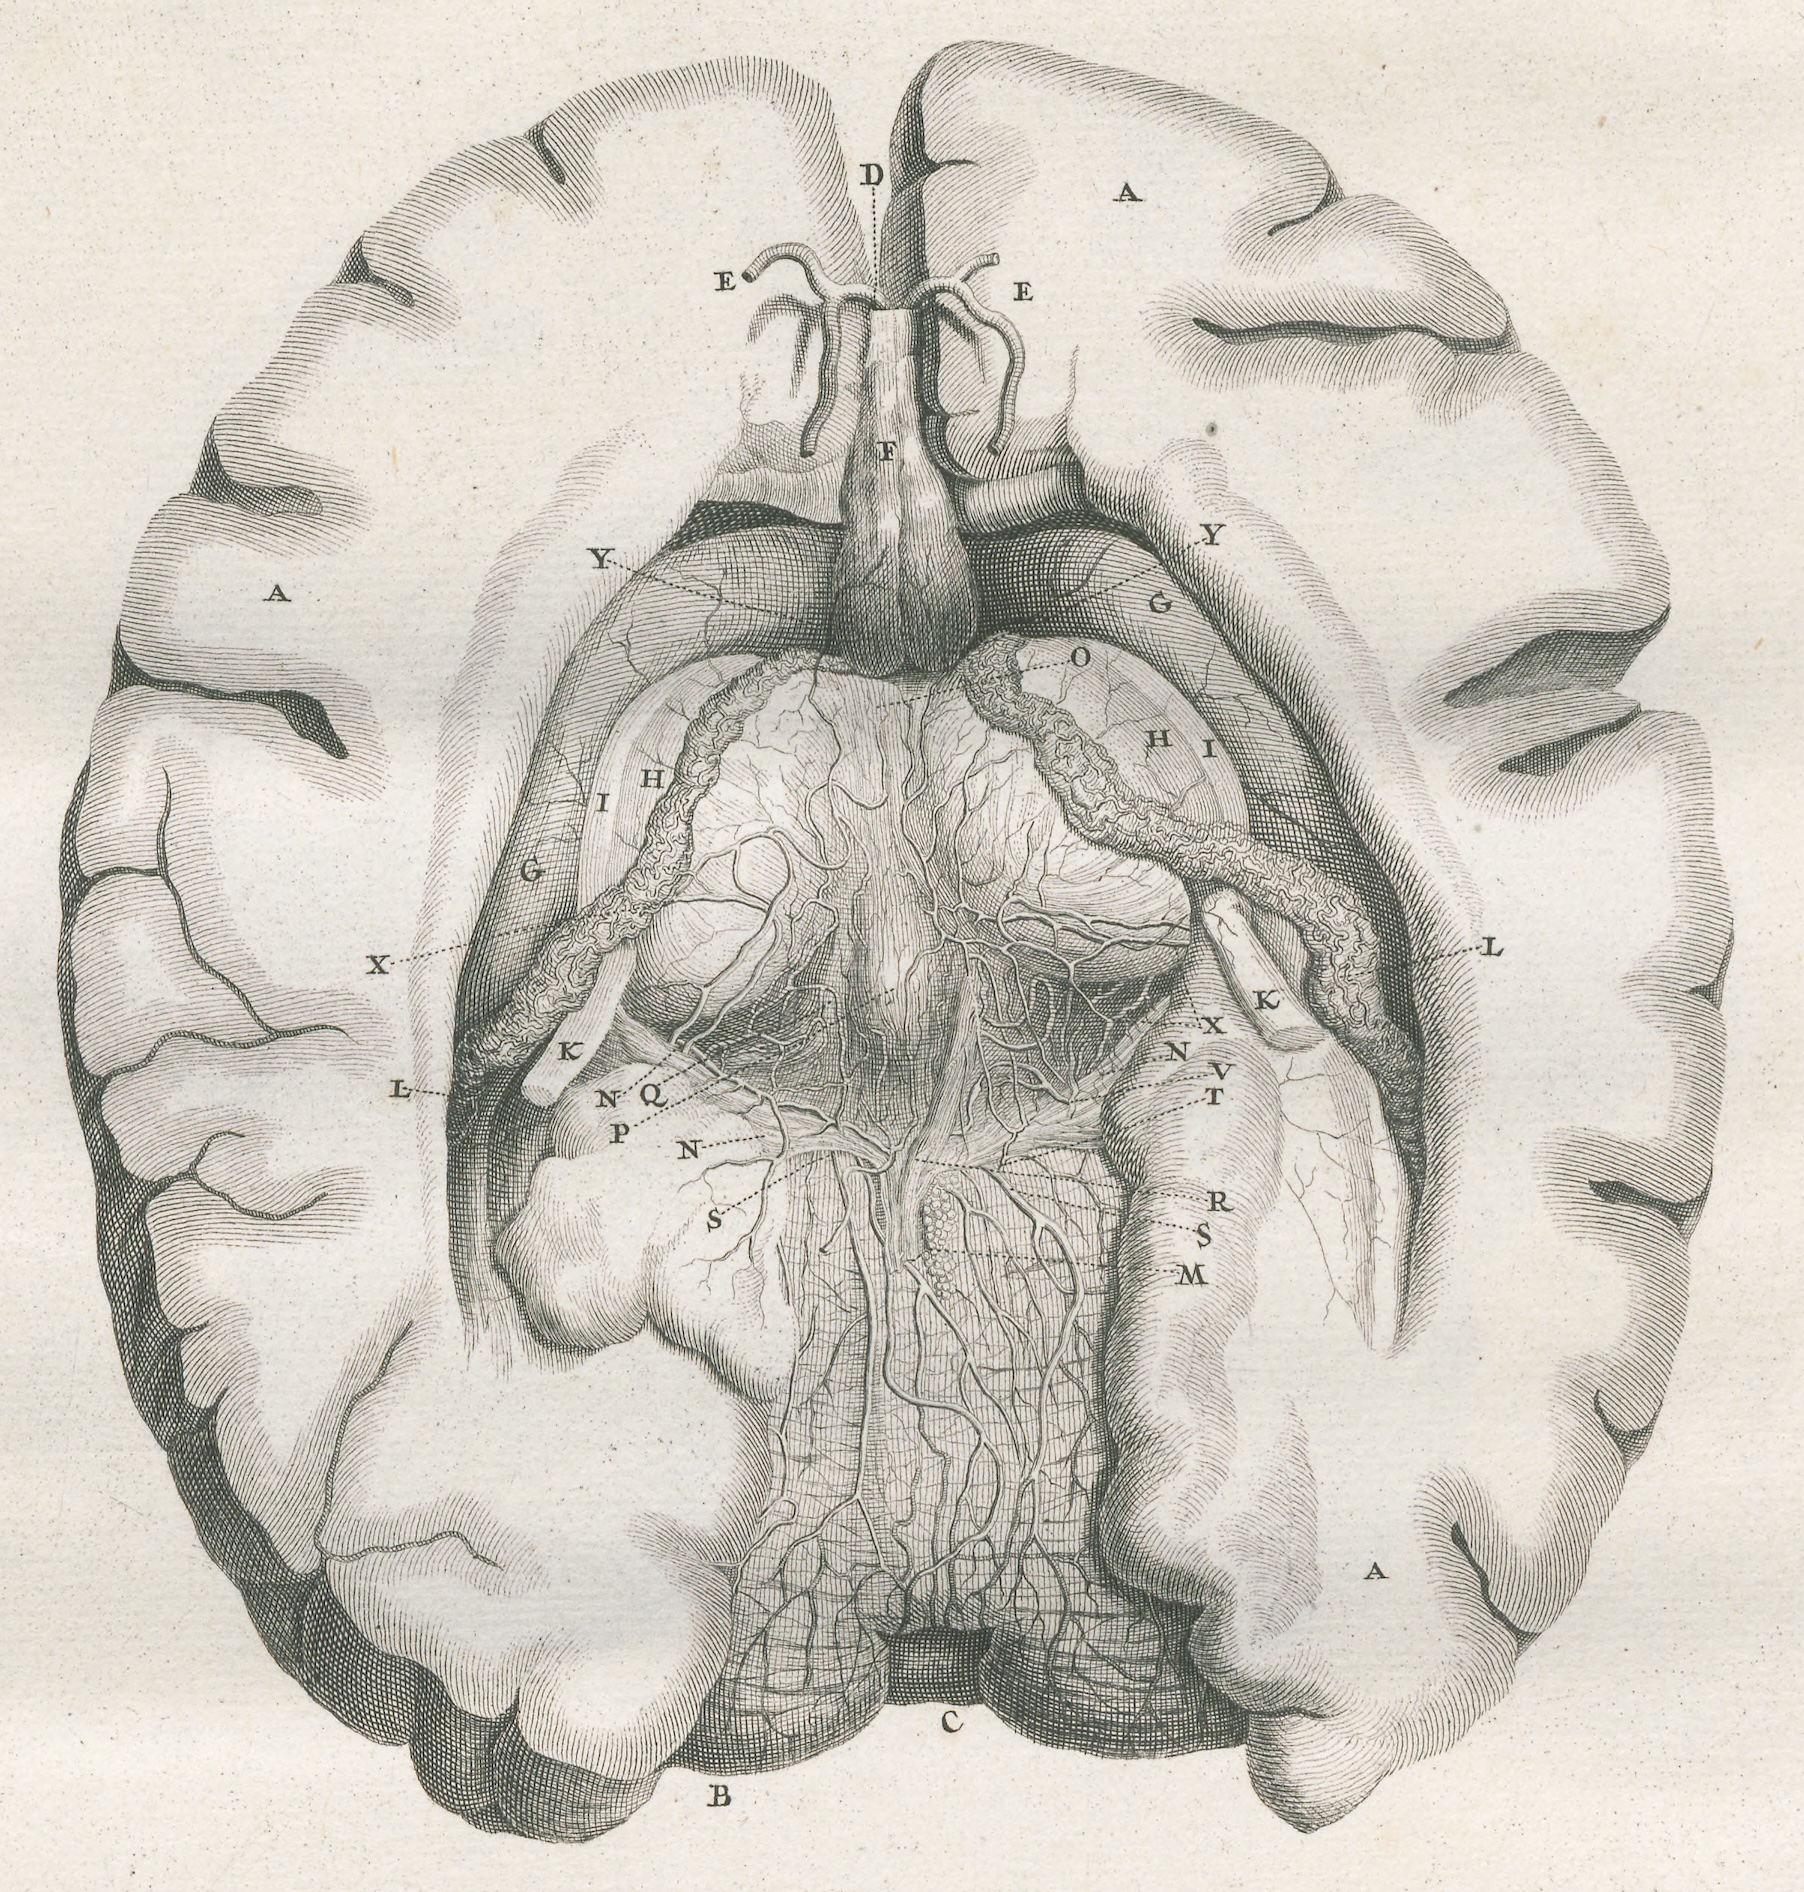
Haller, 1781 // TAB II // Human macro- and meso-vessels at subcortex.
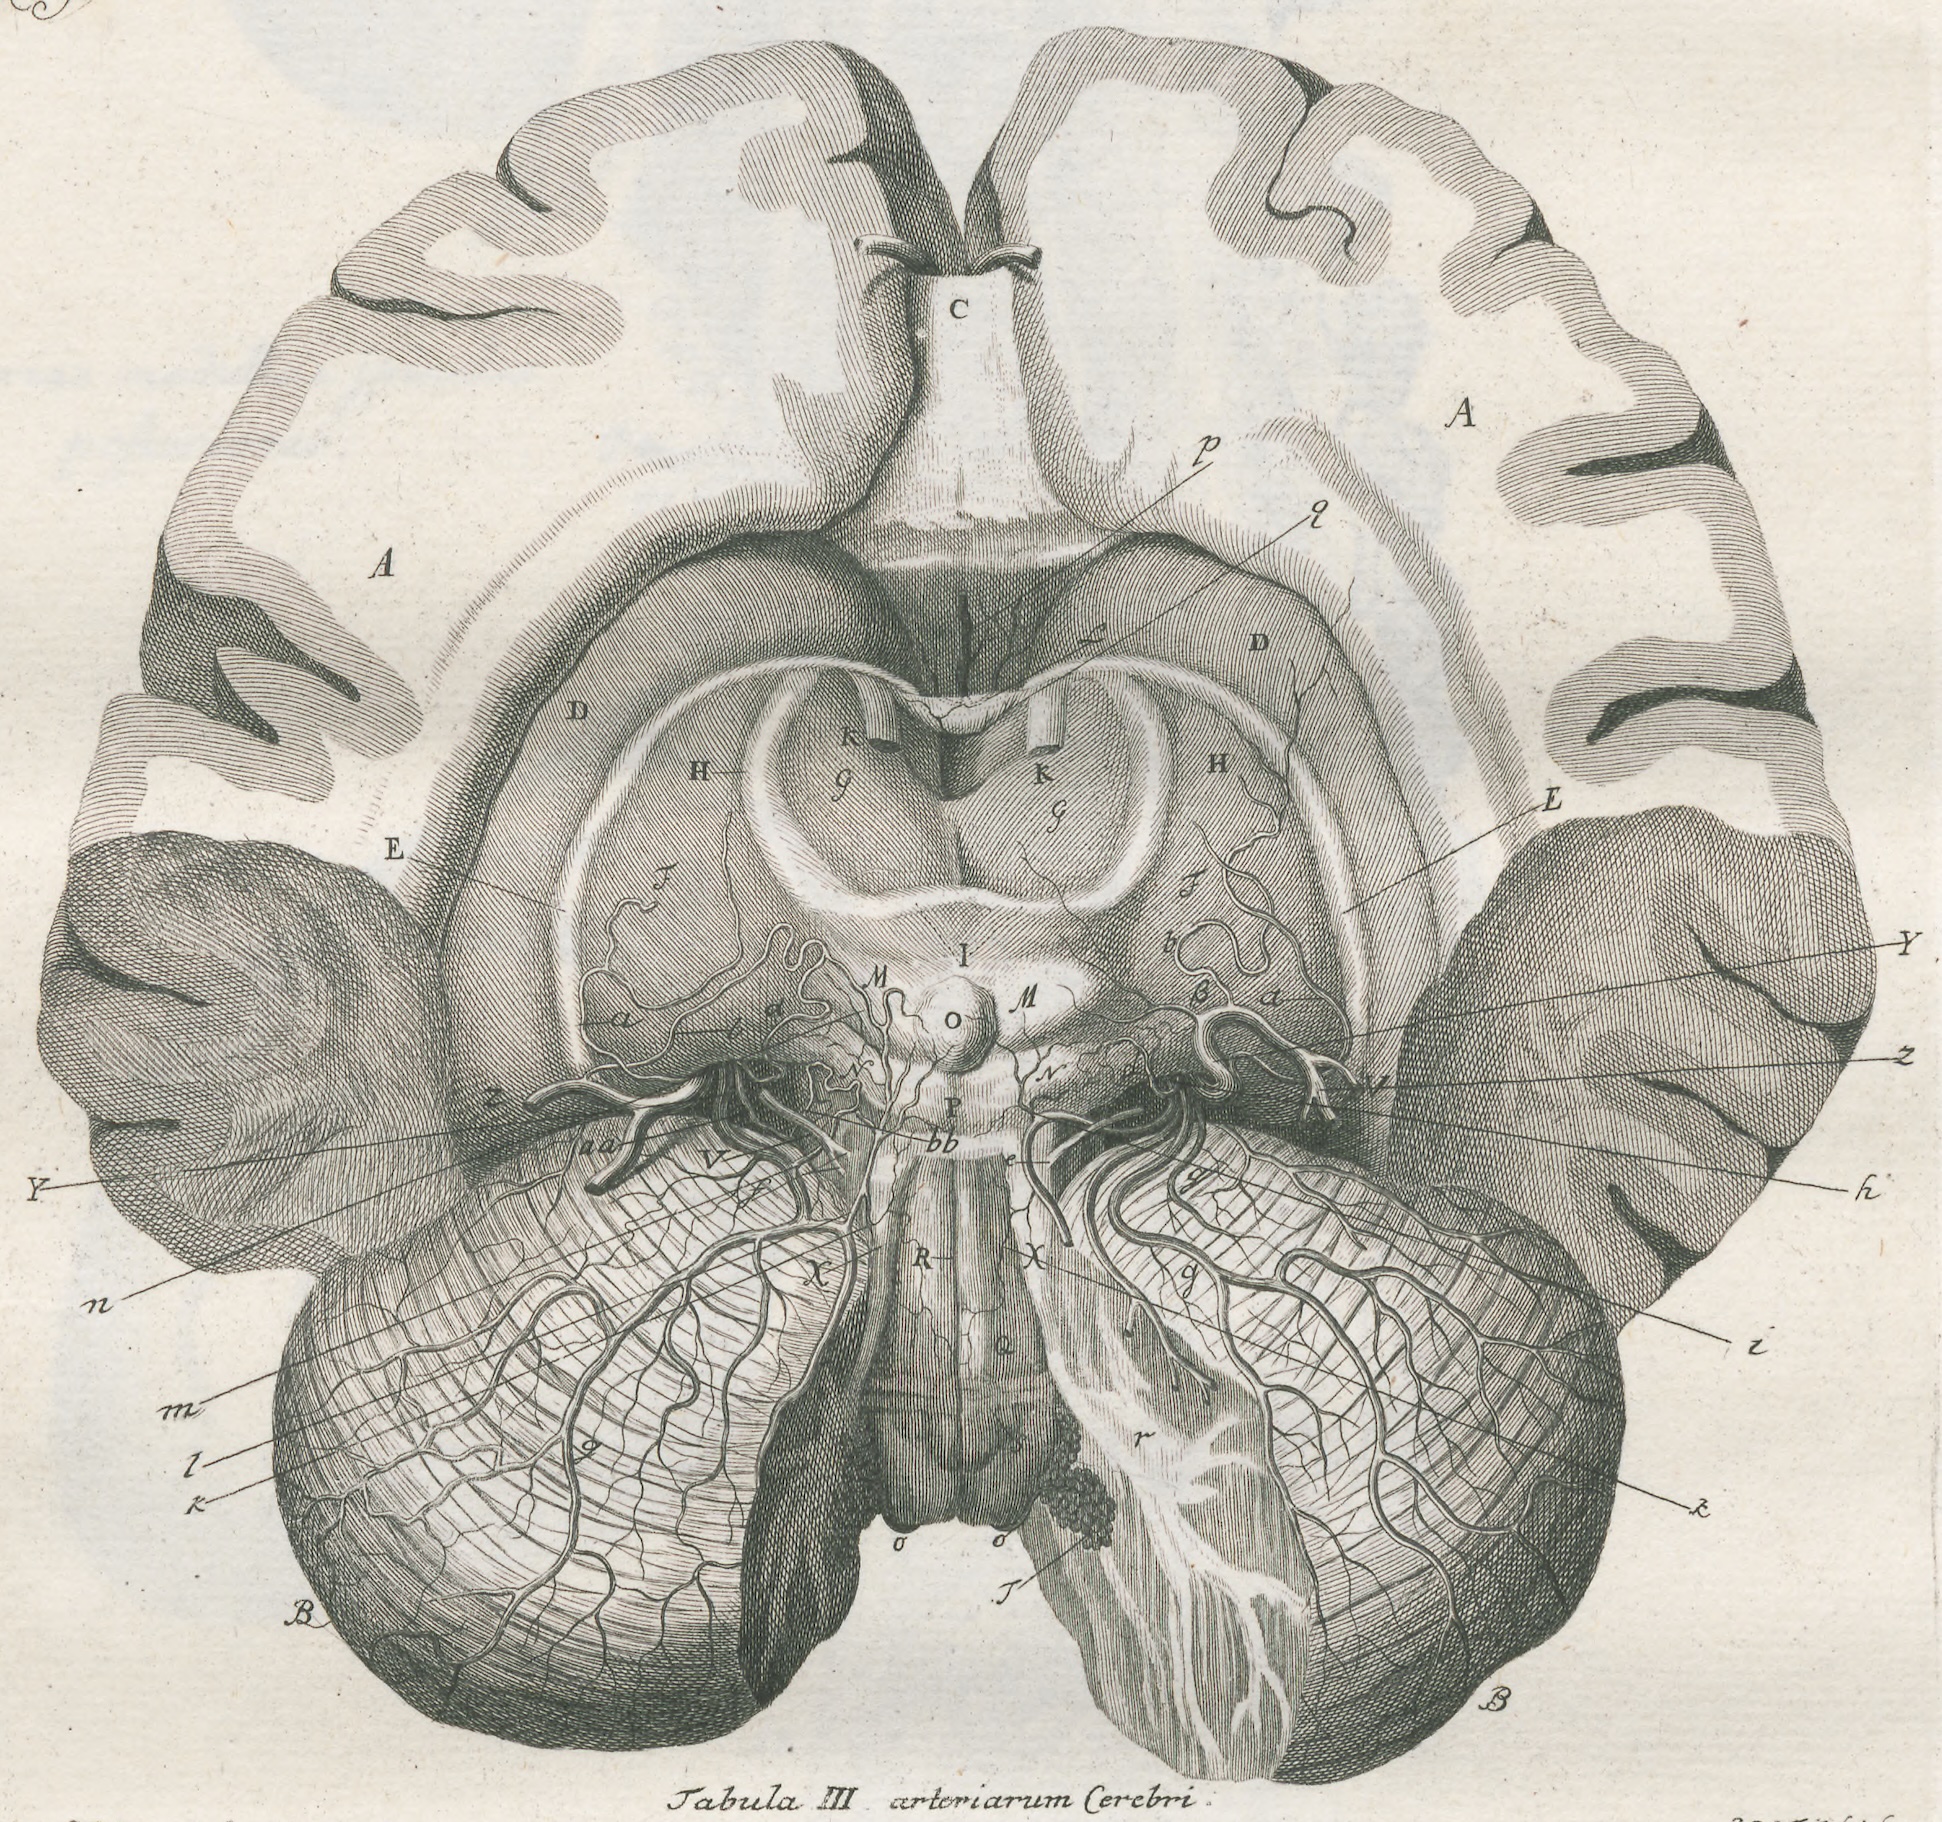
Haller, 1781 // TAB III // Human macro- and meso-vessels at cerebellum.
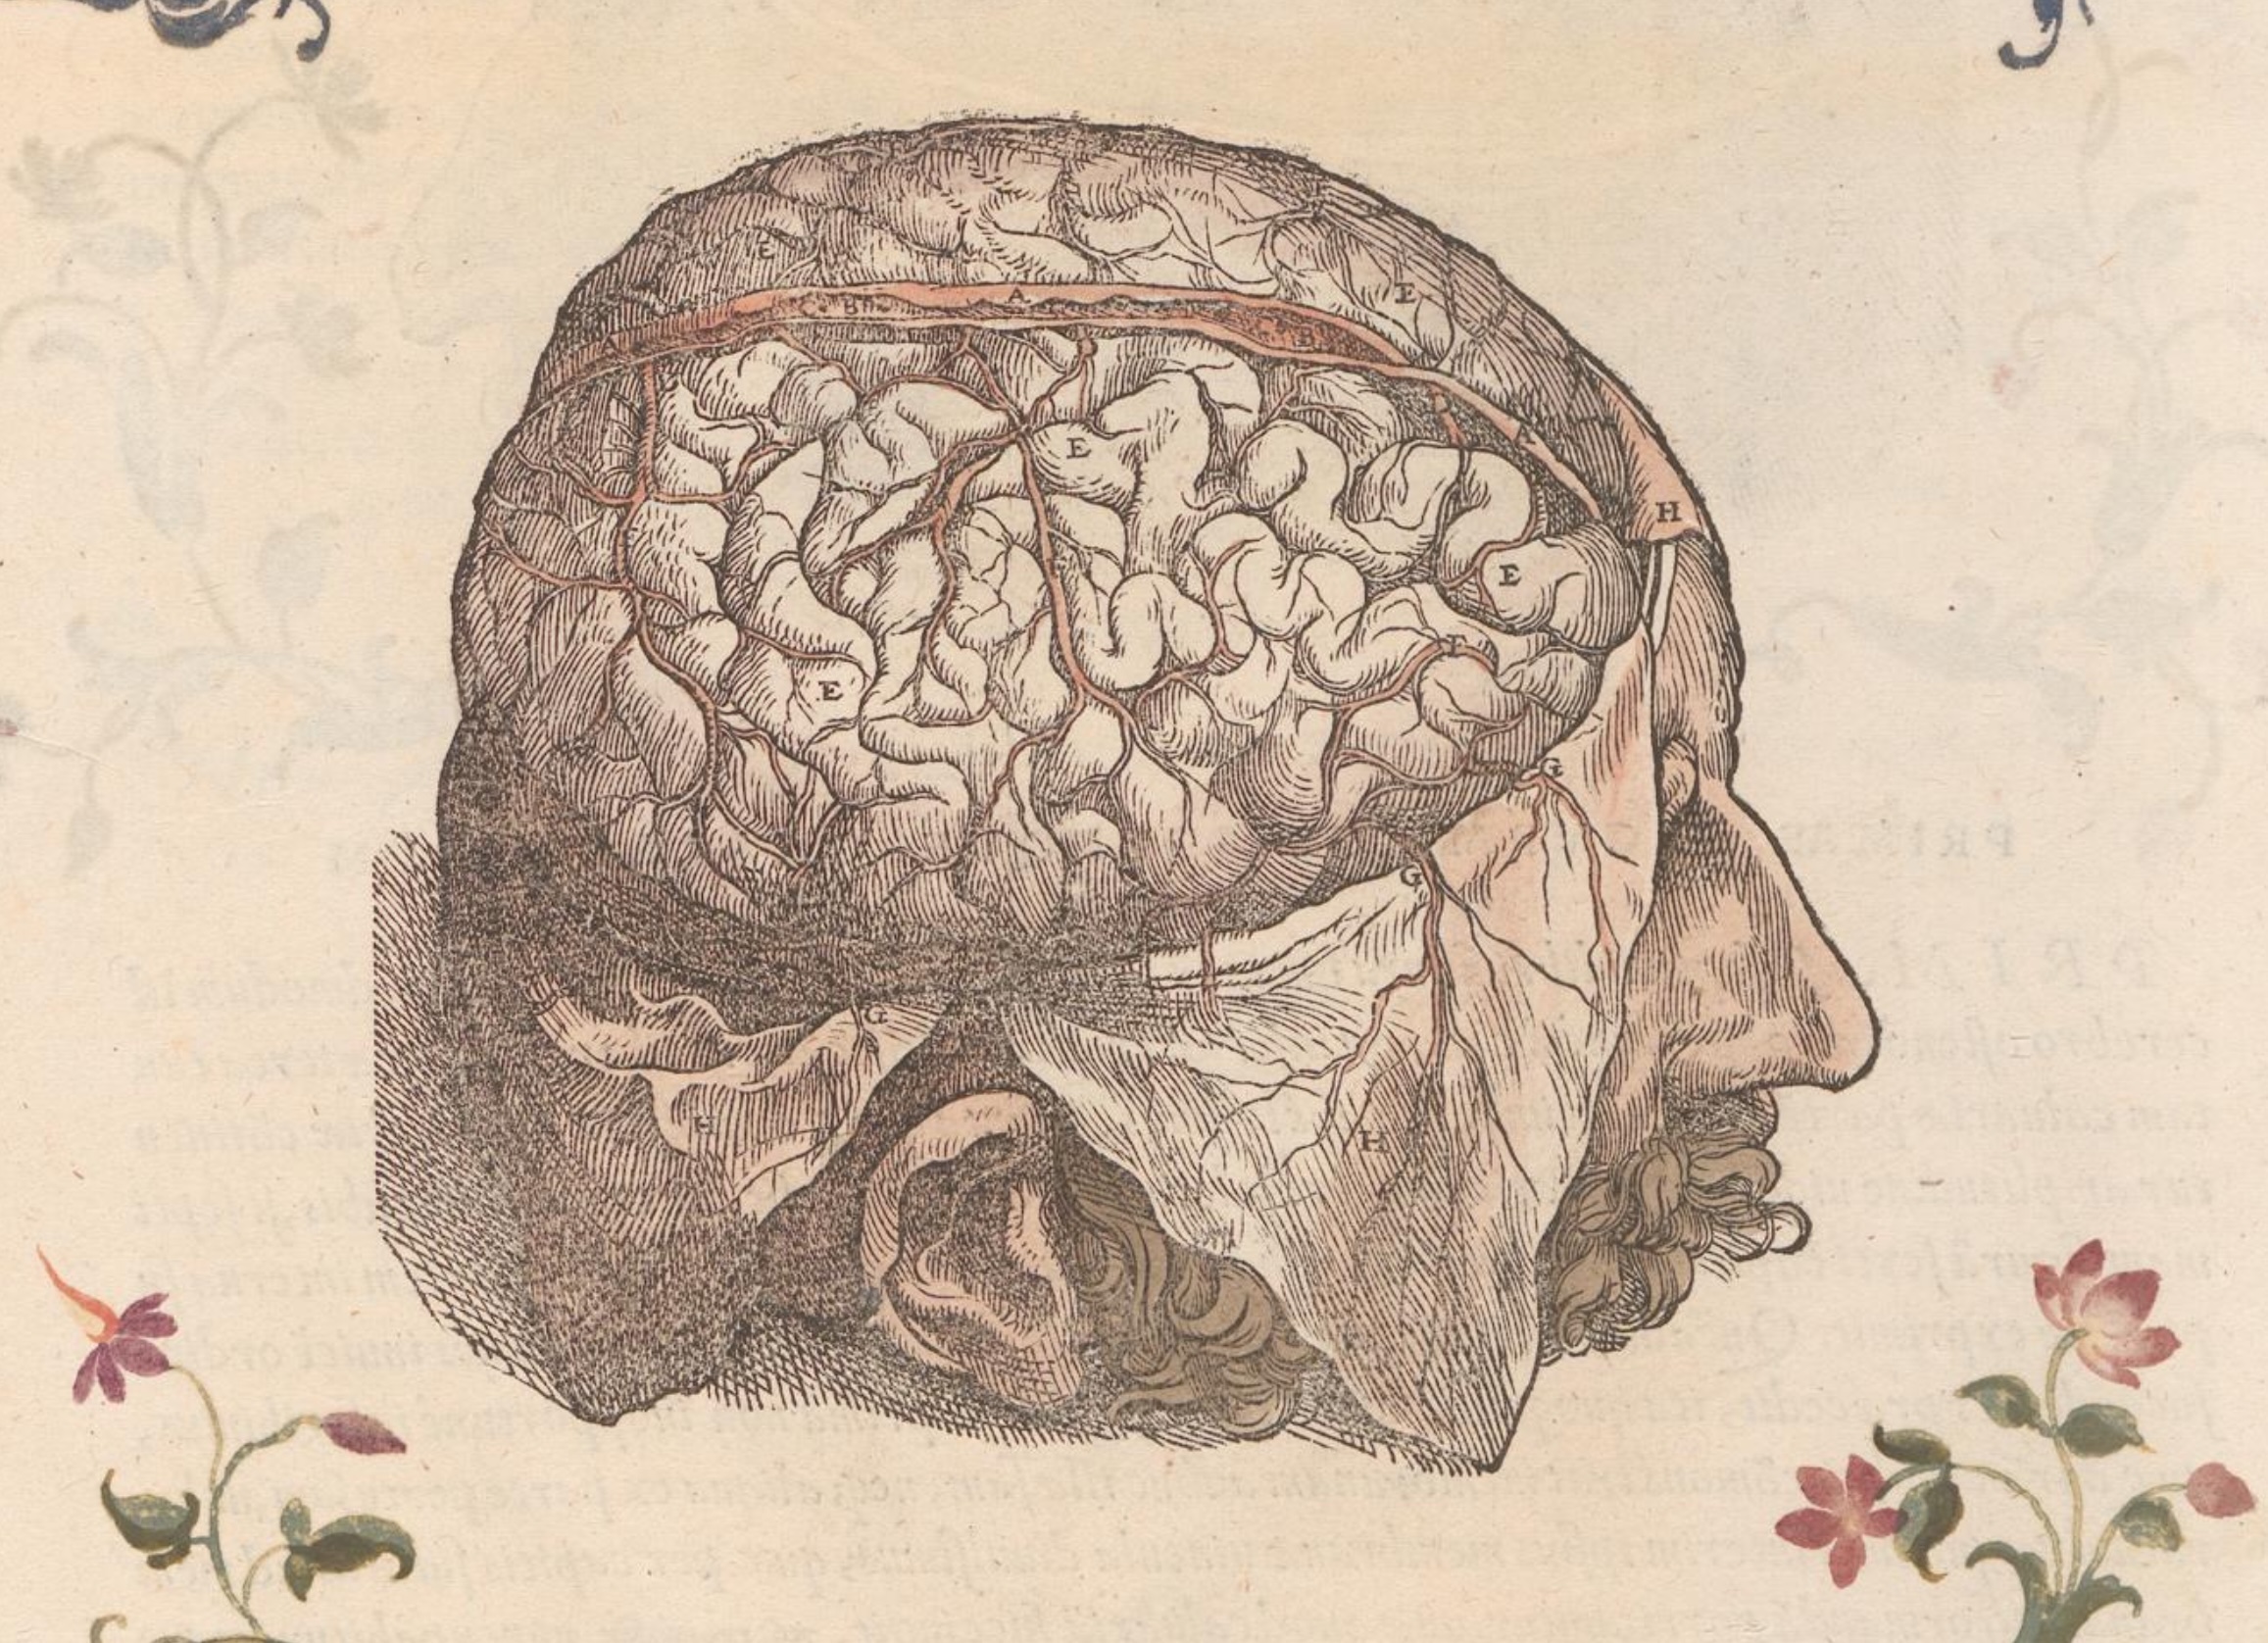
Vesalius, 1514 // PAGE 606 // Vessels beneath the dura mater.
doi.org/10.3931/e-rara-20094
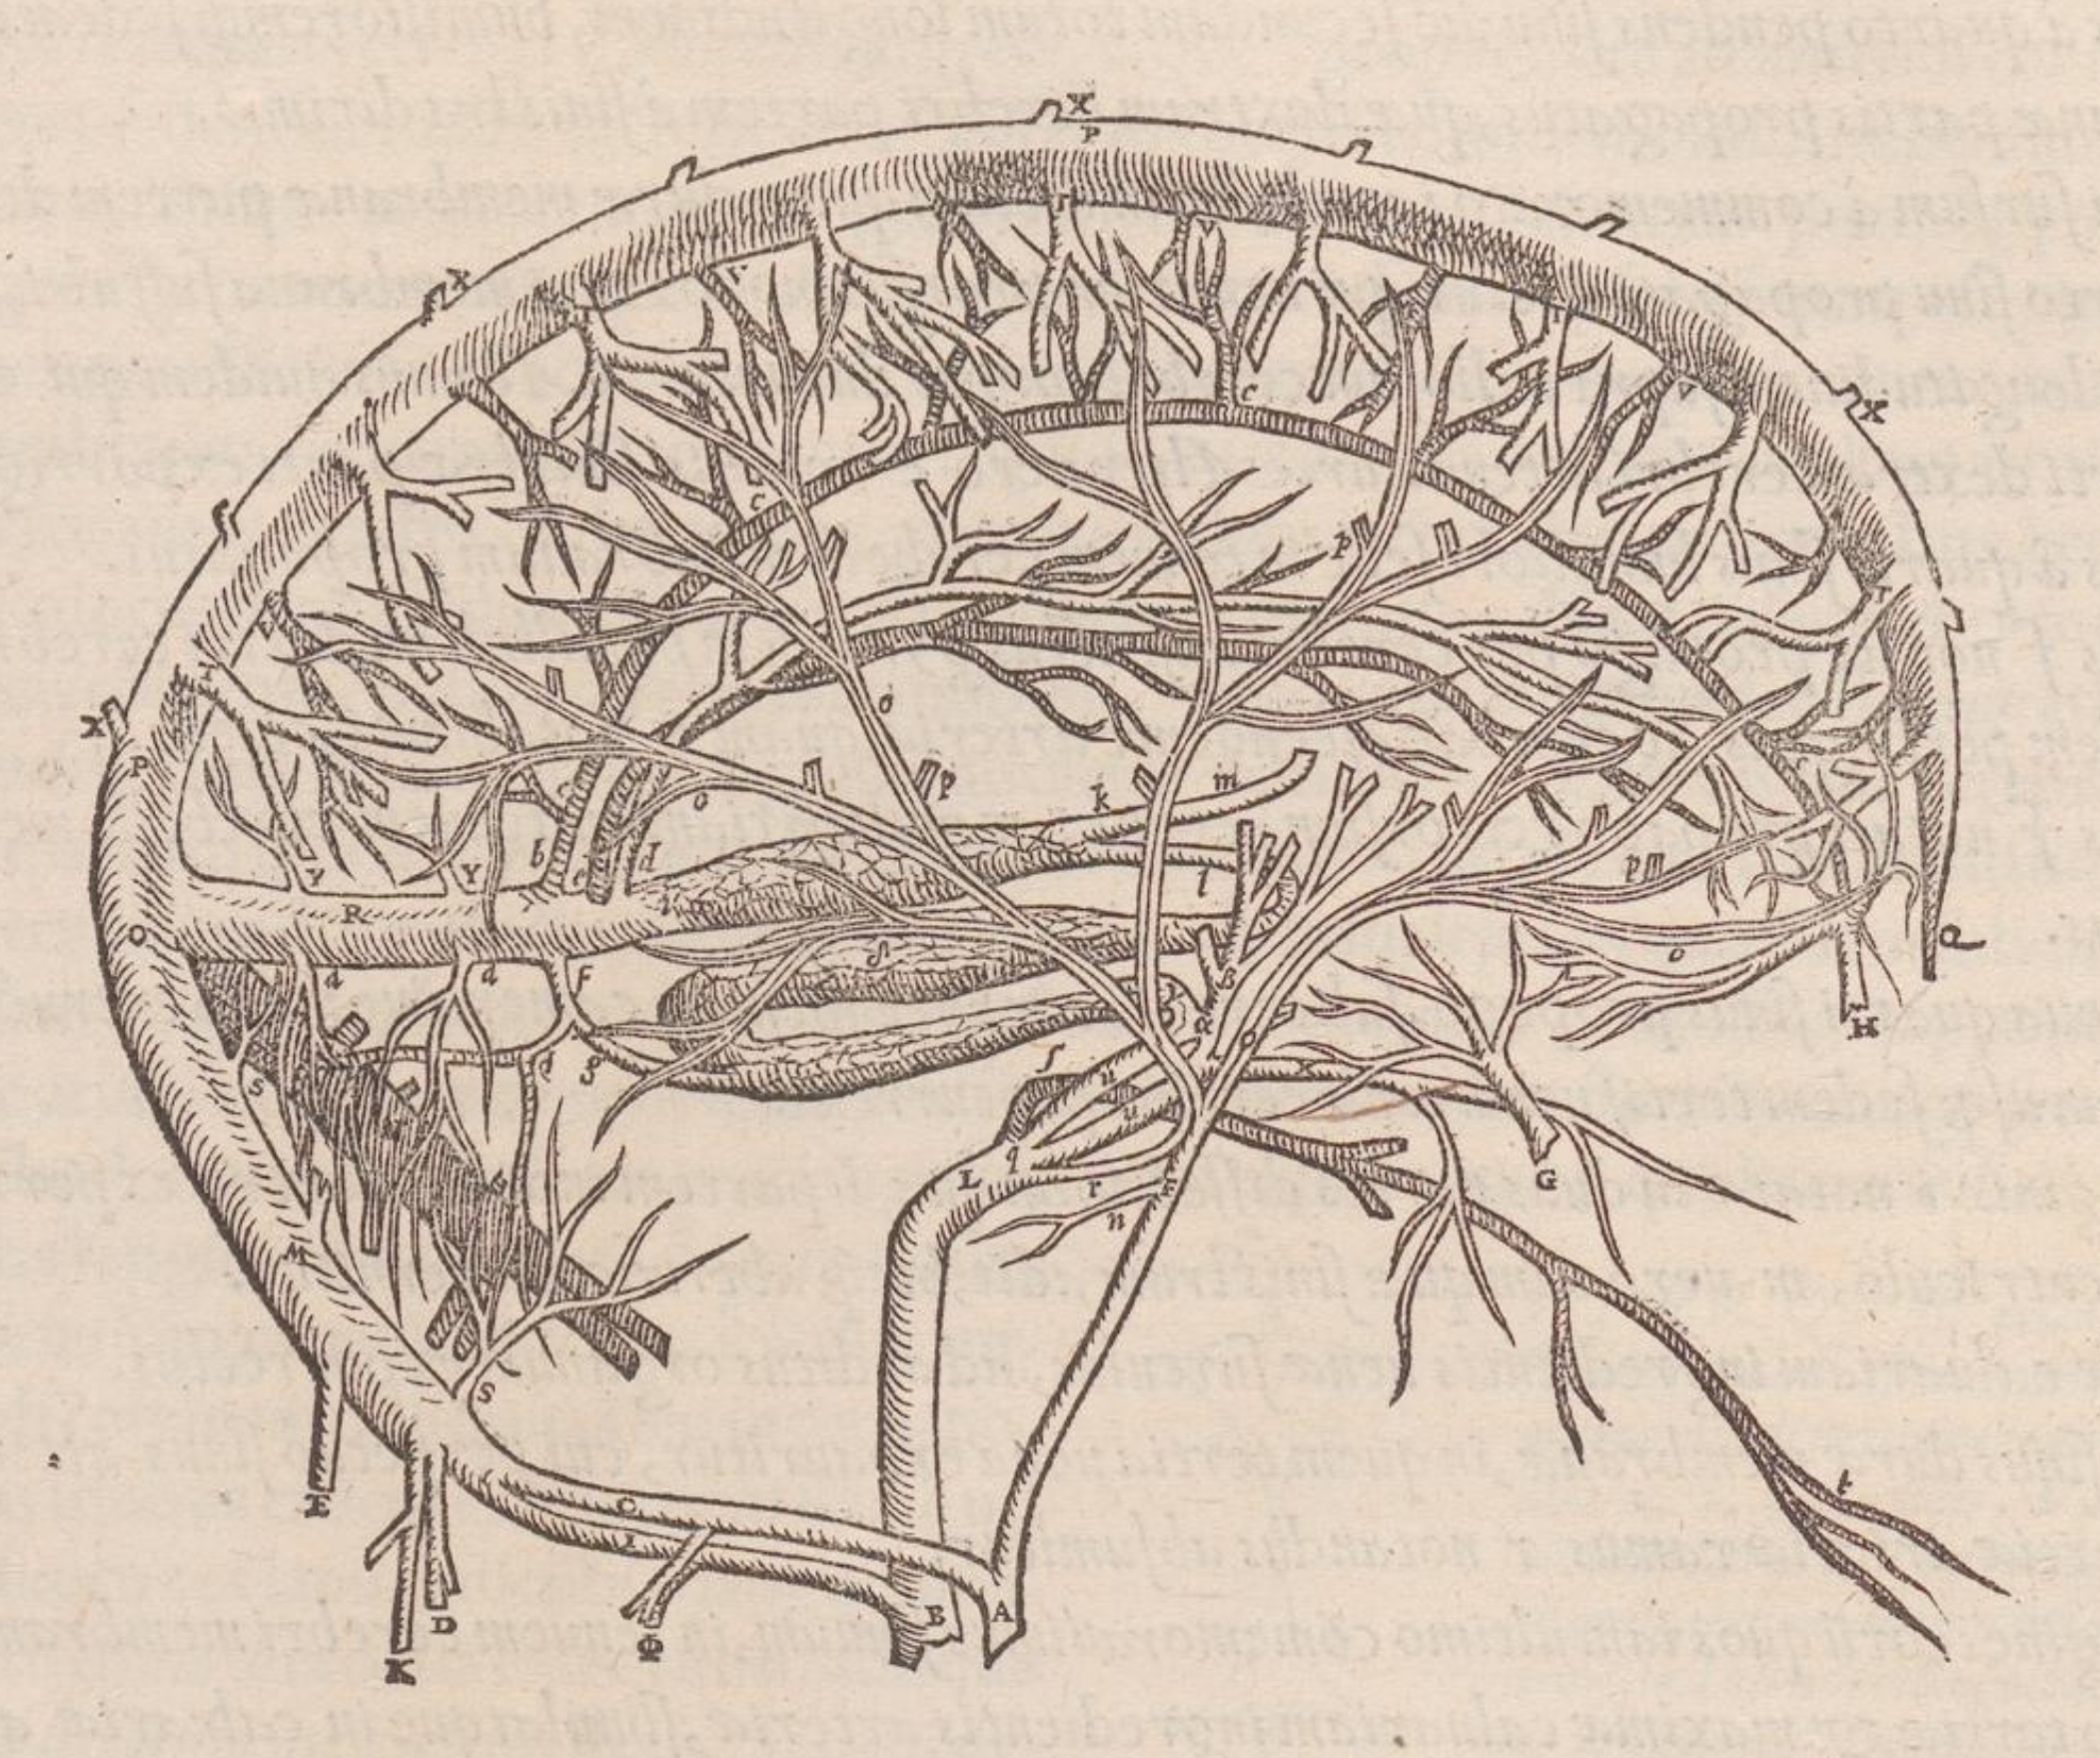
Vesalius, 1514 // PAGE 305 // Vessels of the human brain.
doi.org/10.3931/e-rara-20094
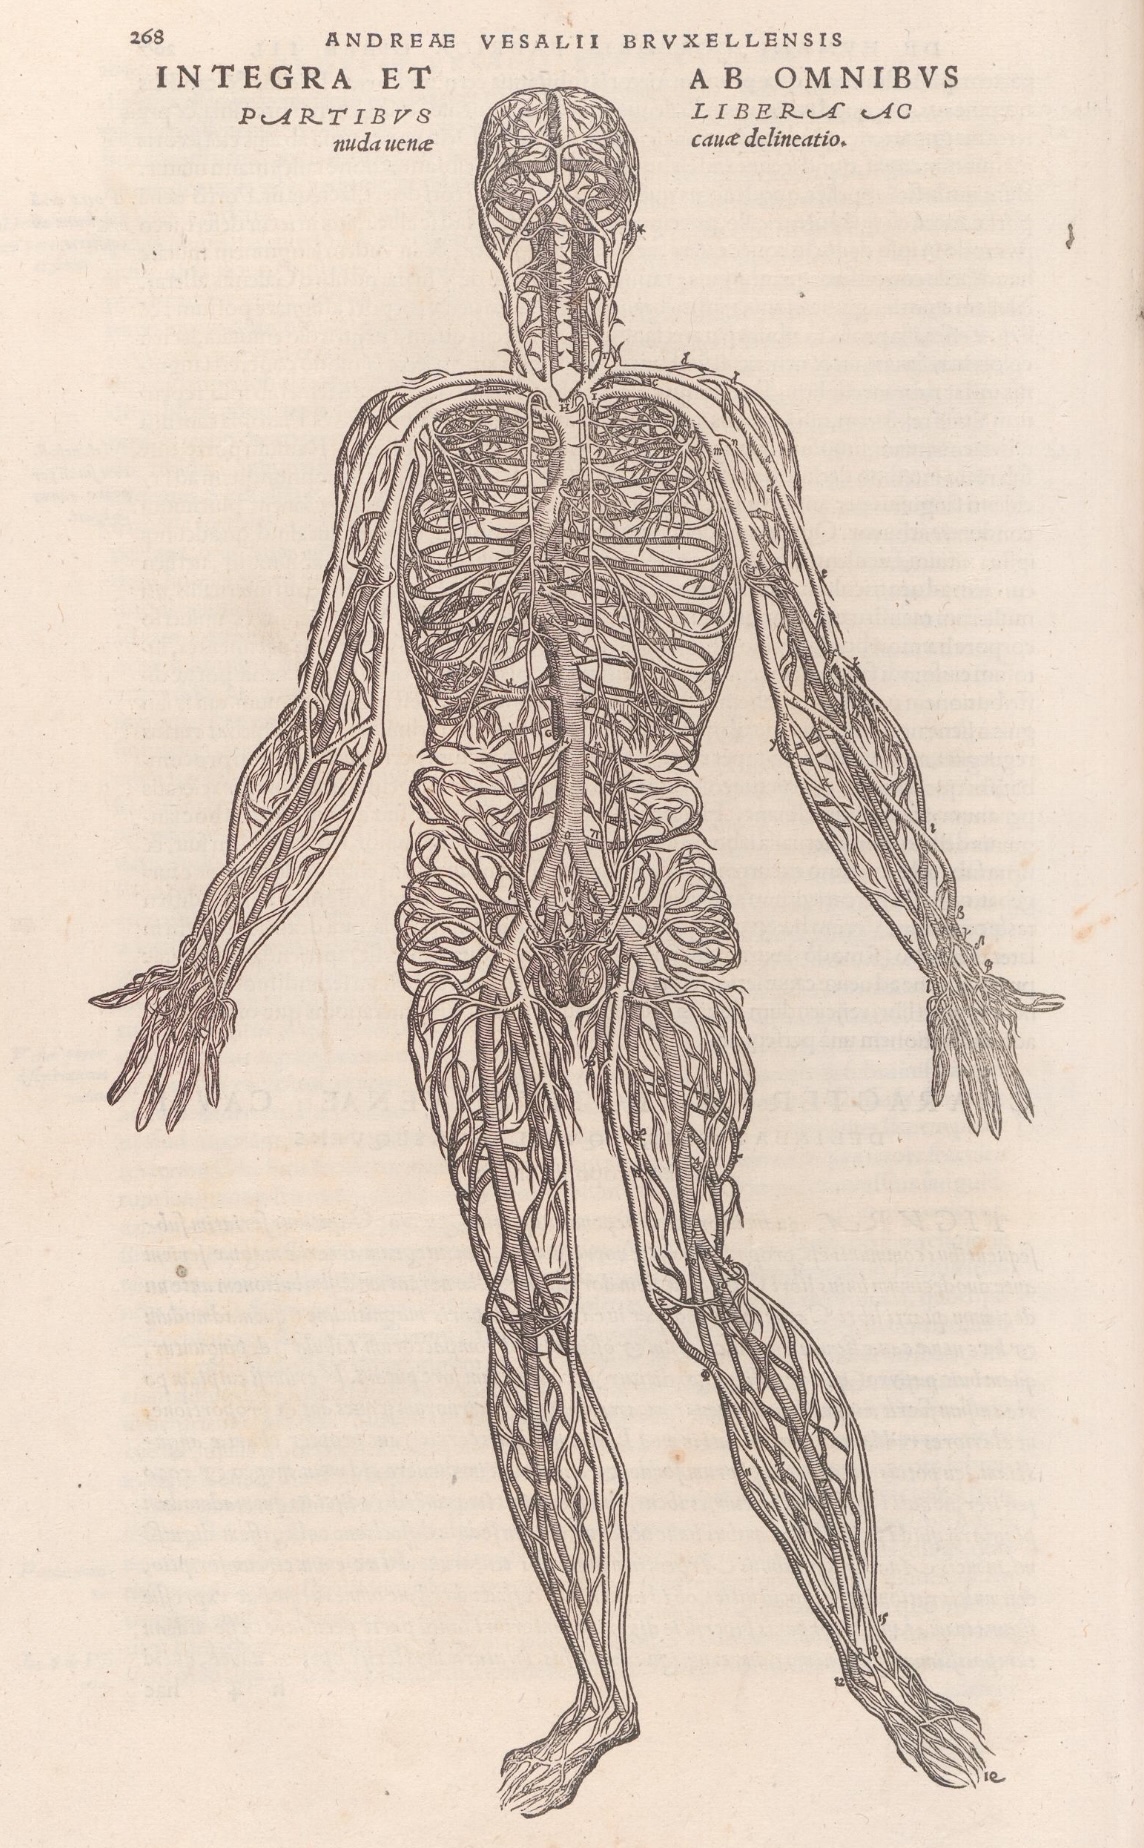
Vesalius, 1514 // PAGE 268 // Vessels of the human body.
doi.org/10.3931/e-rara-20094